Transcriptomic Analysis of Degradative Pathways for Azo Dye Acid Blue 113 in Sphingomonas melonis B-2 from the Dye Wastewater Treatment Process
- PMID: 35208892
- PMCID: PMC8877305
- DOI: 10.3390/microorganisms10020438
Transcriptomic Analysis of Degradative Pathways for Azo Dye Acid Blue 113 in Sphingomonas melonis B-2 from the Dye Wastewater Treatment Process
Abstract
Background: Acid Blue 113 (AB113) is a typical azo dye, and the resulting wastewater is toxic and difficult to remove.
Methods: The experimental culture was set up for the biodegradation of the azo dye AB113, and the cell growth and dye decolorization were monitored. Transcriptome sequencing was performed in the presence and absence of AB113 treatment. The key pathways and enzymes involved in AB113 degradation were found through pathway analysis and enrichment software (GO, EggNog and KEGG).
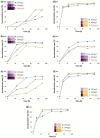
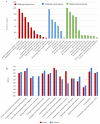
Results: S. melonis B-2 achieved more than 80% decolorization within 24 h (50 and 100 mg/L dye). There was a positive relationship between cell growth and the azo dye degradation rate. The expression level of enzymes involved in benzoate and naphthalene degradation pathways (NADH quinone oxidoreductase, N-acetyltransferase and aromatic ring-hydroxylating dioxygenase) increased significantly after the treatment of AB113.
Conclusions: Benzoate and naphthalene degradation pathways were the key pathways for AB113 degradation. NADH quinone oxidoreductase, N-acetyltransferase, aromatic ring-hydroxylating dioxygenase and CYP450 were the key enzymes for AB113 degradation. This study provides evidence for the process of AB113 biodegradation at the molecular and biochemical level that will be useful in monitoring the dye wastewater treatment process at the full-scale treatment.
Keywords: Acid Blue 113; azo dye; biodegradation; decolorization; dye wastewater treatment.
Conflict of interest statement
The authors declare that they have no known competing financial interests or personal relationships that could have appeared to influence the work reported in this paper.
Figures


References
-
- Singh K., Arora S. Removal of Synthetic Textile Dyes from Wastewaters: A Critical Review on Present Treatment Technologies. Crit. Rev. Environ. Sci. Technol. 2011;41:807–878. doi: 10.1080/10643380903218376. - DOI
-
- Saratale R., Saratale G.D., Chang J., Govindwar S. Bacterial decolorization and degradation of azo dyes: A review. J. Taiwan Inst. Chem. Eng. 2011;42:138–157. doi: 10.1016/j.jtice.2010.06.006. - DOI
-
- Khehra M.S., Saini H.S., Sharma D.K., Chadha B.S., Chimni S. Decolorization of various azo dyes by bacterial consortium. Dye. Pigment. 2005;67:55–61. doi: 10.1016/j.dyepig.2004.10.008. - DOI
Grants and funding
LinkOut - more resources
Full Text Sources
Molecular Biology Databases

