

Bacterial Biofilm Formation on Nano-Copper Added PLA Suited for 3D Printed Face Masks
- PMID: 35208893
- PMCID: PMC8875673
- DOI: 10.3390/microorganisms10020439
Bacterial Biofilm Formation on Nano-Copper Added PLA Suited for 3D Printed Face Masks
Abstract
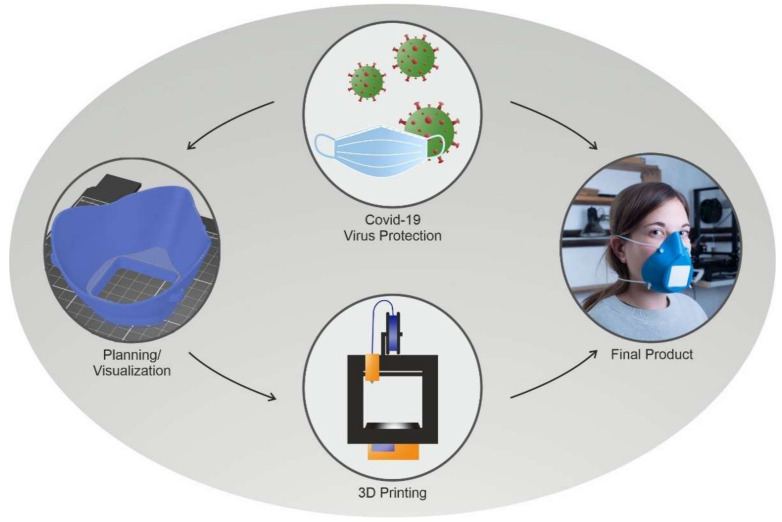
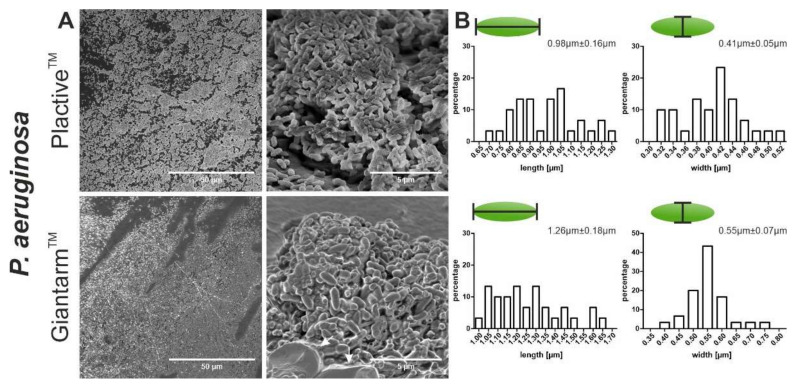
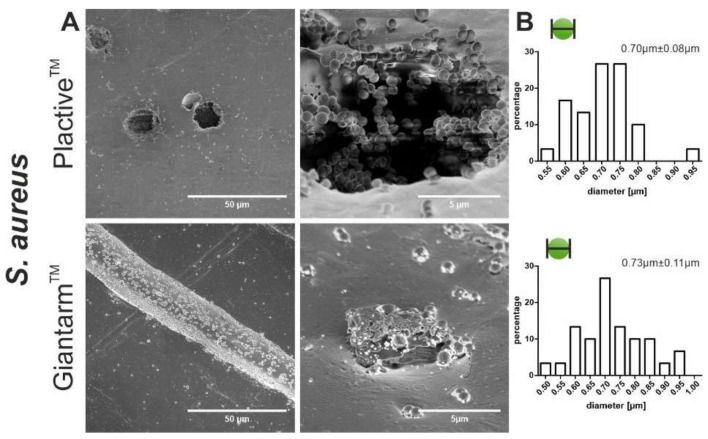
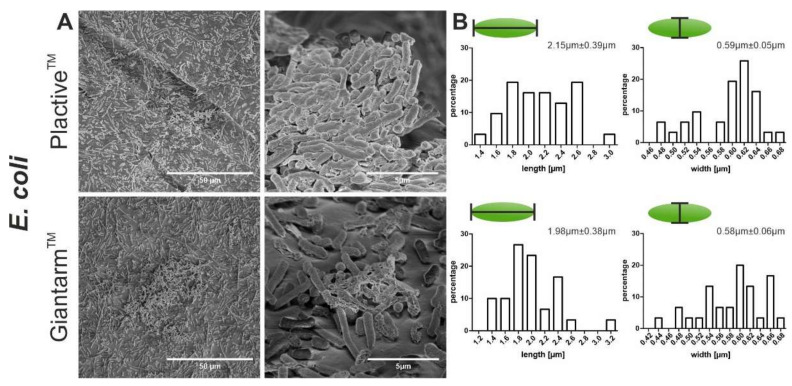
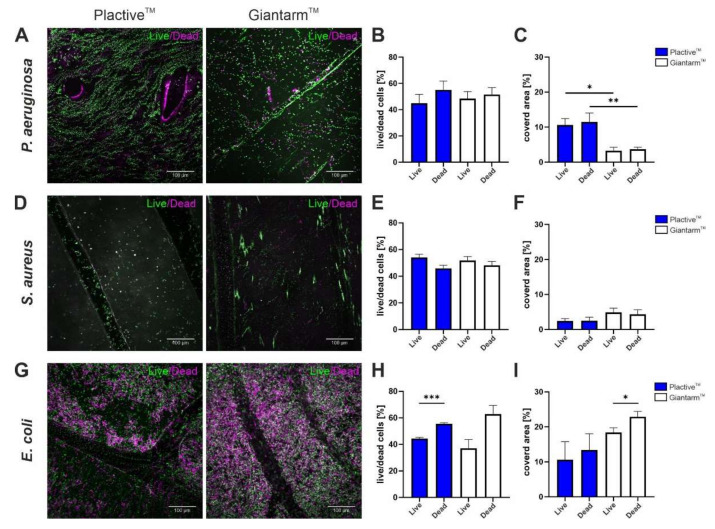
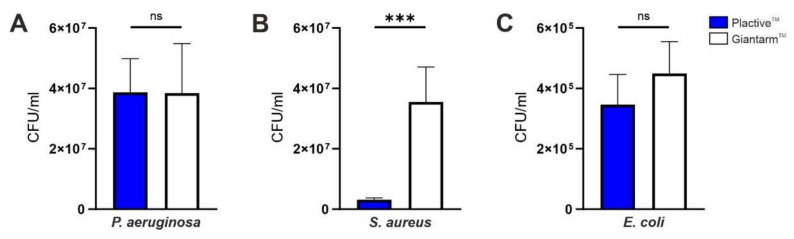
The COVID-19 Pandemic leads to an increased worldwide demand for personal protection equipment in the medical field, such as face masks. New approaches to satisfy this demand have been developed, and one example is the use of 3D printing face masks. The reusable 3D printed mask may also have a positive effect on the environment due to decreased littering. However, the microbial load on the 3D printed objects is often disregarded. Here we analyze the biofilm formation of Pseudomonas aeruginosa, Staphylococcus aureus, and Escherichia coli on suspected antimicrobial Plactive™ PLA 3D printing filaments and non-antimicrobial Giantarm™ PLA. To characterize the biofilm-forming potential scanning electron microscopy (SEM), Confocal scanning electron microscopy (CLSM) and colony-forming unit assays (CFU) were performed. Attached cells could be observed on all tested 3D printing materials. Gram-negative strains P. aeruginosa and E. coli reveal a strong uniform growth independent of the tested 3D filament (for P. aeruginosa even with stressed induced growth reaction by Plactive™). Only Gram-positive S. aureus shows strong growth reduction on Plactive™. These results suggest that the postulated antimicrobial Plactive™ PLA does not affect Gram-negative bacteria species. These results indicate that reusable masks, while better for our environment, may pose another health risk.
Keywords: 3D printing; E. coli; P. aeruginosa; PLA; S. aureus; antimicrobial; biofilm; face masks; nano-copper; personal protective equipment.
Conflict of interest statement
The authors declare no conflict of interest.
Figures

Similar articles
-
Bacterial Biofilm Growth on 3D-Printed Materials.Front Microbiol. 2021 May 28;12:646303. doi: 10.3389/fmicb.2021.646303. eCollection 2021. Front Microbiol. 2021. PMID: 34122361 Free PMC article.
-
Perimeter and carvacrol-loading regulate angiogenesis and biofilm growth in 3D printed PLA scaffolds.J Control Release. 2022 Dec;352:776-792. doi: 10.1016/j.jconrel.2022.10.060. Epub 2022 Nov 11. J Control Release. 2022. PMID: 36336096
-
3D Printers in Hospitals: Bacterial Contamination of Common and Antimicrobial 3D-Printed Material.bioRxiv [Preprint]. 2024 Mar 31:2024.03.30.587440. doi: 10.1101/2024.03.30.587440. bioRxiv. 2024. PMID: 38585826 Free PMC article. Preprint.
-
Use of 3D printed connectors to redesign full face snorkeling masks in the COVID-19 era: A preliminary technical case-study.Ann 3D Print Med. 2021 Sep;3:100023. doi: 10.1016/j.stlm.2021.100023. Epub 2021 Jun 26. Ann 3D Print Med. 2021. PMID: 38620734 Free PMC article. Review.
-
COVID-19: The Use of 3D Printing to Address PPE Shortage during a Pandemic-A Safety Perspective.J Chem Health Saf. 2020 Nov 23;27(6):335-340. doi: 10.1021/acs.chas.0c00089. Epub 2020 Nov 3. J Chem Health Saf. 2020. PMID: 34191964 Review.
Cited by
-
Magnetron Sputtering of Transition Metals as an Alternative Production Means for Antibacterial Surfaces.Microorganisms. 2022 Sep 15;10(9):1843. doi: 10.3390/microorganisms10091843. Microorganisms. 2022. PMID: 36144445 Free PMC article.
-
Preparation and Biochemical and Microbial Behavior of Poly(Lactide) Composites with Polyethersulfone and Copper-Complexed Cellulose Phosphate.Materials (Basel). 2025 Jun 22;18(13):2954. doi: 10.3390/ma18132954. Materials (Basel). 2025. PMID: 40649442 Free PMC article.
-
Nanogallium-poly(L-lactide) Composites with Contact Antibacterial Action.Pharmaceutics. 2024 Feb 4;16(2):228. doi: 10.3390/pharmaceutics16020228. Pharmaceutics. 2024. PMID: 38399282 Free PMC article.
-
3D Printing of Virucidal Polymer Nanocomposites (PLA/Copper Nanoparticles).Polymers (Basel). 2025 Jan 22;17(3):283. doi: 10.3390/polym17030283. Polymers (Basel). 2025. PMID: 39940486 Free PMC article.
-
Nanoscale Technologies in the Fight against COVID-19: From Innovative Nanomaterials to Computer-Aided Discovery of Potential Antiviral Plant-Derived Drugs.Biomolecules. 2022 Jul 30;12(8):1060. doi: 10.3390/biom12081060. Biomolecules. 2022. PMID: 36008954 Free PMC article. Review.
References
-
- [(accessed on 13 February 2022)]. Available online: https://www.Who.Int/Emergencies/Diseases/Novel-Coronavirus-2019/Advice-f....
-
- Spennemann D.H.R. COVID face masks: Policy shift results in increased littering. Sustainability. 2021;13:9875. doi: 10.3390/su13179875. - DOI
LinkOut - more resources
Full Text Sources
