Review
. 2022 Feb 18;27(4):1396.
doi: 10.3390/molecules27041396.

BODIPY Conjugates as Functional Compounds for Medical Diagnostics and Treatment

Affiliations
Review

BODIPY Conjugates as Functional Compounds for Medical Diagnostics and Treatment

Elena Antina et al. Molecules. .

Abstract

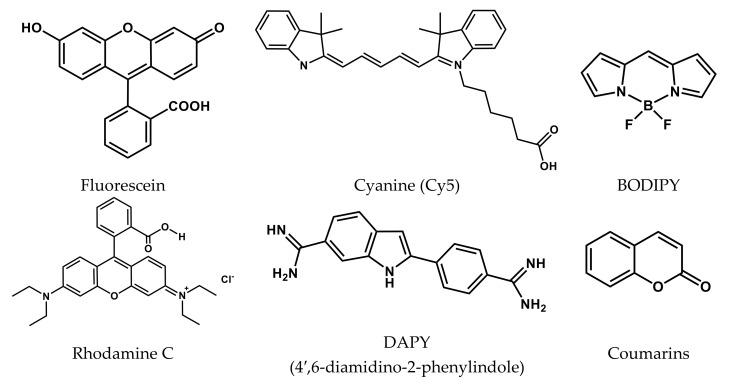
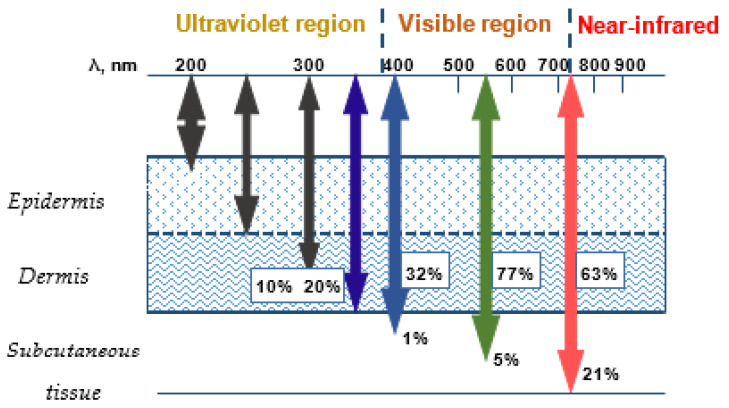
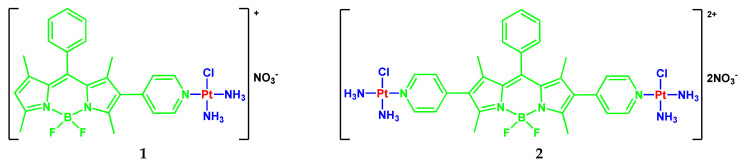
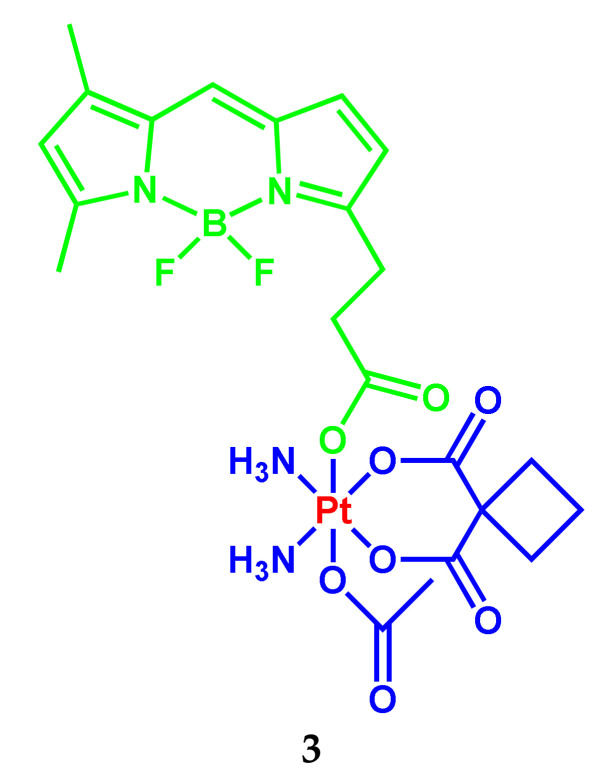
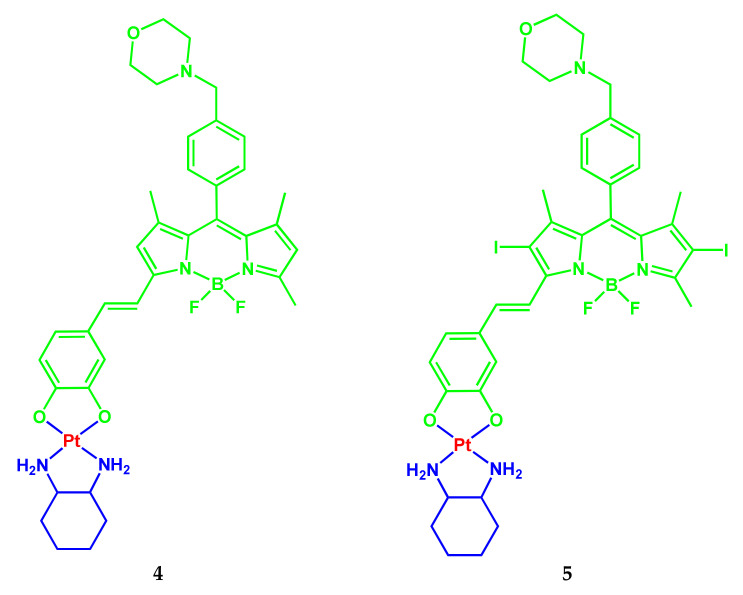
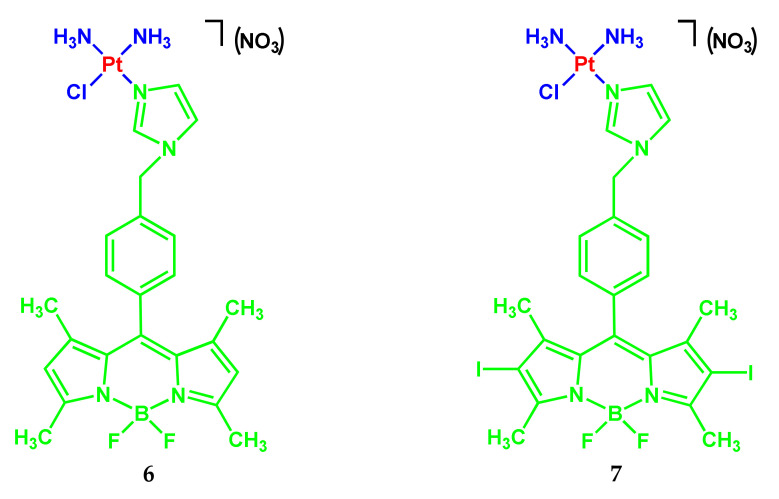
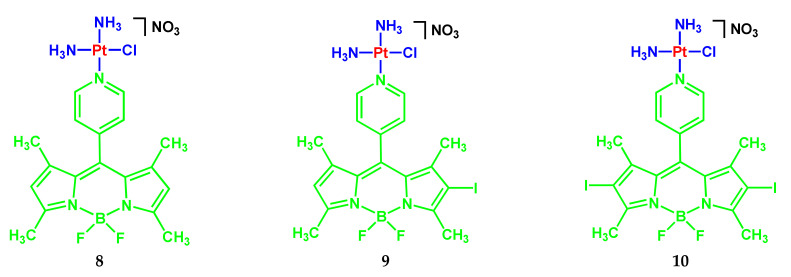
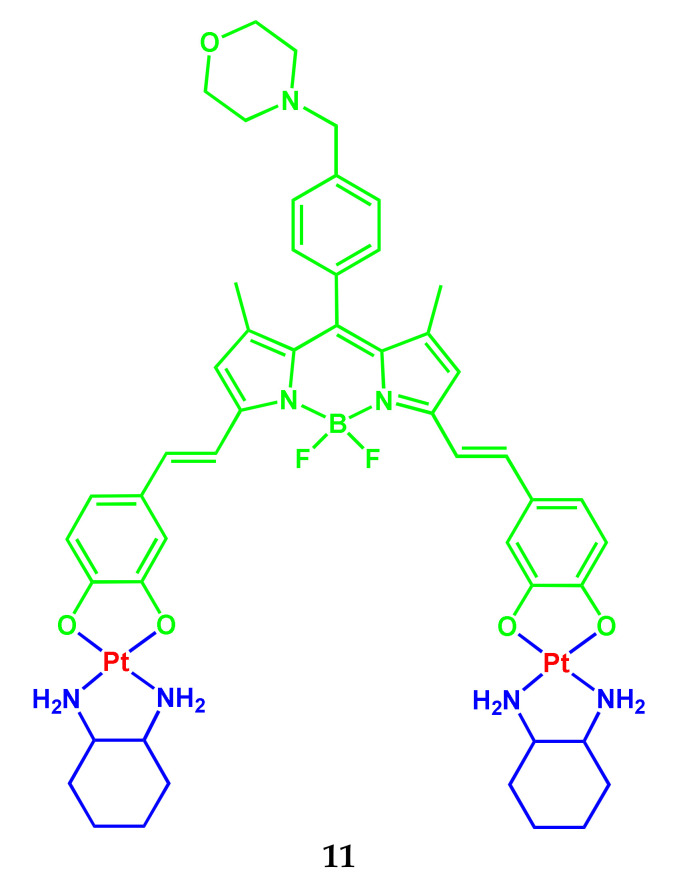
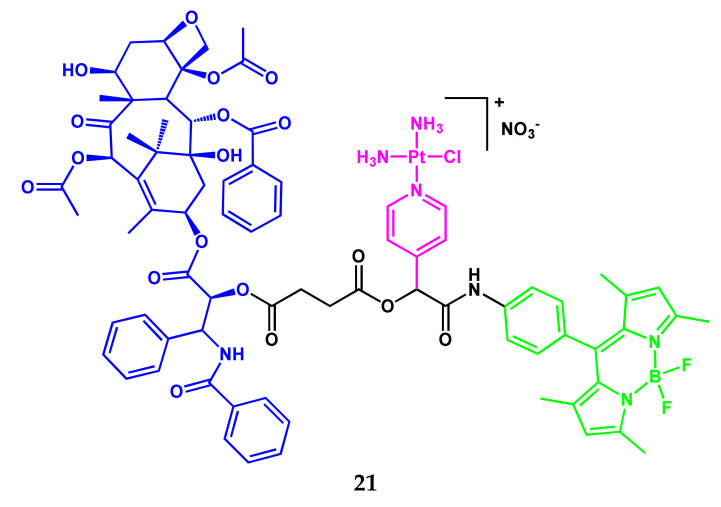
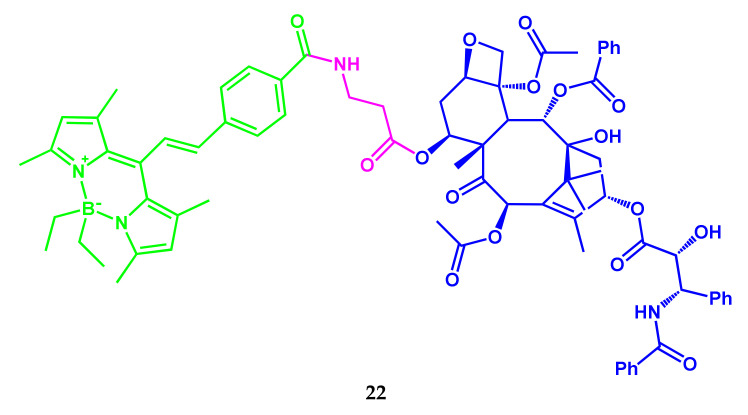
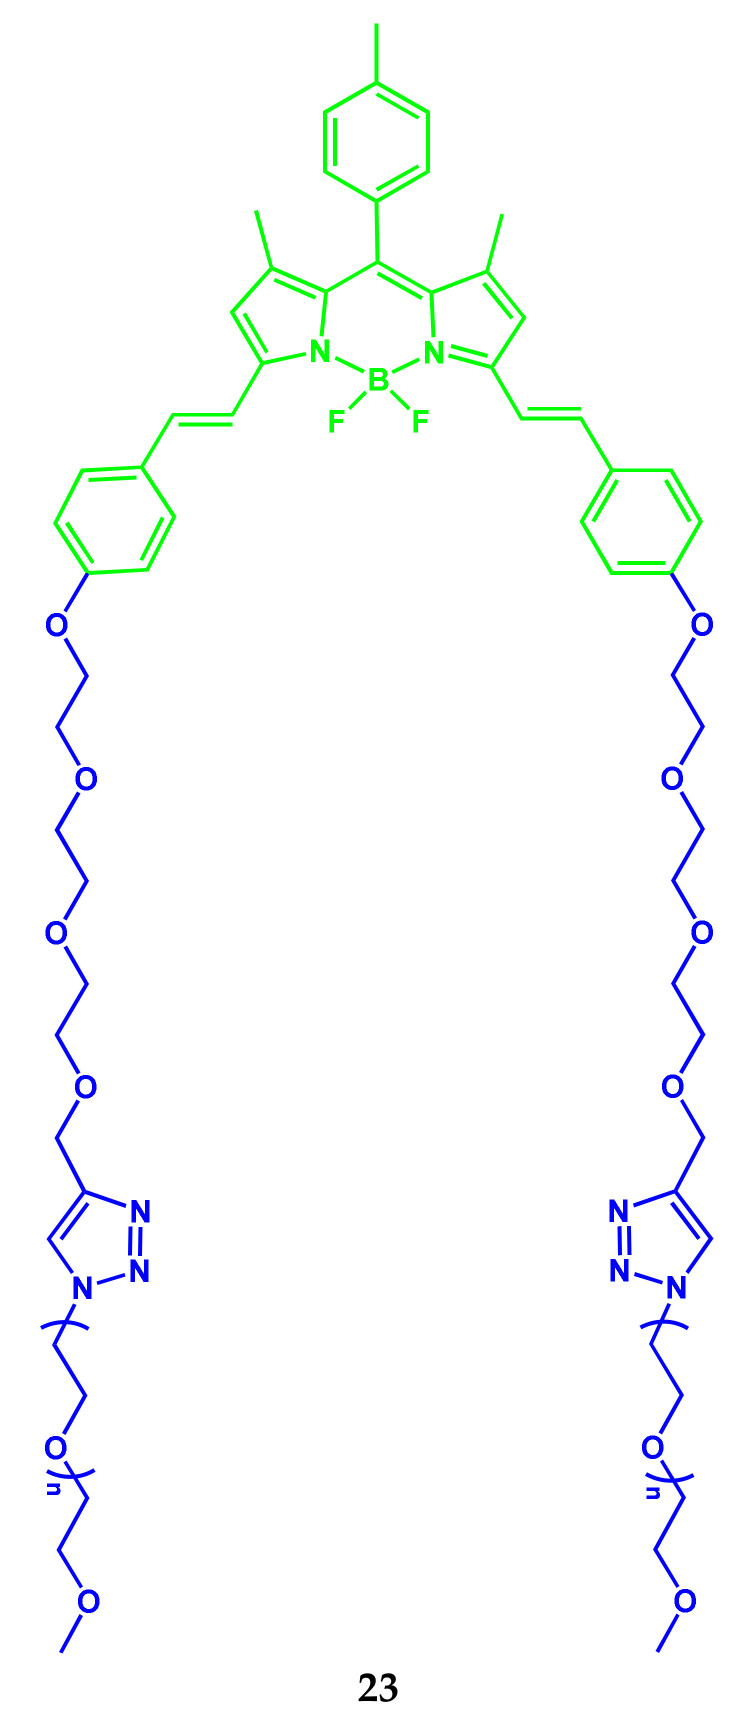
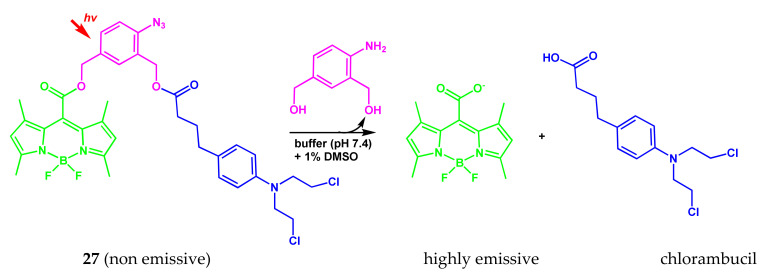
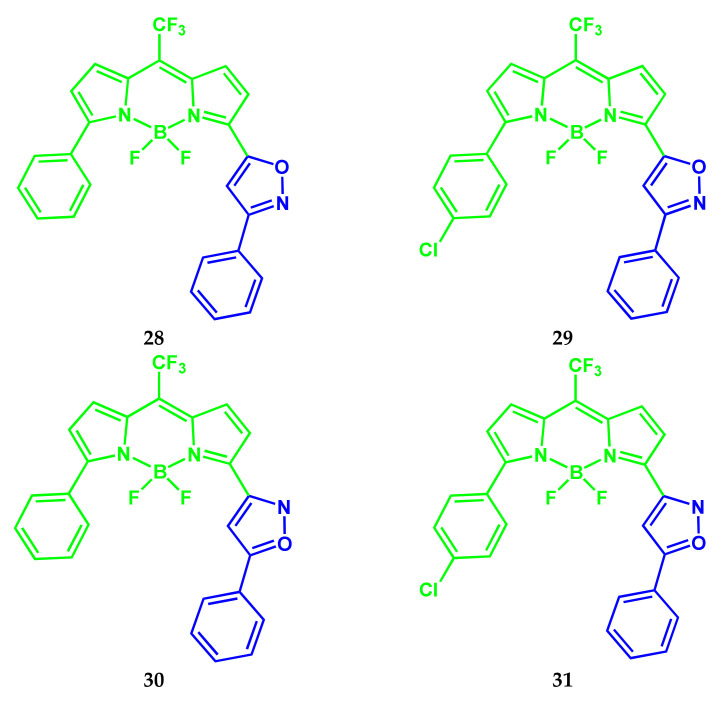
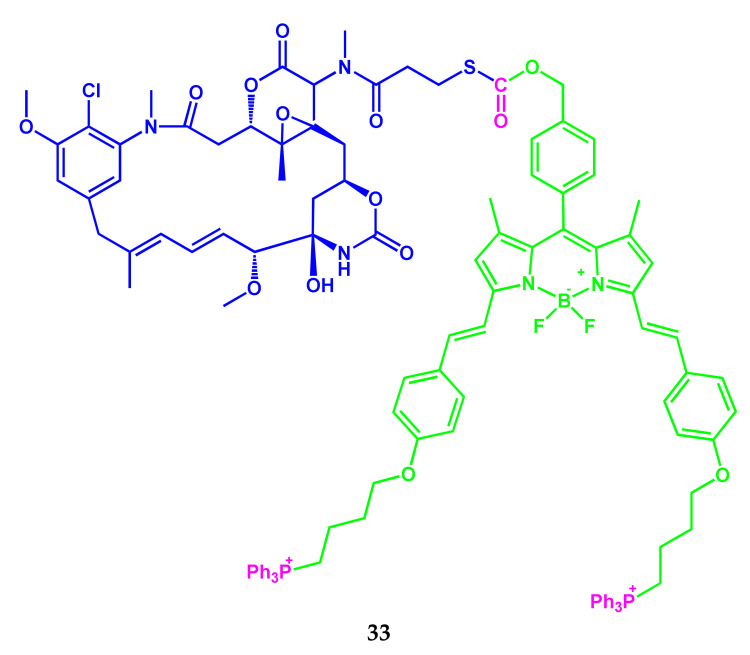
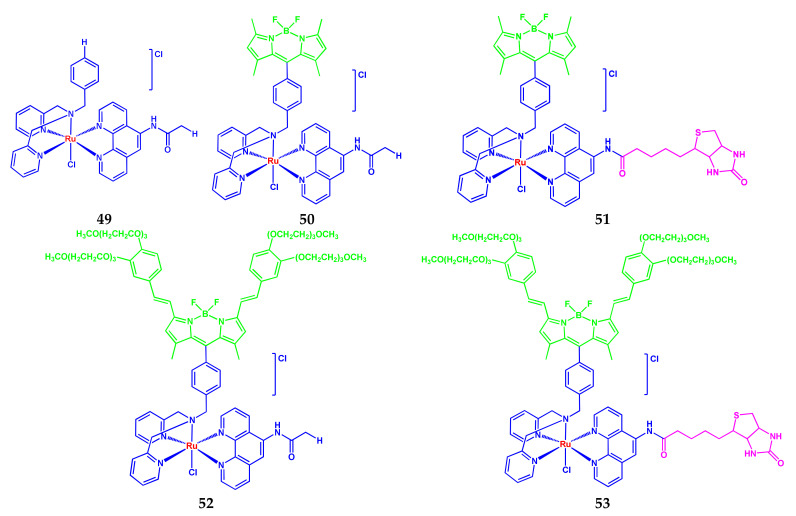
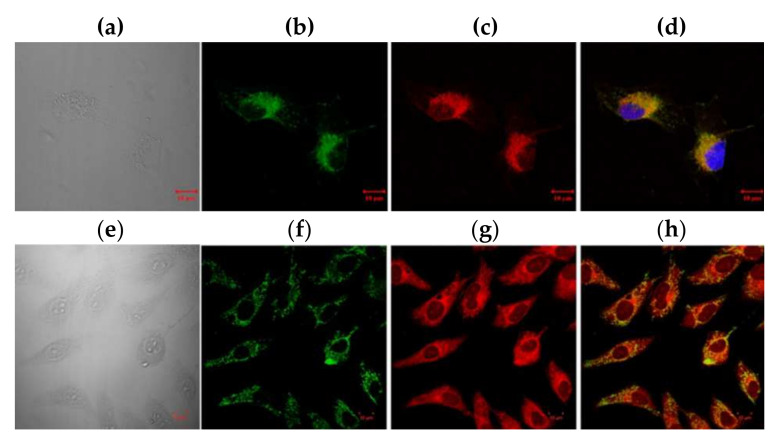
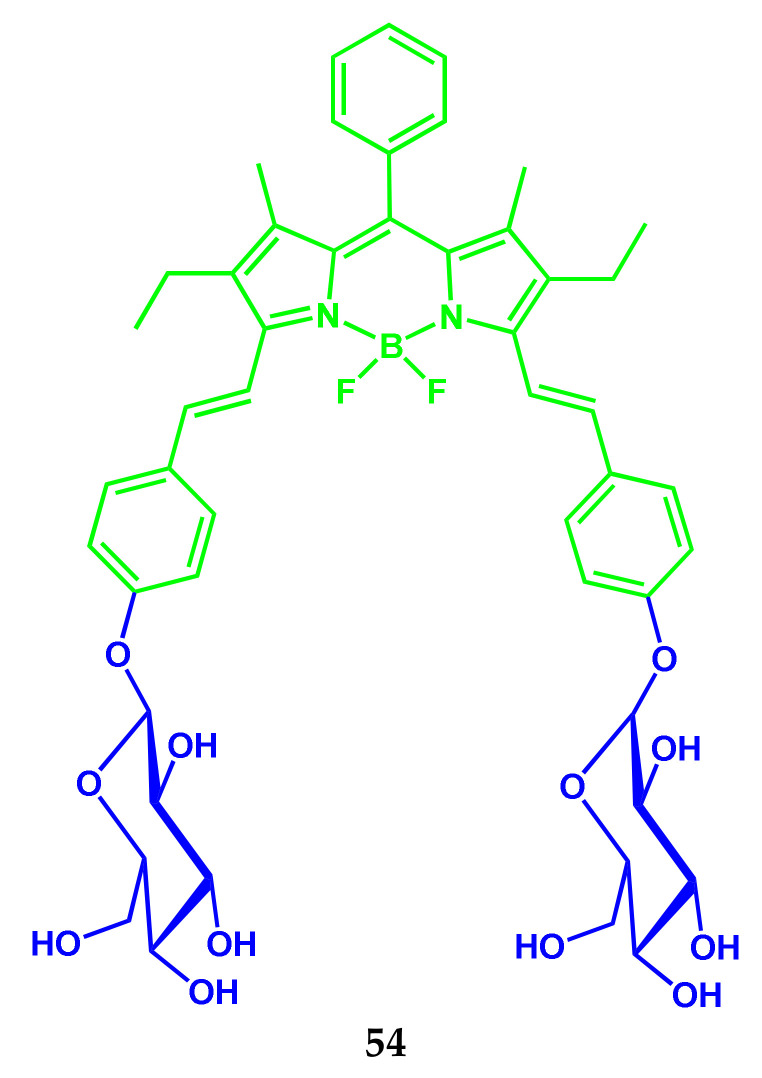
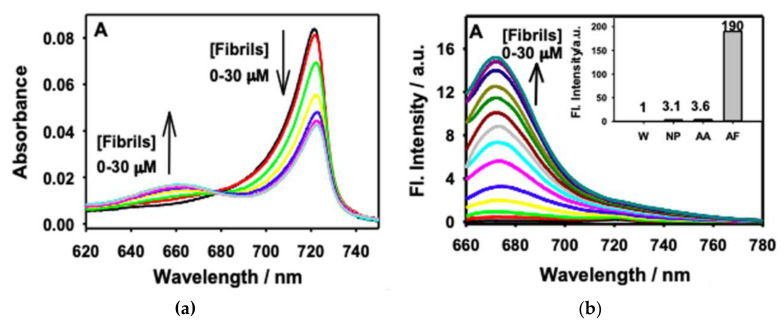
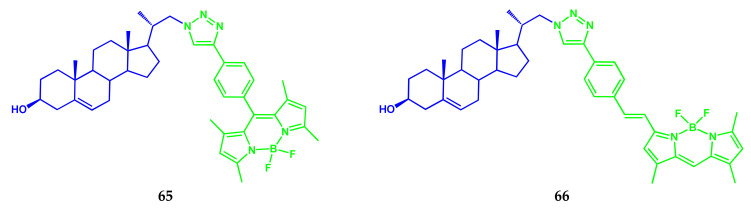
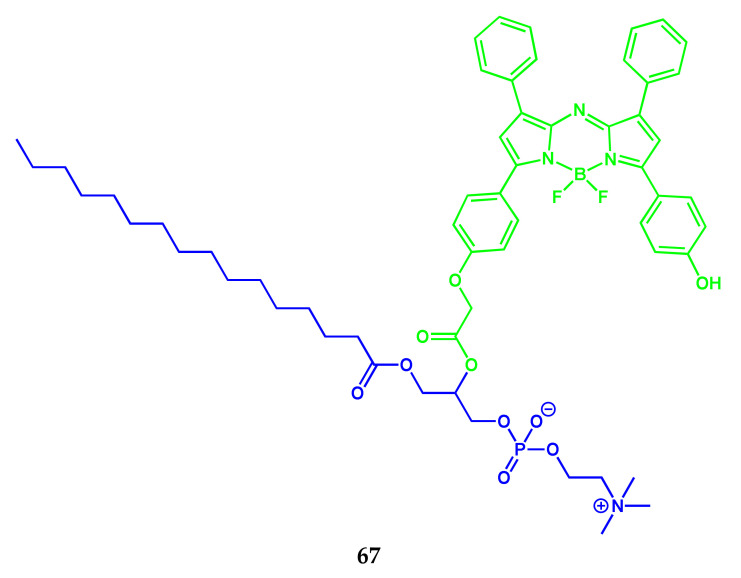
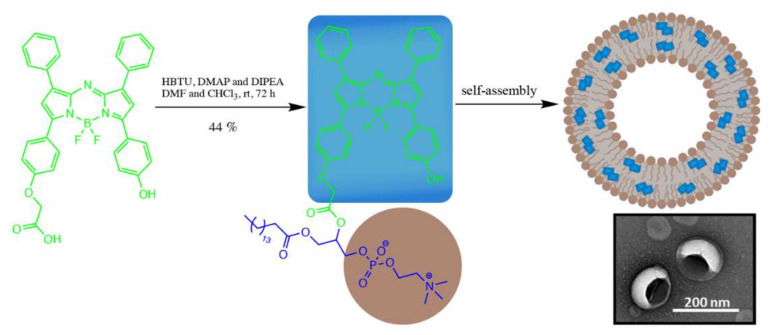
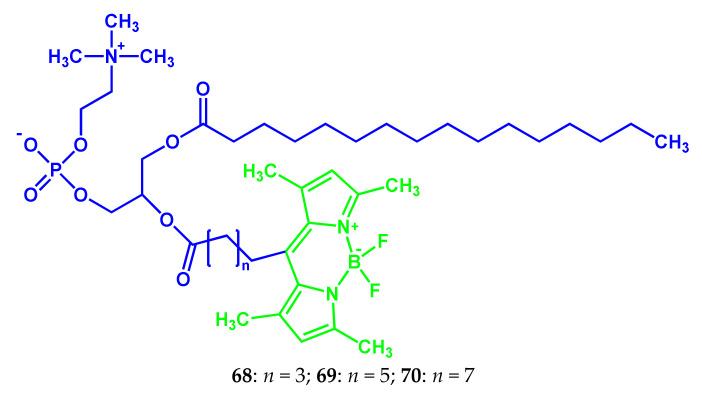
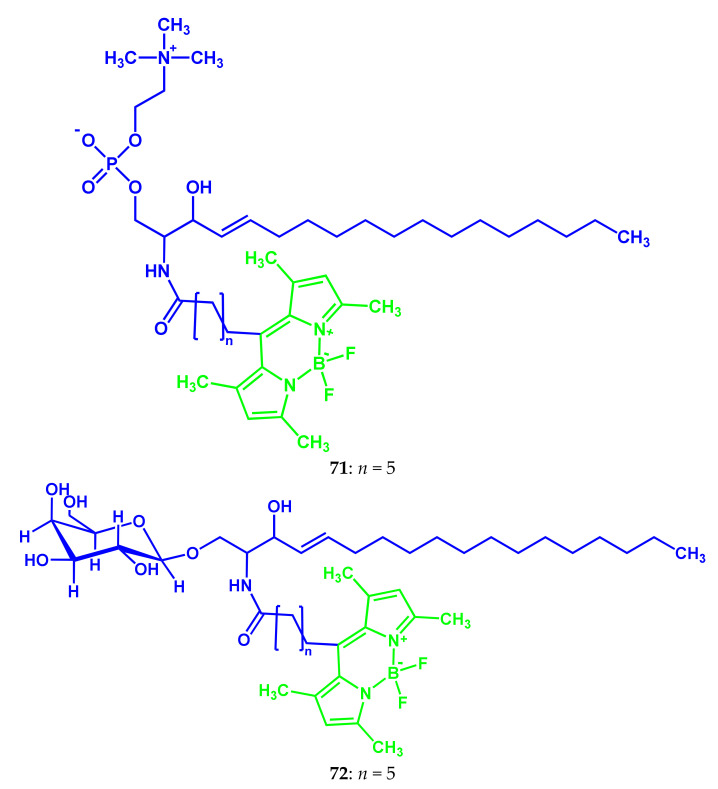
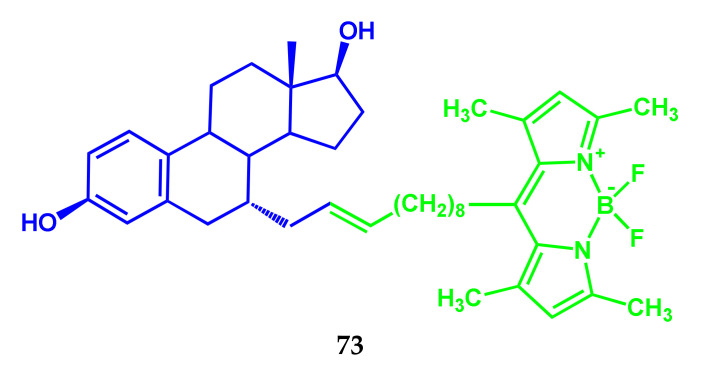
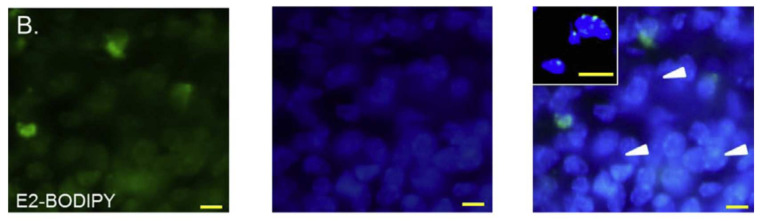
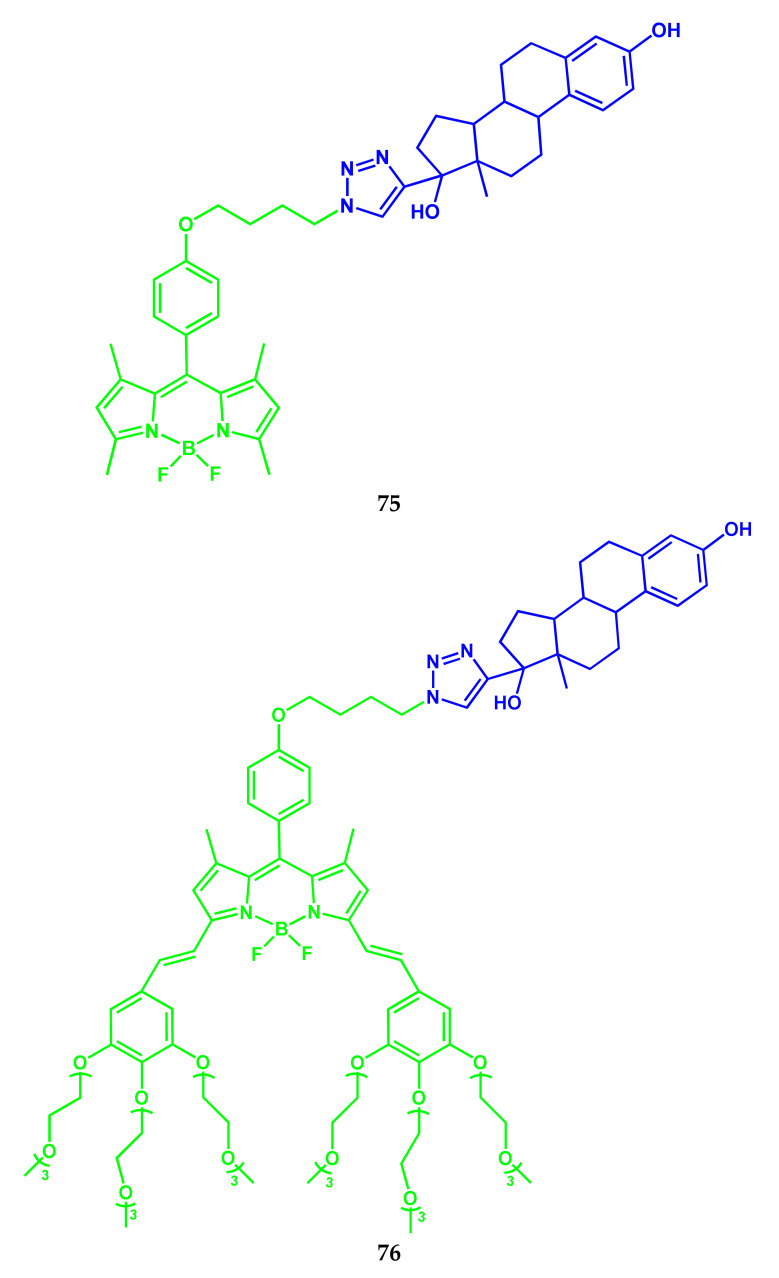
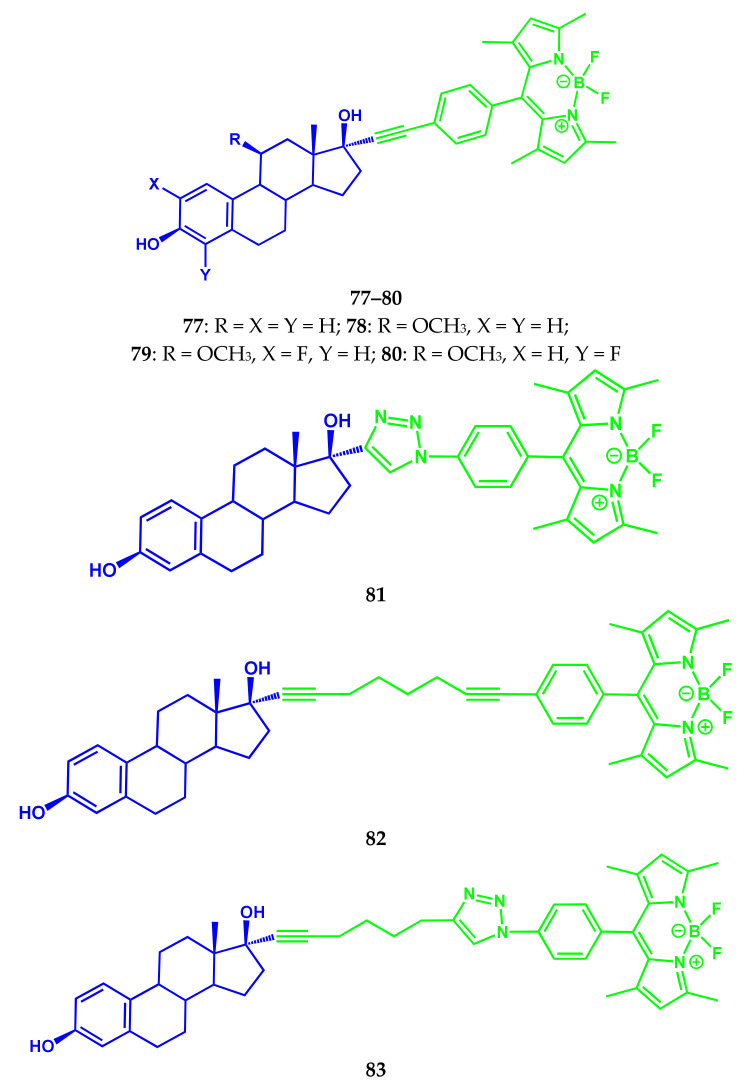
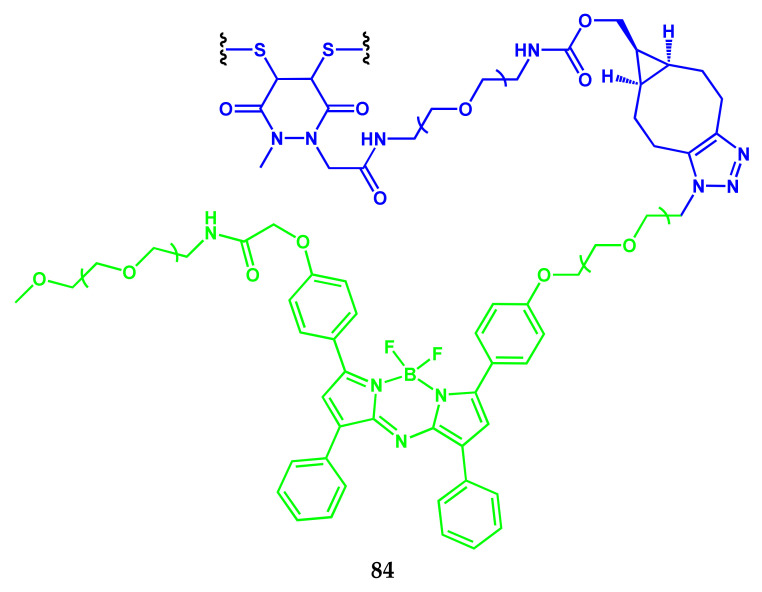
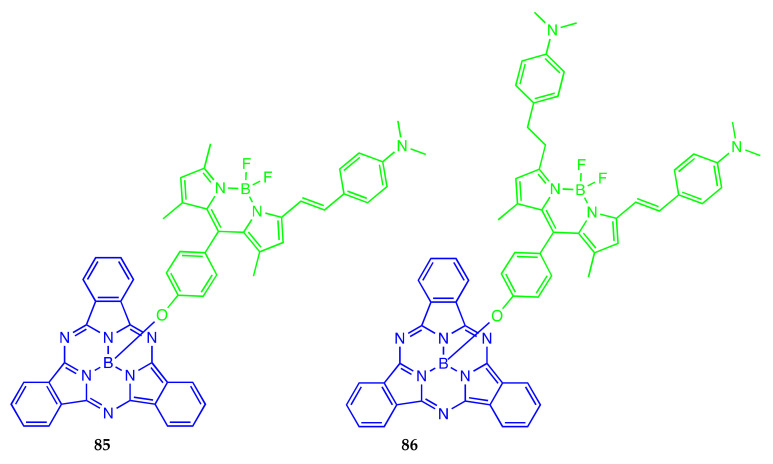
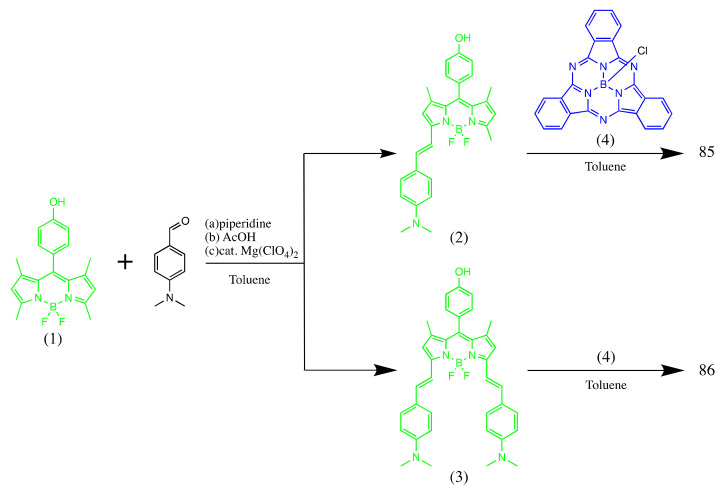
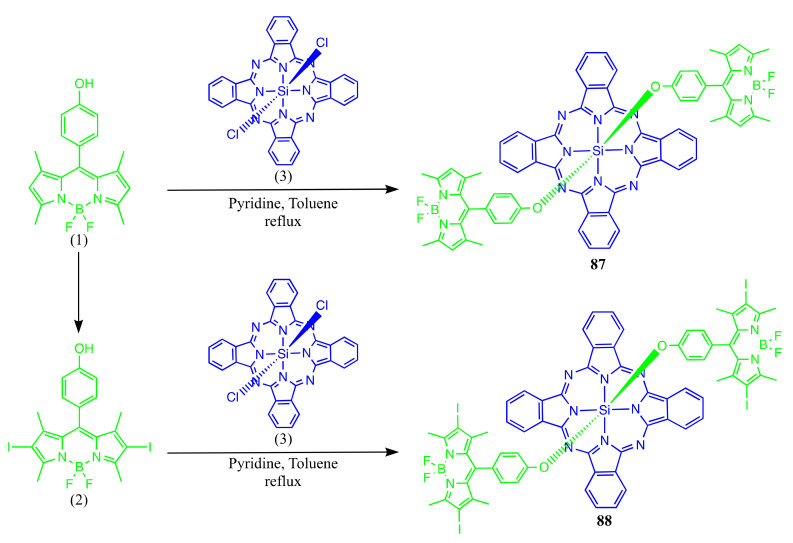
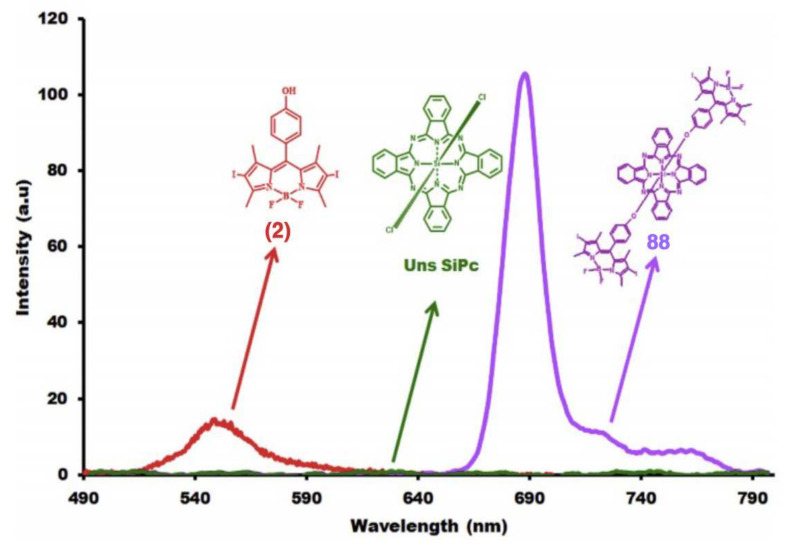
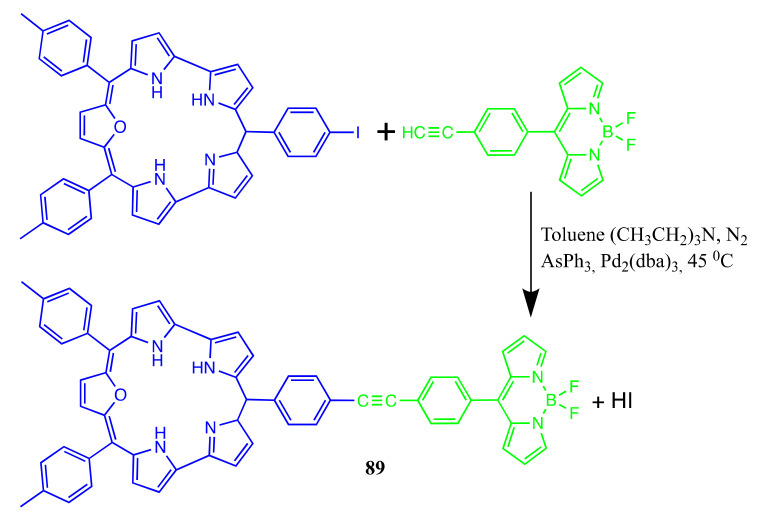
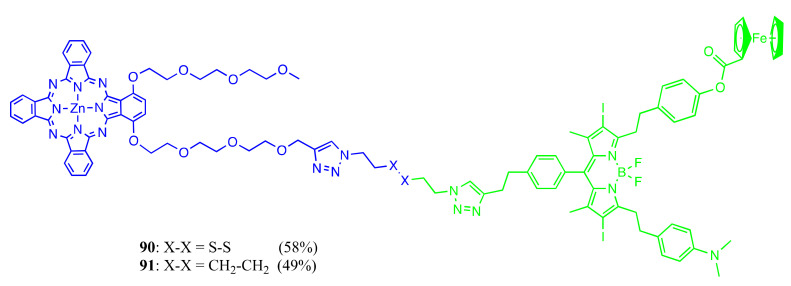
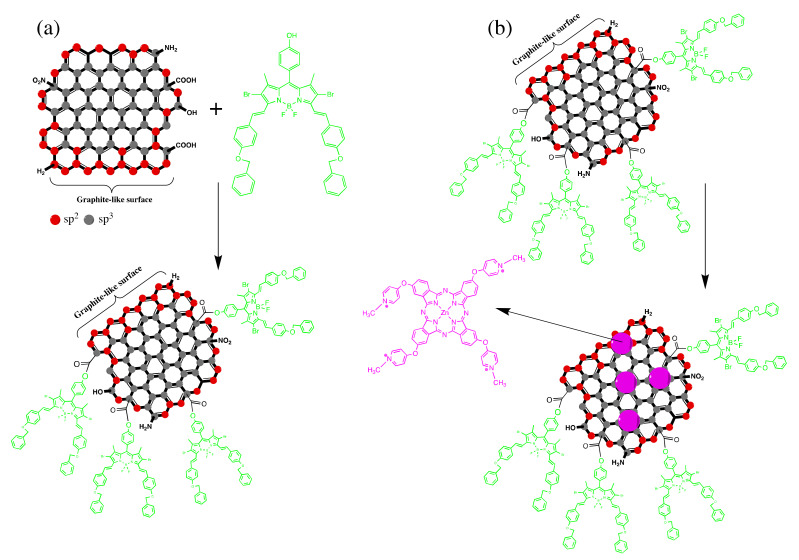
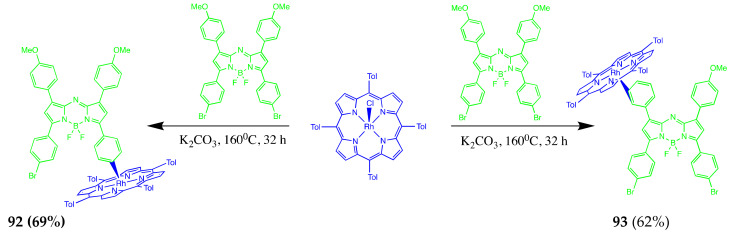
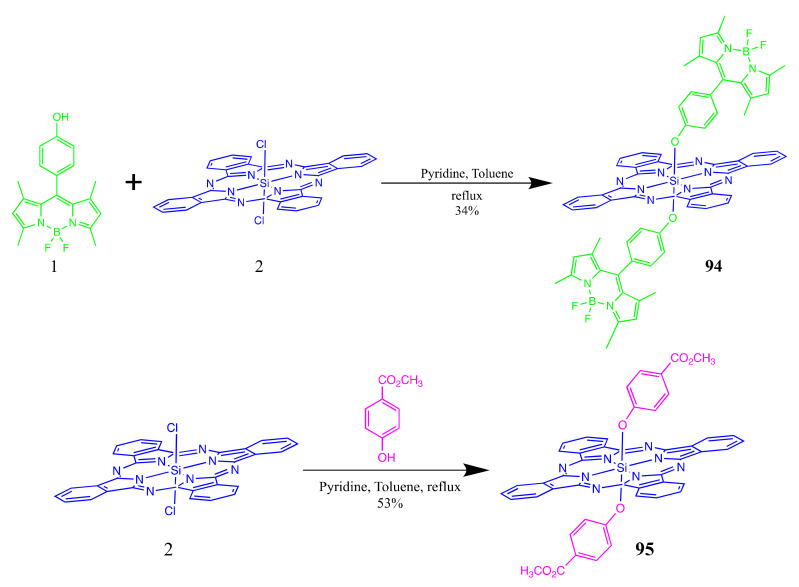
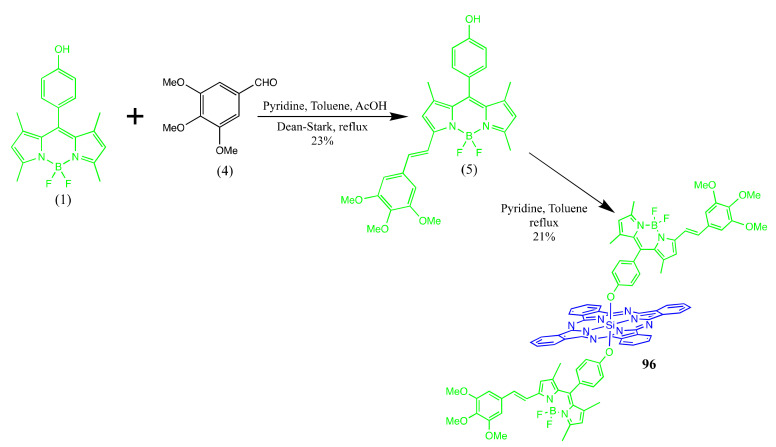
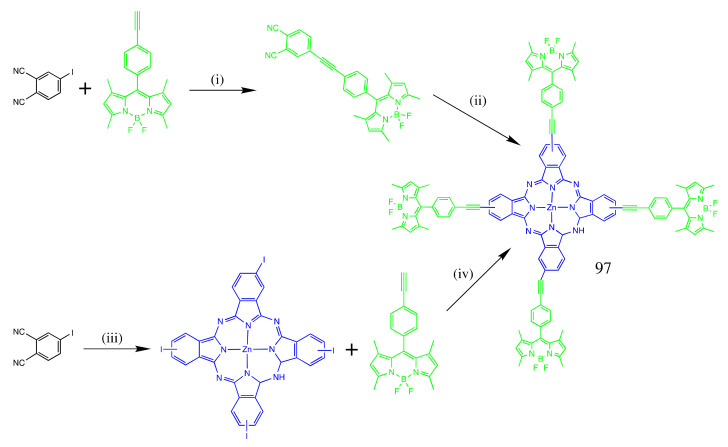
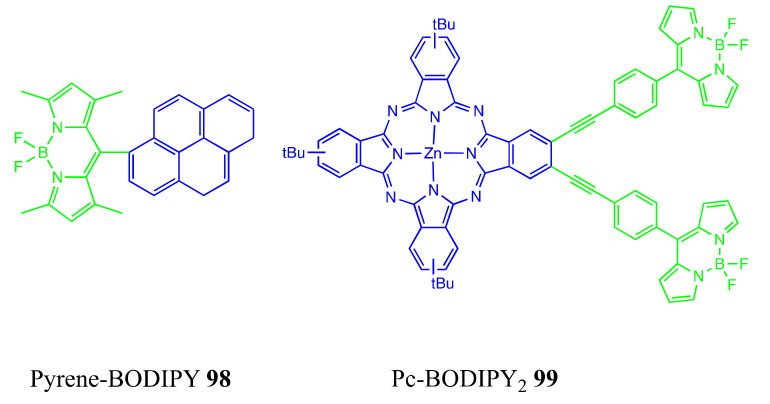
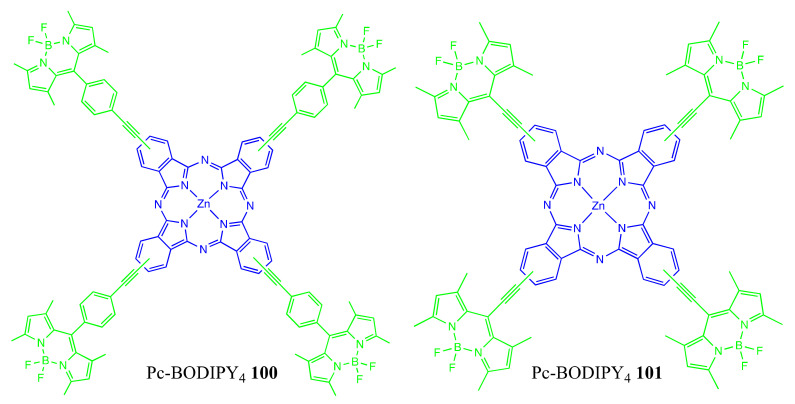
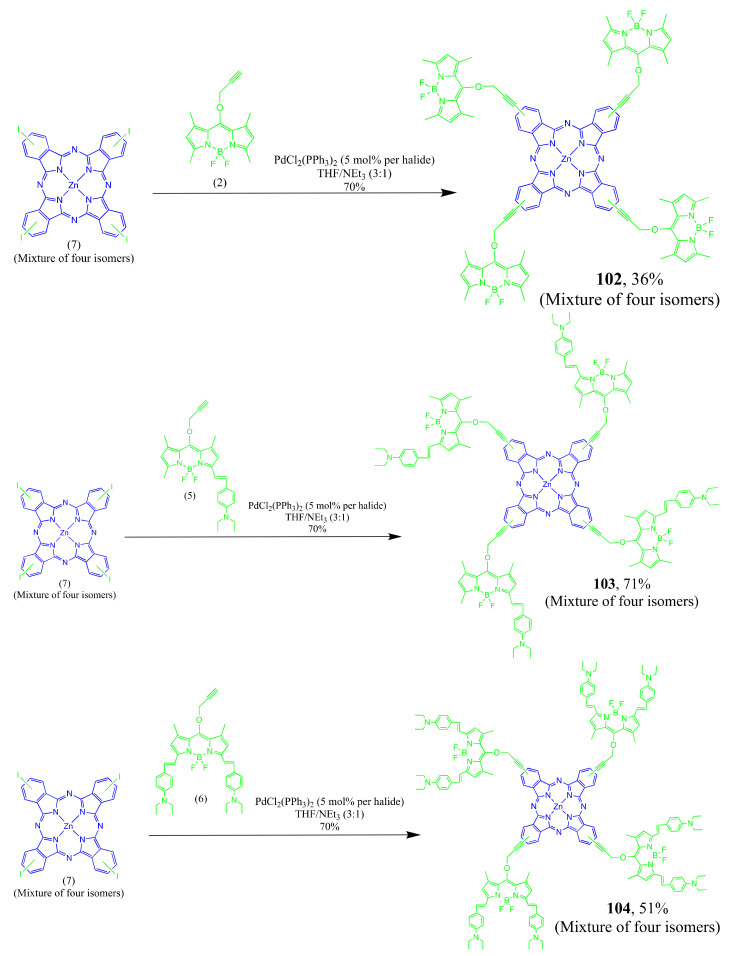
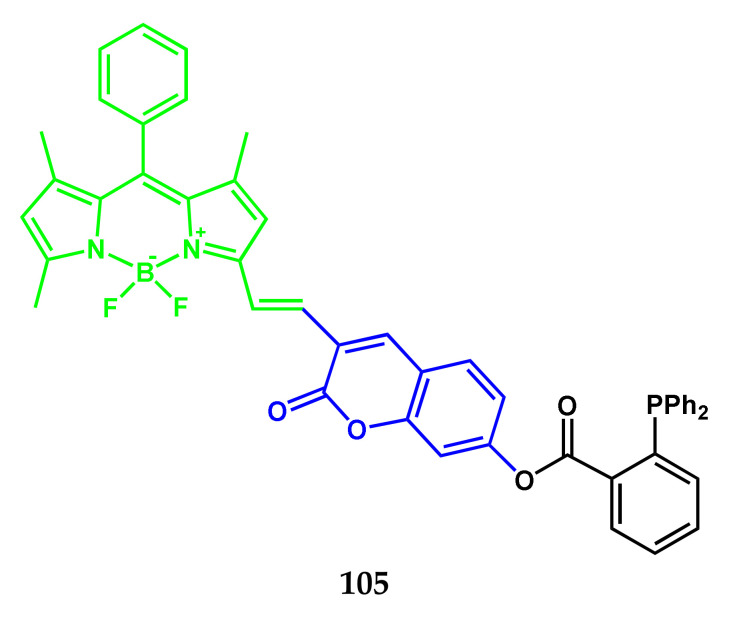
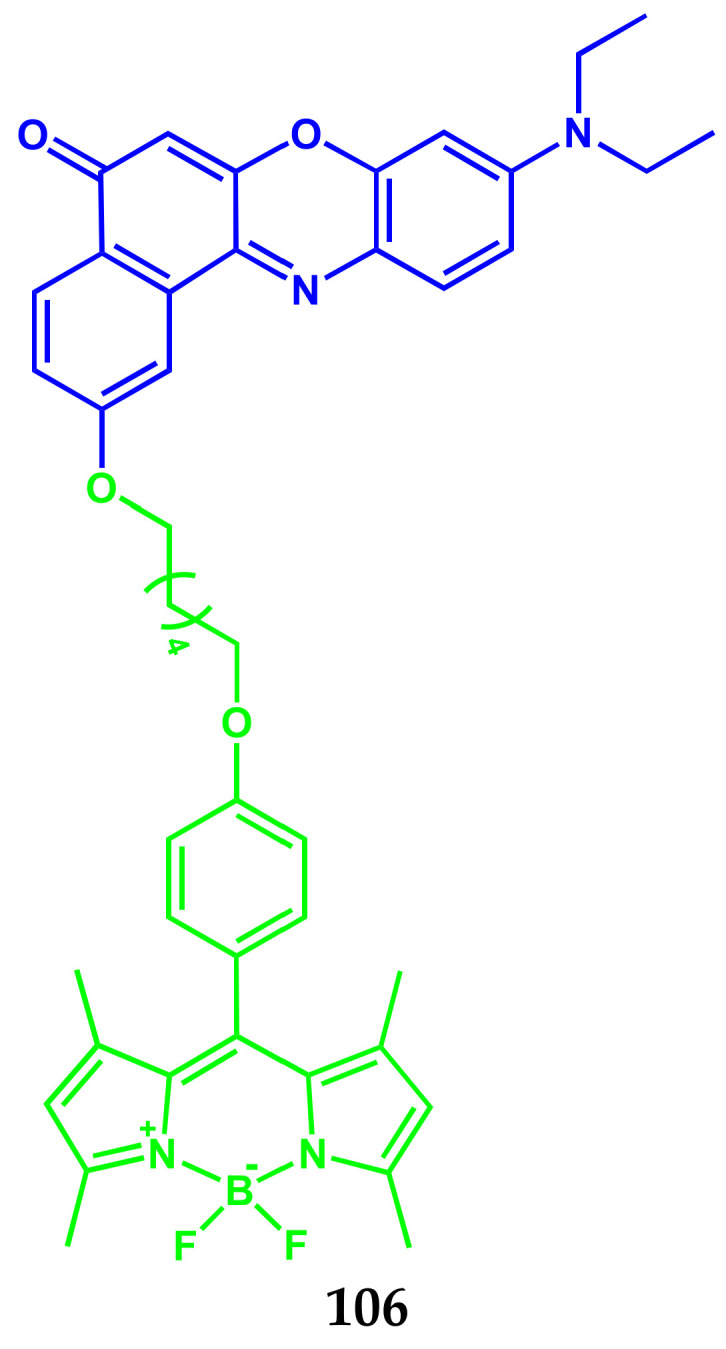
Fluorescent dyes absorbing and emitting in the visible and near-IR regions are promising for the development of fluorescent probes for labeling and bio-visualization of body cells. The ability to absorb and emit in the long-wavelength region increases the efficiency of recording the spectral signals of the probes due to the higher permeability of the skin layers. Compared to other fluorescent dyes, BODIPYs are attractive due to their excellent photophysical properties-narrow absorption and emission, intense fluorescence, simple signal modulation for the practical applications. As part of conjugates with biomolecules, BODIPY could act as a biomarker, but as therapeutic agent, which allows solving several problems at once-labeling or bioimaging and treatment based on the suppression of pathogenic microflora and cancer cells, which provides a huge potential for practical application of BODIPY conjugates in medicine. The review is devoted to the discussion of the recent, promising directions of BODIPY application in the field of conjugation with biomolecules. The first direction is associated with the development of BODIPY conjugates with drugs, including compounds of platinum, paclitaxel, chlorambucil, isoxazole, capsaicin, etc. The second direction is devoted to the labeling of vitamins, hormones, lipids, and other biomolecules to control the processes of their transport, localization in target cells, and metabolism. Within the framework of the third direction, the problem of obtaining functional optically active materials by conjugating BODIPY with other colored and fluorescent particles, in particular, phthalocyanines, is being solved.

Keywords: BODIPY; biomarker; conjugate; drug delivery; fluorescent label; luminophore.


Conflict of interest statement

The authors declare no conflict of interest.

Figures

Figure 1
Figure 1
Structures of organic dyes.
Figure 2
Figure 2
The absorption ranges.
Scheme 1
Scheme 1
Structures of compounds 1 and 2.
Scheme 2
Scheme 2
Structure of compound 3.
Scheme 3
Scheme 3
Structures of compounds 4 and 5.
Scheme 4
Scheme 4
Structures of compounds 6 and 7.
Scheme 5
Scheme 5
Structures of compounds 8, 9 and 10.
Scheme 6
Scheme 6
Structure of compound 11.
Scheme 7
Scheme 7
Structure of compound 12.
Scheme 8
Scheme 8
Structure of compound 13.
Scheme 9
Scheme 9
Structures of compounds 14 and 15.
Figure 3
Figure 3
Fluorescence spectra of metallocycles 14 and 15 in different solvents (λex = 556 nm, c = 1.00 μM). Photographs of 14 and 15 under UV lamp at 365 nm in different solvents. Adapted from [14].
Scheme 10
Scheme 10
Structures of compounds 1619.
Figure 4
Figure 4
Confocal microscopic images of MCF-7 cells after 4 h of incubation with 17: (a) bright field, (b) fluorescence of Mito Tracker Deep Red, (c) fluorescence of 17, and (d) merged image of (b,c). Scale bar = 10 μm. Adapted from [15].
Scheme 11
Scheme 11
Structure of compound 20.
Figure 5
Figure 5
UV–Vis absorption (a) and fluorescence (b) spectra of nanoparticles 20 (NPs) in aqueous solution and free 20 in DMF/H2O 9:1. (c) Fluorescent photos 20 and NPs 20 in water and in DMF/H2O 9:1. Adapted from [16].
Scheme 12
Scheme 12
Structure of compound 21.
Scheme 13
Scheme 13
Structure of compound 22.
Scheme 14
Scheme 14
Structure of compound 23.
Figure 6
Figure 6
CLSM images of live/dead assay (Calcein-AM/PI) on co-stained MDAMB-231 cells after incubation with (a) PEGylated BODIPY without lighting, (b) PEGylated BODIPY with lighting, (c) Dox@PEGylated BODIPY with lighting. The Calcein-AM has green fluorescence and the PI has red fluorescence. Scale bar was 100 μm. Adapted from [19].
Scheme 15
Scheme 15
Structures of compounds 24 and 25.
Figure 7
Figure 7
CLSM images of MCF-7 cells with BODIPY-PEG 24 or Et-BODIPY-PEG 25 at various concentrations, with the nucleus labeled with 4′,6-diamidino-2-phenylindole (DAPI). Top: DAPI images; middle: BODIPY-PEG/Et-BODIPY-PEG dye images; bottom: merged images of both (10.0 μM). Adapted from [20].
Scheme 16
Scheme 16
Structure of compound 26.
Scheme 17
Scheme 17
Conversion of meso-ester-BODIPY into meso-carboxylate-BODIPY.
Scheme 18
Scheme 18
Structure of compound 27 and release process of drug molecule and fluorescent dye upon light activation.
Scheme 19
Scheme 19
Structures of compounds 2831.
Scheme 20
Scheme 20
Structure of compound 32.
Scheme 21
Scheme 21
Structure of compound 33.
Figure 8
Figure 8
Cellular fluorescence images of prodrug 33 treated MCF-7 cells. The cells were incubated with 33 (1 mM) for 2 h and then irradiated with a blue LED for: (a) 0 min, (b) 10 min, (c) 30 min, and (d) 60 min. (e) Relative pixel intensity (n = 3) from the images. The pixel intensity from the images. The pixel of (d) is defined as 1.0. Scale bar 10 μm. λex 650 nm; λMon window of 530–710 nm. Adapted from [25].
Scheme 22
Scheme 22
Structure of compound 34.
Scheme 23
Scheme 23
Structure of compound 35.
Figure 9
Figure 9
The normalized absorption (purple) and emission spectra (green) of BODIPYmyrt in 1-octanol.
Figure 10
Figure 10
CLSM of bacterial cells (a) and fungal cells (b) stained by BODIPYmyrt and calcofluor-white (CFW). Scale bar is 10 μm. Adapted from [40].
Scheme 24
Scheme 24
Structures of compounds 3638.
Scheme 25
Scheme 25
Structures of compounds 3942.
Scheme 26
Scheme 26
The oxidized and reduced forms of compound 43.
Scheme 27
Scheme 27
Structure of compound 44.
Scheme 28
Scheme 28
Structures of compounds 4547.
Scheme 29
Scheme 29
Structure of compound 48.
Figure 11
Figure 11
Flow cytometric analysis of human fibroblasts cells incubated for 4, 24, or 48 h with 20 μM BODIPY-labeled vitamin B12 (a) or free BODIPY (b). Fluorescence microscopy images of human fibroblasts cells incubated 24 h with free BODIPY (c). Adapted from [47].
Scheme 30
Scheme 30
Structures of compounds 4953.
Figure 12
Figure 12
Confocal microscopic images of A549 cells after 4 h of incubation with 51 and 53. The top panels: (a) bright field, (b) fluorescence of 51, (c) fluorescence of Mitotracker deep red (MTR), (d) merged image of 51, Mitotracker deep red and Hoechst. The bottom panels: (e) bright field, (f) fluorescence of Mitotracker green (MTG), (g) fluorescence of 53, and (h) merged image of 53 and Mitotracker green. The overlap coefficient of 51 with Mitotracker red is ∼0.65, and that for 53 and Mitotracker green is ∼0.6. Scale bar represents 10 μm. Adapted from [48].
Scheme 31
Scheme 31
Structure of compound 54.
Figure 13
Figure 13
Changes in the absorption (a) and fluorescence (b) spectra of 54 (0.34 μM) upon addition of insulin fibrils (0–30 μM). Inset: Bar diagram for the change in emission intensity of 54 in water and different forms of insulin protein: W—water, NP—native protein, AA—amorphous aggregates, AF—amyloid fibrillar aggregates. Adapted from [49].
Scheme 32
Scheme 32
Structures of compounds 55 and 56.
Scheme 33
Scheme 33
Structure of compound 57.
Scheme 34
Scheme 34
Structures of compounds 5862.
Scheme 35
Scheme 35
Structures of compounds 63 and 64.
Scheme 36
Scheme 36
Structures of compounds 65 and 66.
Scheme 37
Scheme 37
Structure of compound 67.
Figure 14
Figure 14
Self-assembly 67 into a BODIPYsome nanoparticle (phospholipid head group in brown and aza-BODIPY in blue). Adapted from [55].
Scheme 38
Scheme 38
Structures of compounds 6872.
Scheme 38
Scheme 38
Structures of compounds 6872.
Scheme 39
Scheme 39
Structure of compound 73.
Figure 15
Figure 15
Subcellular localization of E2-BODIPY 73 in uteri of non-ovariectomized mice. The first image in each row is the emission fluorescence at 488 nm. The second image in each row is the image of the Hoechst 33,342 nuclear stain that has excitation/emission maxima at 350/461 nm when bound to DNA. The third image is a merged photo of the first two images. Row B shows intranuclear localization of E2-BODIPY. Adapted from [57].
Scheme 40
Scheme 40
Structure of compound 74.
Scheme 41
Scheme 41
Structures of compounds 75 and 76.
Scheme 42
Scheme 42
Structures of compounds 7783.
Scheme 43
Scheme 43
Structure of compound 84.
Scheme 44
Scheme 44
Structures and synthetic route for compounds 85 and 86.
Scheme 44
Scheme 44
Structures and synthetic route for compounds 85 and 86.
Scheme 45
Scheme 45
Structures and synthetic route for compounds 87 and 88.
Figure 16
Figure 16
Emission spectra of compounds (2), 88 and unsubstituted silicon(IV) phthalocyanine in toluene. Adapted from [63].
Scheme 46
Scheme 46
Structure and synthetic route for compound 89.
Scheme 47
Scheme 47
Structures of compounds 90 and 91.
Scheme 48
Scheme 48
Structures and synthetic route for the hybrid material of DND with BODIPY (a) and combined with ZnTPPcQ (b).
Figure 17
Figure 17
UV–Vis spectra of DNDs, ZnTPPcQ, BODIPY, DNDs-BODIPY and ZnTPPcQ-DND, and ZnTPPcQ-DNDs-BODIPY in (a) DMSO and (b) water (containing 1% DMSO) for all samples. Adapted from [66].
Scheme 49
Scheme 49
Structures and synthetic route for compounds 92 and 93.
Scheme 50
Scheme 50
Structures and synthetic route for compounds 94 and 95.
Scheme 51
Scheme 51
Structure and synthetic route for compound 96.
Scheme 52
Scheme 52
Structure and synthetic route for compound 97.
Scheme 53
Scheme 53
Structures of compounds 98, 99, 100, 101.
Scheme 53
Scheme 53
Structures of compounds 98, 99, 100, 101.
Scheme 54
Scheme 54
Structures and synthetic route for compounds 102, 103, 104.
Scheme 55
Scheme 55
Structure of compound 105.
Scheme 56
Scheme 56
Structure of compound 106.

Similar articles

Cited by

References

    1. Deng Z., Wang N., Ai F., Wang Z., Zhu G. Nanomaterial-mediated platinum drug-based combinatorial cancer therapy. View. 2021;2:20200030. doi: 10.1002/VIW.20200030. - DOI
    1. Cheff D.M., Hall M.D. A drug of such damned nature.1 challenges and opportunities in translational platinum drug research. View. 2017;60:4517–4532. doi: 10.1021/acs.jmedchem.6b01351. - DOI - PubMed
    1. Johnstone T.C., Suntharalingam K., Lippard S.J. The next generation of platinum drugs: Targeted pt(II) agents, nanoparticle delivery, and pt(IV) prodrugs. Chem. Rev. 2016;116:3436–3486. doi: 10.1021/acs.chemrev.5b00597. - DOI - PMC - PubMed
    1. Farrell N.P. Multi-platinum anti-cancer agents. Substitution-inert compounds for tumor selectivity and new targets. Chem. Soc. Rev. 2015;44:8773–8785. doi: 10.1039/C5CS00201J. - DOI - PubMed
    1. Wang X., Wang X., Guo Z. Functionalization of platinum complexes for biomedical applications. Acc. Chem. Res. 2015;48:2622–2631. doi: 10.1021/acs.accounts.5b00203. - DOI - PubMed

Substances