. 2022 Feb 24;21(1):31.
doi: 10.1186/s12933-022-01458-z.

MiR-30 promotes fatty acid beta-oxidation and endothelial cell dysfunction and is a circulating biomarker of coronary microvascular dysfunction in pre-clinical models of diabetes

Affiliations

MiR-30 promotes fatty acid beta-oxidation and endothelial cell dysfunction and is a circulating biomarker of coronary microvascular dysfunction in pre-clinical models of diabetes

Shawn Veitch et al. Cardiovasc Diabetol. .

Abstract

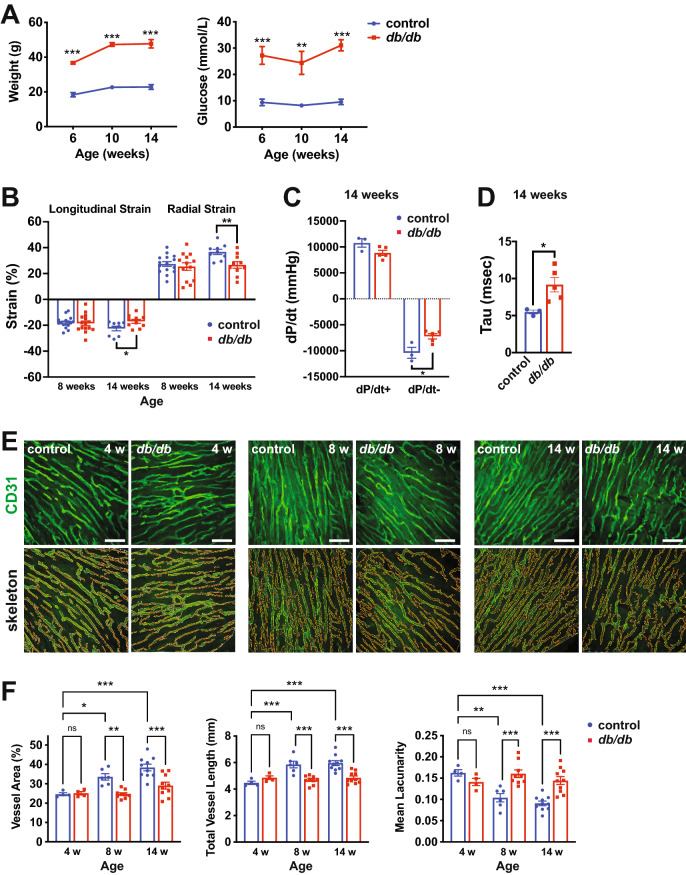
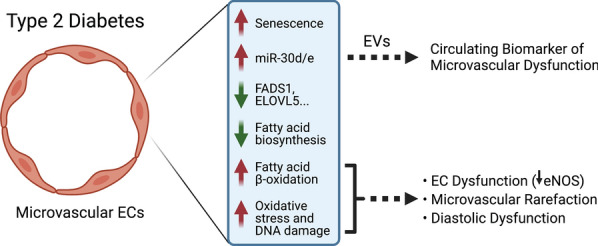
Background: Type 2 diabetes (T2D) is associated with coronary microvascular dysfunction, which is thought to contribute to compromised diastolic function, ultimately culminating in heart failure with preserved ejection fraction (HFpEF). The molecular mechanisms remain incompletely understood, and no early diagnostics are available. We sought to gain insight into biomarkers and potential mechanisms of microvascular dysfunction in obese mouse (db/db) and lean rat (Goto-Kakizaki) pre-clinical models of T2D-associated diastolic dysfunction.

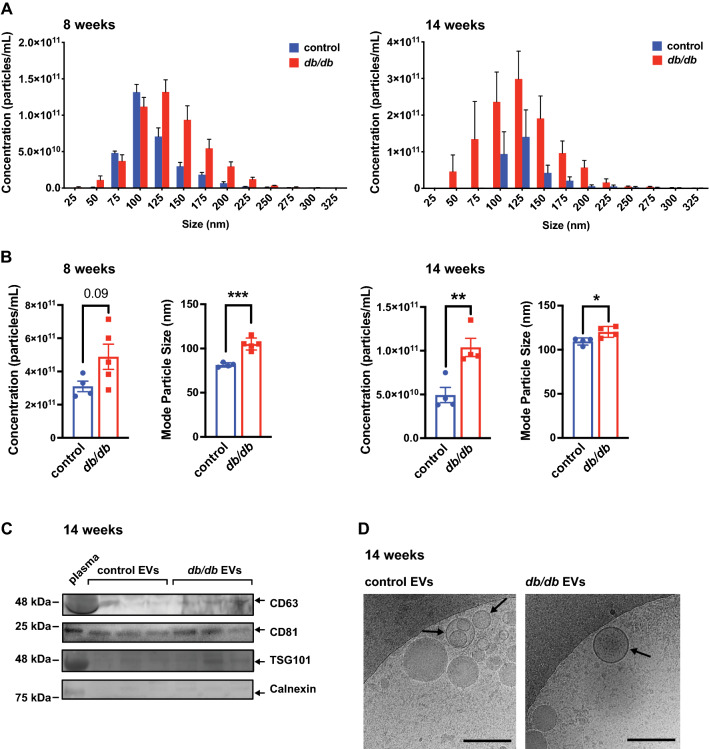
Methods: The microRNA (miRNA) content of circulating extracellular vesicles (EVs) was assessed in T2D models to identify biomarkers of coronary microvascular dysfunction/rarefaction. The potential source of circulating EV-encapsulated miRNAs was determined, and the mechanisms of induction and the function of candidate miRNAs were assessed in endothelial cells (ECs).

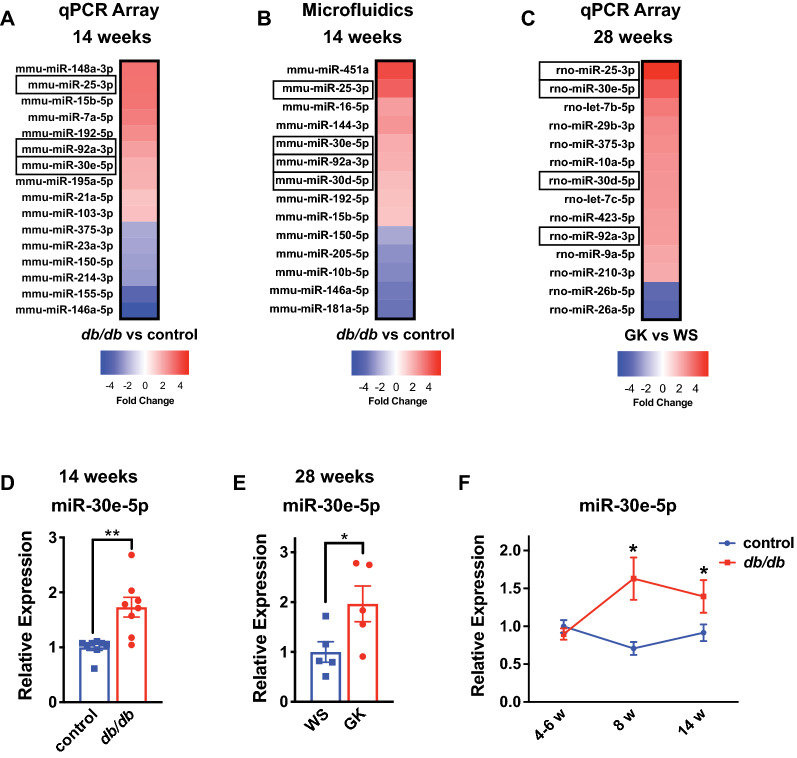
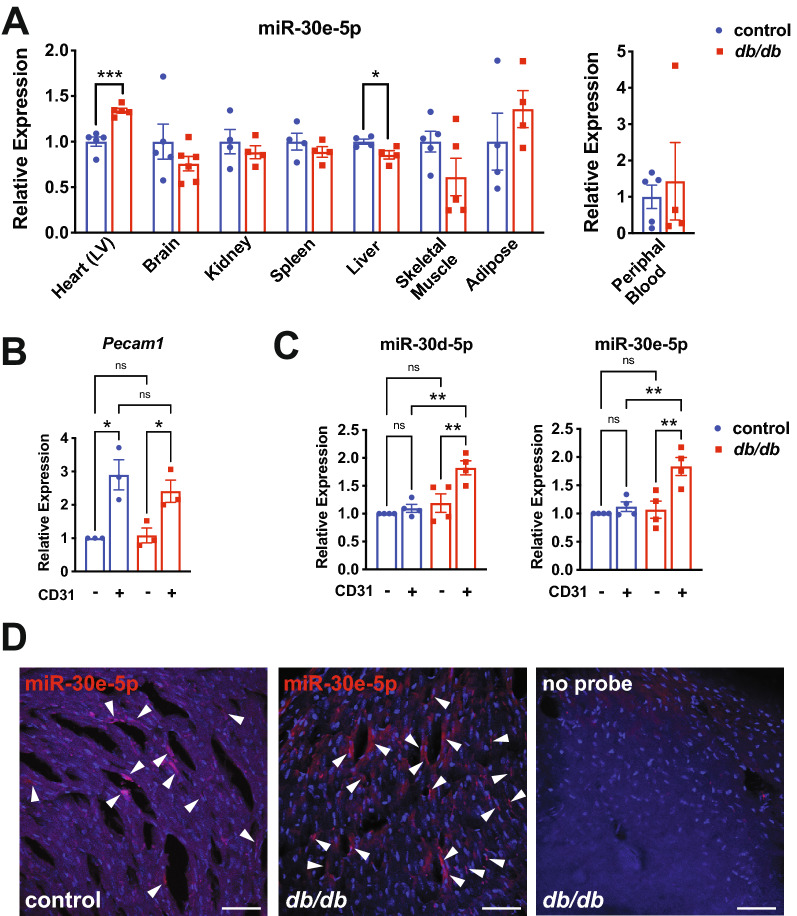
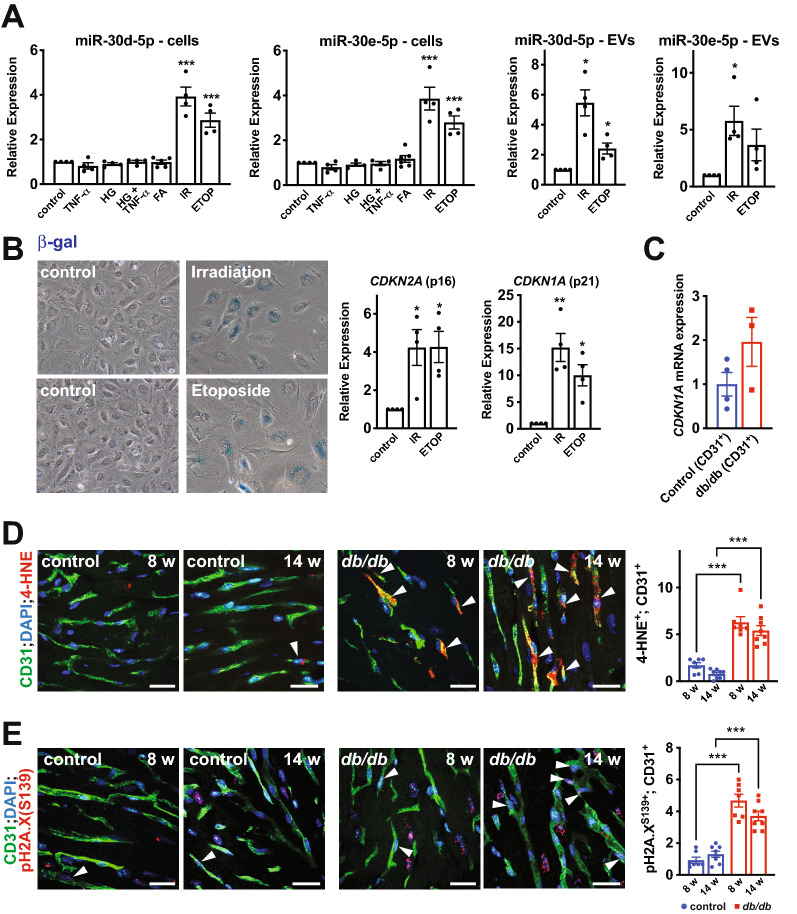
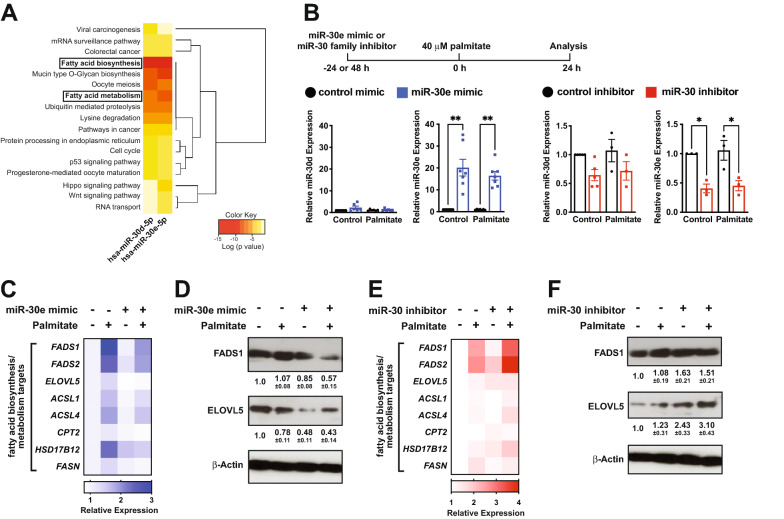
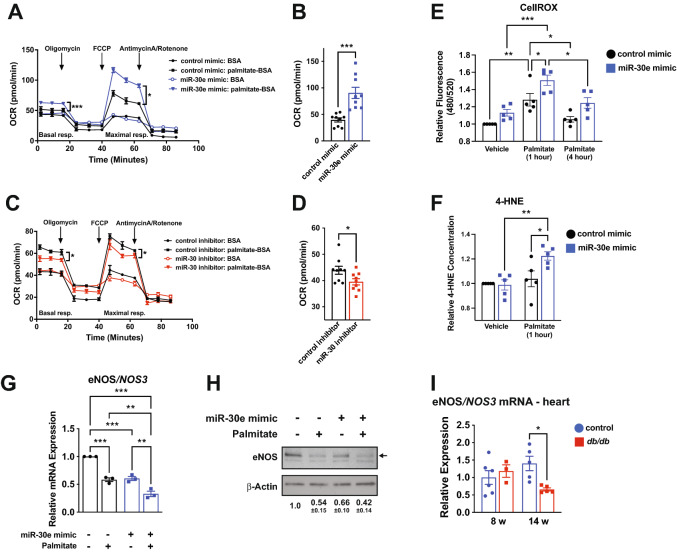
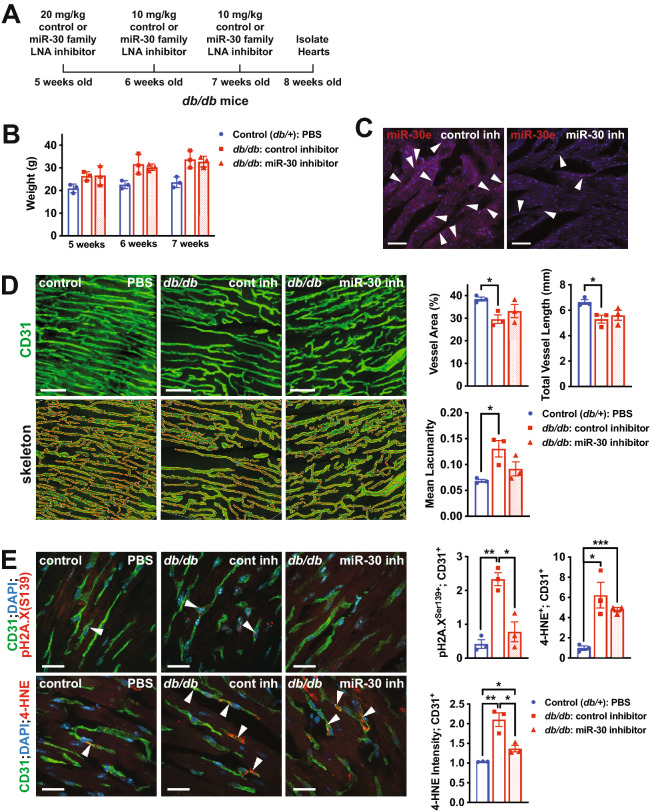
Results: We found an increase in miR-30d-5p and miR-30e-5p in circulating EVs that coincided with indices of coronary microvascular EC dysfunction (i.e., markers of oxidative stress, DNA damage/senescence) and rarefaction, and preceded echocardiographic evidence of diastolic dysfunction. These miRNAs may serve as biomarkers of coronary microvascular dysfunction as they are upregulated in ECs of the left ventricle of the heart, but not other organs, in db/db mice. Furthermore, the miR-30 family is secreted in EVs from senescent ECs in culture, and ECs with senescent-like characteristics are present in the db/db heart. Assessment of miR-30 target pathways revealed a network of genes involved in fatty acid biosynthesis and metabolism. Over-expression of miR-30e in cultured ECs increased fatty acid β-oxidation and the production of reactive oxygen species and lipid peroxidation, while inhibiting the miR-30 family decreased fatty acid β-oxidation. Additionally, miR-30e over-expression synergized with fatty acid exposure to down-regulate the expression of eNOS, a key regulator of microvascular and cardiomyocyte function. Finally, knock-down of the miR-30 family in db/db mice decreased markers of oxidative stress and DNA damage/senescence in the microvascular endothelium.

Conclusions: MiR-30d/e represent early biomarkers and potential therapeutic targets that are indicative of the development of diastolic dysfunction and may reflect altered EC fatty acid metabolism and microvascular dysfunction in the diabetic heart.

Keywords: Biomarker; Diabetes; Diastolic dysfunction; Endothelial cell; Extracellular vesicle; Heart failure with preserved ejection fraction; Microvasculature; microRNA.


Conflict of interest statement

The authors declare that they have no competing interests.

Figures

Fig. 1
Fig. 1
Diabetic mice develop diastolic dysfunction accompanied by microvascular rarefaction in the left ventricle. A Fasting blood glucose levels and body weight in db/db mice and db/ + controls at 6, 10 and 14 weeks of age. n = 4–5 mice per group. ** and *** indicate p < 0.01 and p < 0.001, respectively, for db/db vs. db/ + controls at the specified timepoint using an unpaired t-test. B Longitudinal and radial strain analysis at 8 and 14 weeks in db/db mice and db/ + controls. * and ** indicate p < 0.05 and p < 0.01, respectively for db/db vs. db/ + controls at the specified timepoint using an unpaired t-test. C Pressure–Volume (PV) loop analysis at 14 weeks in db/db mice and db/ + controls, depicting the dP/dt maximum (dP/dt +) and minimum (dP/dt-) values. * indicates p < 0.05 for db/db vs. db/ + using an unpaired t-test. D Tau measurements, indicative of the exponential decay of the ventricular pressure during isovolumetric relaxation, from PV loop analysis at 14 weeks in db/db mice and db/ + controls. * indicates p < 0.05 for db/db vs. db/ + using an unpaired t-test. E 2-photon confocal microscopy of cardiac microvasculature in the left ventricle as assessed by CD31 immunofluorescence at 4, 8 and 14 weeks in db/db mice and db/ + controls. The top images are CD31 immunofluorescence and the bottom are the skeleton outlines of the microvasculature. Representative images are shown. Scale bar = 45 μm. F Quantification of microvascular density, as assessed by measurement of microvascular area, total vessel length, and mean lacunarity in 4-, 8- and 14-week db/db and db/ + control mice. Each data point represents the mean of multiple fields of view from one mouse. *, ** and *** indicate p < 0.05, p < 0.01 and p < 0.001, respectively for the specified comparisons using ANOVA with Holm-Sidak multiple comparisons test. NS = not significant. All data in the figure depict mean ± SEM
Fig. 2
Fig. 2
Circulating extracellular vesicles are increased in size and concentration in T2D mice. A Nanoparticle tracking analysis (NTA) of EV concentration binned by size from samples isolated from an equal volume of plasma from db/db and db/ + controls at 8 and 14 weeks. n = 4–5 samples per group. B Quantification of EV concentration across all size bins and mode particle size in 8- and 14-week db/db and db/ + control mice. *, ** and *** indicate p < 0.05, p < 0.01 and p < 0.001, respectively, for db/db vs. db/ + at the specified timepoint using an unpaired t-test. C Western blotting of EV markers (CD63, CD81 and TSG101) and a non-EV marker (Calnexin) in EV samples and a total plasma control from 3 db/db and 3 db/ + control mice at 14 weeks. The position of molecular weight markers is indicated to the left and arrows to the right indicate the correct band. D Cryo-transmission scanning electron microscopy of EV samples from db/db and db/ + controls at 14 weeks. A representative image is shown. Arrows indicate examples of EV structures. Scale bar = 200 nm. All data in the figure depict mean ± SEM
Fig. 3
Fig. 3
Extracellular vesicle miRNAs are differentially abundant in T2D models. A Heat map of differentially abundant miRNAs (unpaired t-test) in EVs isolated from db/db mice and db/ + controls at 14 weeks using a qRT-PCR array. n = 4. B Heat map of differentially abundant miRNAs (unpaired t-test) in EVs isolated from db/db mice and db/ + controls at 14 weeks using a microfluidics platform. n = 4. C Heat map of differentially abundant miRNAs in EVs isolated from Goto-Kakizaki (GK) rats and Wistar (WS) controls at 28 weeks using a qRT-PCR array. n = 3. In panels A-C, miR-25-3p, miR-30d-5p, miR-30e-5p, miR-92a-3p are highlighted, as these were common among platforms and between mouse and rat models of T2D. D qRT-PCR validation of miR-30e-5p expression in EVs isolated from db/db mice and db/ + controls at 14 weeks. Data is relative to the mean of the control group. ** indicates p < 0.01 for db/db vs. db/ + using an unpaired t-test. E qRT-PCR validation of miR-30e-5p expression in EVs isolated from GK rats and WS controls at 28 weeks. Data is relative to the mean of the WS control. * indicates p < 0.05 for GK vs. WS using an unpaired t-test. F Time-course analysis of miR-30e-5p expression in db/db mice and db/ + controls at 4–6, 8 and 14 weeks. Data is relative to the mean of the control 4–6 week time-point group. n = 4–5 mice per time-point and genotype. * indicates p < 0.05 for db/db vs. db/ + at the specified timepoint using an unpaired t-test. See Additional File 1: Fig. S4 for individual data points for the heat maps in (A), (B) and (C). All data in the figure depict mean ± SEM
Fig. 4
Fig. 4
miR-30d-5p and miR-30e-5p are upregulated in the cardiac endothelium in T2D mice. A qRT-PCR of miR-30e-5p in the specified tissues and peripheral blood mononuclear cells in db/db mice and db/ + controls at 14 weeks of age. Data is relative to the mean of the control group for each tissue sample. * and *** indicate p < 0.05 and p < 0.001, respectively, for db/db vs. db/ + in the specified tissue using an unpaired t-test. B Confirmation of EC enrichment of CD31+ cells isolated from the heart in db/db and db/ + controls at 14 weeks of age by qRT-PCR of Pecam1 mRNA. Data is relative to the mean of the CD31 control group. * indicates p < 0.05 for the specified comparisons using ANOVA with Holm-Sidak multiple comparisons test. NS = not significant. C miR-30d-5p and miR-30e-5p are specifically upregulated in the CD31+ endothelium of the heart of db/db mice at 14 weeks of age compared to db/ + controls. Data is relative to the mean of the CD31 control group. ** indicates p < 0.01 for the specified comparisons using ANOVA with Holm-Sidak multiple comparisons test. NS = not significant. D Confocal imaging of miRNAscope with a miR-30e-5p probe in left ventricles of db/db and control db/ + mice at 14 weeks. A ‘no probe’ control is shown to the right. Arrows indicate regions of expression that are presumed to be endothelial based on cell morphology and anatomy. Representative images are shown. Scale bar = 50 μm. All data in the figure depict mean ± SEM
Fig. 5
Fig. 5
Senescence pathways induce miR-30d/e expression and secretion from ECs. A Left; qRT-PCR of miR-30d and miR-30e in cultured human umbilical vein ECs (HUVECs) exposed to diabetic stimuli (i.e. TNFα (10 ng/mL), high glucose [HG] (20 mM), TNFα + high glucose or the fatty acid, palmitate [FA] (40 μM)) or senescence-inducing stimuli (i.e. irradiation [IR] or etoposide [ETOP]). *** indicates p < 0.001 for the specified stimulus vs. vehicle control using ANOVA with Holm-Sidak multiple comparisons test. Right; secretion of miR-30d or miR-30e as assessed by qRT-PCR of EVs secreted by HUVECs exposed to senescence-inducing stimuli. * indicates p < 0.05 for the specified stimulus vs. vehicle control using ANOVA with Holm-Sidak multiple comparisons test. Data is relative to the control for each independent experiment. B Representative staining for senescence-associated β-gal activity and qRT-PCR for CDKN2A (p16) and CDKN1A (p21) expression in HUVECs exposed to irradiation [IR] or treated with etoposide [ETOP]. Data is relative to the control for each independent experiment. C qRT-PCR of CDKN1A (p21) expression in CD31+ cells isolated from db/db and db/ + control hearts at 14 weeks of age. Representative images of immunofluorescent staining for 4-HNE and CD31 (D) and pH2A.X (S139) and CD31 (E) in the left ventricle of 8- and 14-week db/db mice and db/ + controls. Scale bar = 22 μm. Arrowheads indicate examples of 4-HNE+ or pH2A.X+ ECs. Quantification of 4-HNE+;CD31+ double-positive ECs and pH2A.X+;CD31+ double-positive ECs per field of view is shown to the right. Each data point represents the mean of multiple fields of view from one mouse. *** indicates p < 0.001 for the specified comparison using ANOVA with Holm-Sidak multiple comparisons test. All data in the figure depict mean ± SEM
Fig. 6
Fig. 6
miR-30 regulates a network of genes that are involved in fatty acid biosynthesis and metabolism pathways. A KEGG Pathway analysis (DIANA-miRPath v3.0 with Tarbase v7.0) of human miR-30d-5p and miR-30e-5p target genes reveals a significant enrichment in fatty acid biosynthesis and fatty acid metabolism genes. Pathway analysis in mouse is shown in Additional File 1: Fig. S7. B Top; schematic of experimental approach to assess the function of miR-30 in cultured ECs. Bottom; qRT-PCR of miR-30d and miR-30e in cells transfected with miR-30e mimic (left) or a miR-30 family LNA inhibitor (right) compared to their respective controls. Data is relative to the unstimulated control for each independent experiment. * and ** indicate p < 0.05 and p < 0.01, respectively, for the specified comparison using ANOVA with Holm-Sidak multiple comparisons test. C Heat map of changes in gene expression of putative miR-30 target genes in fatty acid biosynthesis/metabolism pathways by qRT-PCR in ECs over-expressing miR-30e under control or palmitate-stimulated conditions. The mean of multiple independent experiments is indicated. D Representative western blots of FADS1, ELOVL5 and β-actin loading control in ECs over-expressing miR-30e with or without palmitate treatment. Densitometry is included below from n = 3 independent experiments (mean ± SEM). E Heat map of changes in gene expression of putative miR-30 target genes by qRT-PCR in ECs transfected with miR-30 family LNA inhibitor under control or palmitate-stimulated conditions. The mean of multiple independent experiments is indicated. F Representative western blots of FADS1, ELOVL5 and β-actin loading control in ECs transfected with miR-30 family inhibitor. Densitometry is included below from n = 3 independent experiments (mean ± SEM). See Additional File 1: Fig. S8 for individual data points and statistical analysis of data presented as heatmaps in (C) and (E). All data in the figure depict mean ± SEM
Fig. 7
Fig. 7
miR-30 enhances exogenous fatty acid β-oxidation and promotes oxidative stress and EC dysfunction. A Representative Seahorse tracing of oxygen consumption rate (OCR) in control and miR-30e over-expressing ECs. Basal and maximal respiration of exogenous, but not endogenous FA, was enhanced in miR-30e over-expressing cells. Error bars depict 2–3 technical replicates from a representative experiment. * and *** indicate p < 0.05 and p < 0.001, respectively, for the specified comparison using ANOVA with Holm-Sidak multiple comparisons test. Technical replicates were averaged and the value at each timepoint for basal and maximal respiration was used for paired statistical analyses (n = 3). B Quantification of exogenous FA oxidation (maximum OCR after FCCP injection minus minimum OCR after AntA/rotenone) in ECs over-expressing miR-30e. n = 3 independent experiments with 3 technical replicates. *** indicates p < 0.001 for miR-30e mimic vs. control mimic using an unpaired t-test. C Representative Seahorse tracing of OCR in control and miR-30 knock-down ECs. Basal and maximal respiration of exogenous FA was reduced by miR-30 knock-down. Error bars depict 2–3 technical replicates from a representative experiment. * indicates p < 0.05 for the specified comparisons using ANOVA with Holm-Sidak multiple comparisons test. Technical replicates were averaged and the value at each timepoint for basal and maximal respiration was used for paired statistical analyses (n = 3). D Quantification of exogenous FA oxidation in ECs with miR-30 knock-down. n = 3 independent experiments with 3 technical replicates. * indicates p < 0.05 for miR-30 inhibitor vs. control inhibitor using an unpaired t-test. E Measurement of reactive oxygen species (ROS) in ECs transfected with control or miR-30e mimic exposed to palmitate. Basal and palmitate-induced ROS production was increased in miR-30e over-expressing cells. Data is relative to the unstimulated control for each independent experiment. *, ** and *** indicate p < 0.05, p < 0.01 and p < 0.001, respectively, for the specified comparisons using ANOVA with Holm-Sidak multiple comparisons test. NS = not significant. F 4-HNE measurements in vehicle or palmitate stimulated ECs transfected with control or miR-30e mimic. Data is relative to the unstimulated control for each independent experiment. * and ** indicate p < 0.05 and p < 0.01, respectively for the specified comparisons using ANOVA with Holm-Sidak multiple comparisons test. G qRT-PCR measurement of eNOS/NOS3 mRNA in cultured ECs transfected with control or miR-30e mimic in the presence or absence of palmitate. Data is relative to the unstimulated control for each independent experiment. ** and *** indicate p < 0.01 and p < 0.001, respectively, for the specified comparisons using ANOVA with Holm-Sidak multiple comparisons test. H Representative western blot demonstrating a reduction in eNOS protein in ECs over-expressing miR-30e and exposed to palmitate. Densitometry is included below from n = 5 independent experiments (mean ± SEM). I qRT-PCR measurement of eNOS/NOS3 mRNA in the left ventricle of db/db mice and db/ + controls at 8 and 14 weeks of age. Data is relative to the mean of control samples at 8 weeks of age. * indicates p < 0.05 for the specified comparison using ANOVA with Holm-Sidak multiple comparisons test. All data in the figure depict mean ± SEM
Fig. 8
Fig. 8
Inhibition of miR-30 decreases oxidative stress and DNA damage in microvascular endothelial cells in db/db mice. A Schematic of experimental set-up. Control or miR-30 family LNA inhibitor was injected intradermally in db/db mice at 5, 6 and 7 weeks of age and hearts were harvested at 8 weeks of age. Control (db/ +) mice were injected with PBS at the same time-points. B Weights were measured at the time of injections, revealing normal weight gain in db/db mice injected with miR-30 inhibitor. C Confocal imaging of miRNAscope of miR-30e in left ventricles from db/db mice injected with control or miR-30 family LNA inhibitor. Arrowheads indicate expression in cells that are presumed to be endothelial cells based on morphology and anatomy. Representative images are shown. Scale bar = 50 μm. D 2-photon confocal microscopy of cardiac microvasculature in the left ventricle as assessed by CD31 immunofluorescence at 8 weeks of age in db/db mice (injected with control or miR-30 family LNA inhibitor) (right panels) and controls (db/ +) (left panel). The top images are CD31 immunofluorescence and the bottom are the skeleton outlines of the microvasculature. Representative images are shown. Scale bar = 45 μm. Quantification of microvascular density, as assessed by measurement of microvascular area, total vessel length, and mean lacunarity (right). Each data point represents the mean of multiple fields of view from one mouse. * indicates p < 0.05 for the specified comparisons. E Representative images of immunofluorescent staining for pH2A.X (S139) and CD31 (top) and 4-HNE and CD31 (bottom) in the left ventricle in db/db mice (injected with control or miR-30 family LNA inhibitor) (right panels) and controls (db/ +) (left panel) at 8 weeks of age. Scale bar = 22 μm. Arrowheads indicate examples of 4-HNE+ or pH2A.X+ ECs. Quantification of pH2A.X+;CD31+ double-positive ECs, 4-HNE+;CD31+ double-positive ECs and 4-HNE intensity in ECs is shown to the right. Each data point represents the mean of multiple fields of view from one mouse. *, ** and *** indicates p < 0.05, p < 0.01 or p < 0.001, respectively for the specified comparisons. All data in the figure depict mean ± SEM
Fig. 9
Fig. 9
Schematic of the role of miR-30d/e in microvascular dysfunction in diabetes. Type 2 Diabetes (T2D) promotes microvascular dysfunction in the heart. In a mouse db/db model of T2D, microvascular rarefaction precedes echocardiographic evidence of diastolic dysfunction. The up-regulation of miR-30d/e in the endothelium of the heart is associated with induction of senescence-like pathways. MiR-30d/e can be secreted by the endothelium in extracellular vesicles (EVs) and detected in the circulation, and may serve as an early circulating biomarker of microvascular dysfunction. In the endothelium, miR-30d/e target a number of genes involved in fatty acid biosynthesis and in turn enhance β-oxidation of exogenous fatty acids. Over-expression of miR-30e results in oxidative stress, DNA damage and decreased levels of eNOS, which may contribute to microvascular dysfunction and rarefaction, ultimately contributing to diastolic dysfunction. The schematic was generated using Biorender

References

    1. Defronzo RA. Banting lecture. From the triumvirate to the ominous octet: a new paradigm for the treatment of type 2 diabetes mellitus. Diabetes. 2009;58(4):773–95. - PMC - PubMed
    1. Kannel WB, Hjortland M, Castelli WP. Role of diabetes in congestive heart failure: the Framingham study. Am J Cardiol. 1974;34(1):29–34. - PubMed
    1. Kannel WB, McGee DL. Diabetes and cardiovascular disease: the Framingham study. JAMA. 1979;241(19):2035–2038. - PubMed
    1. Greenberg BH, Abraham WT, Albert NM, Chiswell K, Clare R, Stough WG, et al. Influence of diabetes on characteristics and outcomes in patients hospitalized with heart failure: a report from the Organized Program to Initiate Lifesaving Treatment in Hospitalized Patients with Heart Failure (OPTIMIZE-HF) Am Heart J. 2007;154(2):277.e1–8. - PubMed
    1. Bouthoorn S, Valstar GB, Gohar A, den Ruijter HM, Reitsma HB, Hoes AW, et al. The prevalence of left ventricular diastolic dysfunction and heart failure with preserved ejection fraction in men and women with type 2 diabetes: a systematic review and meta-analysis. Diabetes Vasc Dis Res. 2018;15(6):477–493. - PMC - PubMed

Publication types