. 2022 Mar 15;9(2):ENEURO.0528-21.2022.
doi: 10.1523/ENEURO.0528-21.2022. Print 2022 Mar-Apr.

Partial Ablation of Postsynaptic Dopamine D2 Receptors in the Central Nucleus of the Amygdala Increases Risk Avoidance in Exploratory Tasks

Affiliations

Partial Ablation of Postsynaptic Dopamine D2 Receptors in the Central Nucleus of the Amygdala Increases Risk Avoidance in Exploratory Tasks

Eric Casey et al. eNeuro. .

Abstract

The central nucleus of the amygdala (CeA) is involved in the expression of fear and has been implicated in several anxiety disorders. This structure is densely innervated by DAergic projections that impinge on amygdalar neurons expressing various dopamine (DA) receptor subtypes, including D2 receptors (D2Rs). Although various pharmacological approaches have assessed the role of D2Rs in the CeA, the actual participation of postsynaptic D2Rs in the CeA to defensive behaviors remains unclear. Here, we investigated the distribution of D2Rs in the CeA and their role in modifying neuronal activity and fear related behaviors in mice. First, using the mouse reporter strain D2R-EGFP, we verified that D2Rs are present both in neurons of the CeA and in A10 dorsocaudal (A10dc) DAergic neurons that innervate the CeA. Moreover, we showed that pharmacological stimulation of D2Rs increases the activity of protein kinase C (PKC)δ cells present in the CeA, a type of neuron previously associated with reduced defensive behaviors. Finally, using a molecular genetics approach that discriminates postsynaptic D2Rs from presynaptic D2 autoreceptors, we demonstrated that mice carrying targeted deletions of postsynaptic D2Rs in the CeA display increased risk avoidance in exploratory tasks. Together, our results indicate that postsynaptic D2Rs in the CeA attenuate behavioral reactions to potential environmental threats.


Figures

Figure 1.
Figure 1.
Postsynaptic and presynaptic distribution of D2R-expressing neurons. A, Representative confocal microscopy of coronal sections at two anteroposterior levels of the CeA of a Drd2-EGFP mouse. Magnifications of boxed areas are shown in the left bottom corners. B, Representative histology of D2R-expressing neurons (green, left) in CeA coronal sections of Drd2-EGFP.Dat+/IRES-Cre.Ai14 triple transgenic mice. DAergic fibers (reported by Cre-induced tdTomato, in red) and their overlap with D2R-expressing neurons is shown at the center and right, respectively. C, D, Analysis of Drd2 expression in DAergic neurons of the PAG/DR. C, Representative confocal microscopy of TH immunofluorescence on a PAG/DR coronal section of a Drd2-EGFP mouse. Magnifications of boxed areas are shown. D, Percentage of D2R+ and D2R– neurons from total TH+ neurons in the vPAG/DR (mean ± SEM, n = 3 mice). CeL, CeA, lateral part; CeM, CeA, medial part; AP, antero-posterior. Scale bars: 200 μm.
Figure 2.
Figure 2.
D2R stimulation activates CeA PKCδ neurons. A, Representative histology of PKCδ (green, top) and c-FOS (red, center) double immunofluorescence in coronal sections of the CeA of WT mice receiving vehicle, cocaine (20 mg/kg, i.p.) or quinpirole (1 mg/kg, i.p.). Insets are magnifications of the boxed areas. B, Quantification of c-FOS activation induced by cocaine; lines connect data from the same mouse. Two-way GLMM with negative binomial family (link: log); likelihood-ratio test: type of neuron, x2(1) = 66.1, p < 0.0001; drug, x2(1) = 15.4, p < 0.0001; drug × type of neuron, x2(1) = 3.5, p = 0.06; vehicle, n = 9; cocaine, n = 7; post hoc Tuckey’s test shown. C, Quantification of c-FOS activation induced by quinpirole; lines connect data from the same mouse. Two-way GLMM with Poisson family (link: log); likelihood-ratio test: drug × type of neuron, x2(1) = 9.3, p = 0.03; vehicle, n = 4; quinpirole, n = 4; post hoc Tuckey’s test shown. D, Representative double immunofluorescence for c-FOS (cyan) and TH (red) in the CeA and (E) quantification of c-FOS expression in the CeA induced by saline (Veh) or quinpirole (Quin; 1 mg/kg, i.p.) given to wild-type (wt) or Drd2KO (KO) mice. Two-way GLMM with negative binomial family (link: log); likelihood-ratio test: drug × genotype, x2(1) < 8.1, p < 0.01; post hoc Tuckey’s test shown. Veh: WT, n = 5; KO, n = 3; Quin: WT, n = 5; KO, n = 3. CeL, CeA, lateral part; CeM, CeA, medial part. Scale bars: 100 μm. ***p < 0.001, **p < 0.01, n.s. p > 0.05.
Figure 3.
Figure 3.
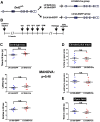
Strategy for selective genetic ablation of D2Rs in the CeA. A, Schematic of the lentiviral vectors used to express Cre driven by the GAD67 promoter and EGFP driven by the ubiquitin promoter. B, Schematic of lentiviral vectors bilateral injections. C, Strategy for generating CeADrd2KO and control mice. D, Experimental timeline. OF, exploratory activity in an open field; EPM, elevated plus maze; DLBT, dark/light box test; FC, fear conditioning. Each vertical bar indicates 1 day. E, Representative histology of a coronal section showing co-injections of LV:GAD-Cre and LV:Ub-EGFP into the CeA. F, LV:GAD-Cre-induced recombination in Drd2loxP/loxP mice was verified by PCR with primers detecting deleted (Drd2), floxed (Drd2loxP), and wild-type (Drd2+) alleles from biopsies containing the CeA or thalamus, as negative control, of CeADrd2KO (n = 4) and control (n = 4) mice. Result of a mouse per group are shown, followed by a negative control (water) and two positive controls. G, Representative histology of a coronal brain section of a Drd2-EGFP.Ai14 double transgenic mouse receiving a stereotaxic injection of LV:GAD-Cre into the CeA. D2R+ (green), Cre-induced tomato (red).
Figure 4.
Figure 4.
D2R ablation from the CeA increases avoidance in exploratory tasks. The result of a MANOVA including every measure is shown at the center, right. A, Dark/light box. Left, Time spent in the lit chamber. Student’s t test, t(15) =3.4; p = 0.004. Middle, Latency to first entry into lit chamber in a dark/light box test. Student’s t test; t(15) = −2.3; p = 0.034. Right, Number of entries into the lit chamber in a dark/light box test. GLM with Poisson family (link: log); Wald test, z = −1.7, p = 0.092. B, EPM. Top, Percentage of time on open arms. Only in this measure, the cohort of mice had a significant effect. Therefore, the percentage of time on open arms was analyzed in two different ways (see the Materials and Methods, EPM). Top-left, Percentage of time in open arms, two-way (group × cohort) ANOVA with variance modeling (“VarIdent” function, applied to cohort factor), group, F(1,13) = 8.9, p = 0.011; Cohort, F(1,13) = 19.9, p < 0.001; group × cohort, F(1,13) = 0.16, p = 0.69. Top-right, Percentage of time in open arms normalized to the cohort average. Student’s t test; t(15) = 2.1; p = 0.049). Bottom, Percentage of entries to open arms over total entries (open+closed). Since statistical differences between cohorts were not detected, normalization to cohort averages was not performed. Bottom-left, Percentage of entries to open arms over entries to open and closed arms in an EPM, with data separated according to the cohort. Two-way GLMM with quasi-binomial family (link: logit); Wald test; group, t = −0.31, p = 0.76; cohort, t = 1.86, p = 0.09; group × cohort, t = 0.1, p 0.92. Bottom-right, Percentage of entries to open arms, with data of both cohorts pulled. GLMM with quasi-binomial family (link: logit); Wald test, t = −0.37, p = 0.72. C, Open field, Time in center of the arena during the first 5 min of exposure. Student’s t test, t(15) = 0.35, p = 0.73. CeADrd2KO, n = 9; Ctrl, n = 8 in all experiments. ***p < 0.001, **p < 0.01, *p < 0.05, n.s. p > 0.05.
Figure 5.
Figure 5.
D2R ablation from the CeA does not affect locomotion. Daily distance traveled by CeADrd2KO and control mice during 30-min sessions of open field exploration; two-way ANOVA with repeated measures; group, F(1,45) = 0.001, p > 0.1; days, F(2,45) = 76.3, p < 0.001; group × days, F(2,45) = 2, p > 0.1. CeADrd2KO, n = 9 and Ctrl, n = 8. n.s., p > 0.05.
Figure 6.
Figure 6.
LV:GAD-Cre injections into the CeA of Drd2+/+ mice does not alter behaviors in exploratory tasks. A, Experimental design with viral injections. B, Experimental timeline. OF, exploratory activity in an open field; EPM, elevated plus maze; DLBT, dark/light ox test. Each vertical bar indicates 1 day. C–E, Avoidance behavior in exploratory tasks. The result of a MANOVA including every measure is shown in the center. C, Dark/light box. Top, Time in the lit chamber. Student’s t test, t(12) = 1.3; p = 0.22. Middle, Latency to first entry to light chamber; Student’s t test; t(12) = 1.1, p = 0.29. Bottom, Number of entries to light chamber; GLM with quasi-Poisson family (link: log); Wald test, z = 1.51, p = 0.16. D, EPM. Top, Percentage of time on the open arms over the time on open and closed arms; Student’s t test; t(12) = 0.21; p = 0.83. Bottom, Percentage of entries to open arms over total. GLMM with quasi-binomial family (link: logit); Wald test, z = −0.49, p = 0.64. E, Open field, Time in center of the arena during the first 5 min of exposure; Student’s t test, t(12) = 1.1, p = 0.29. LV:GAD-Cre, n = 7; LV:Ub-EGFP, n = 7 in all the experiments. **p < 0.01, *p < 0.05, n.s. p > 0.05.
Figure 7.
Figure 7.
Mice lacking D2R in the CeA express unaltered fear-conditioning memory. A, Contextual FC training protocol. B, Percentage of freezing during the first 2 min of chamber habituation during the training [pre-test, GLM with quasi-binomial family (link: log); Wald test, z = 1.23, p = 0.23]. C, Percentage of freezing after each foot shock [training session, GLMM with quasi-binomial family (link: log); LRT test; group × shock, X2(1) = 2.8, p = 0.24; group, X2(1) = 0.2, p = 0.65; shock, X2(1) = 21.7, p < 0.001]. D, Percentage of freezing during re-exposition to the conditioning chamber, 24 h after the training [testing session, GLM with quasi-binomial family (link: log); Wald test, z = 0.15, p = 0.88]. Result of MANOVA including all variables is shown. CeADrd2KO, n = 9 and Ctrl, n = 8, n.s. p > 0.05.

Similar articles

Cited by

References

    1. Bäckman CM, Malik N, Zhang Y, Shan L, Grinberg A, Hoffer BJ, Westphal H, Tomac AC (2006) Characterization of a mouse strain expressing Cre recombinase from the 3′ untranslated region of the dopamine transporter locus. Genesis 44:383–390. 10.1002/dvg.20228 - DOI - PubMed
    1. Bello EP, Mateo Y, Gelman DM, Noaín D, Shin JH, Low MJ, Alvarez VA, Lovinger DM, Rubinstein M (2011) Cocaine supersensitivity and enhanced motivation for reward in mice lacking dopamine D2 autoreceptors. Nat Neurosci 14:1033–1038. 10.1038/nn.2862 - DOI - PMC - PubMed
    1. Bull DR, Bakhtiar R, Sheehan MJ (1991) Characterization of dopamine autoreceptors in the amygdala: a fast cyclic voltammetric study in vitro. Neurosci Lett 134:41–44. 10.1016/0304-3940(91)90504-m - DOI - PubMed
    1. Cai H, Haubensak W, Anthony TE, Anderson DJ (2014) Central amygdala PKC-δ+ neurons mediate the influence of multiple anorexigenic signals. Nat Neurosci 17:1240–1211. 10.1038/nn.3767 - DOI - PMC - PubMed
    1. Ciocchi S, Herry C, Grenier F, Wolff SBE, Letzkus JJ, Vlachos I, Ehrlich I, Sprengel R, Deisseroth K, Stadler MB, Müller C, Lüthi A (2010) Encoding of conditioned fear in central amygdala inhibitory circuits. Nature 468:277–282. 10.1038/nature09559 - DOI - PubMed

Publication types

Substances

LinkOut - more resources