. 2022 Feb;10(2):e003816.
doi: 10.1136/jitc-2021-003816.

Targeting of the alphav beta3 integrin complex by CAR-T cells leads to rapid regression of diffuse intrinsic pontine glioma and glioblastoma

Affiliations

Targeting of the alphav beta3 integrin complex by CAR-T cells leads to rapid regression of diffuse intrinsic pontine glioma and glioblastoma

Dustin A Cobb et al. J Immunother Cancer. 2022 Feb.

Abstract

Background: Diffuse intrinsic pontine glioma (DIPG) and glioblastoma (GBM) are two highly aggressive and generally incurable gliomas with little therapeutic advancements made in the past several decades. Despite immense initial success of chimeric antigen receptor (CAR) T cells for the treatment of leukemia and lymphoma, significant headway into the application of CAR-T cells against solid tumors, including gliomas, is still forthcoming. The integrin complex alphav beta3vβ3) is present on multiple and diverse solid tumor types and tumor vasculature with limited expression throughout most normal tissues, qualifying it as an appealing target for CAR-T cell-mediated immunotherapy.

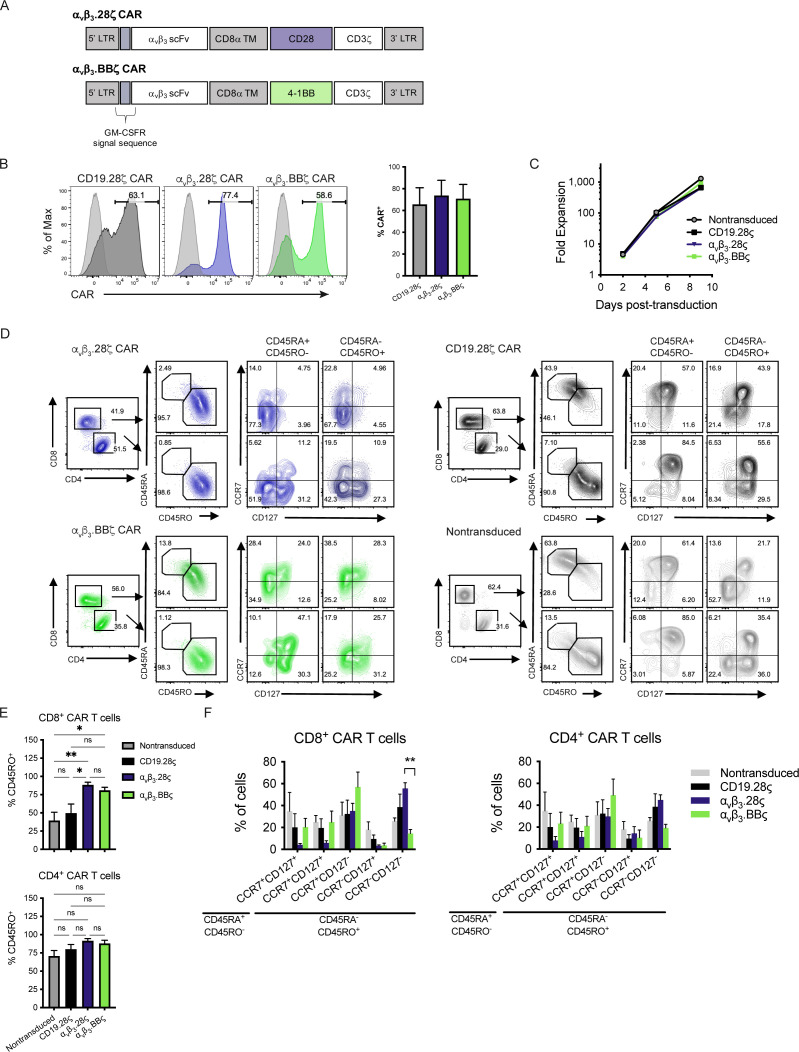
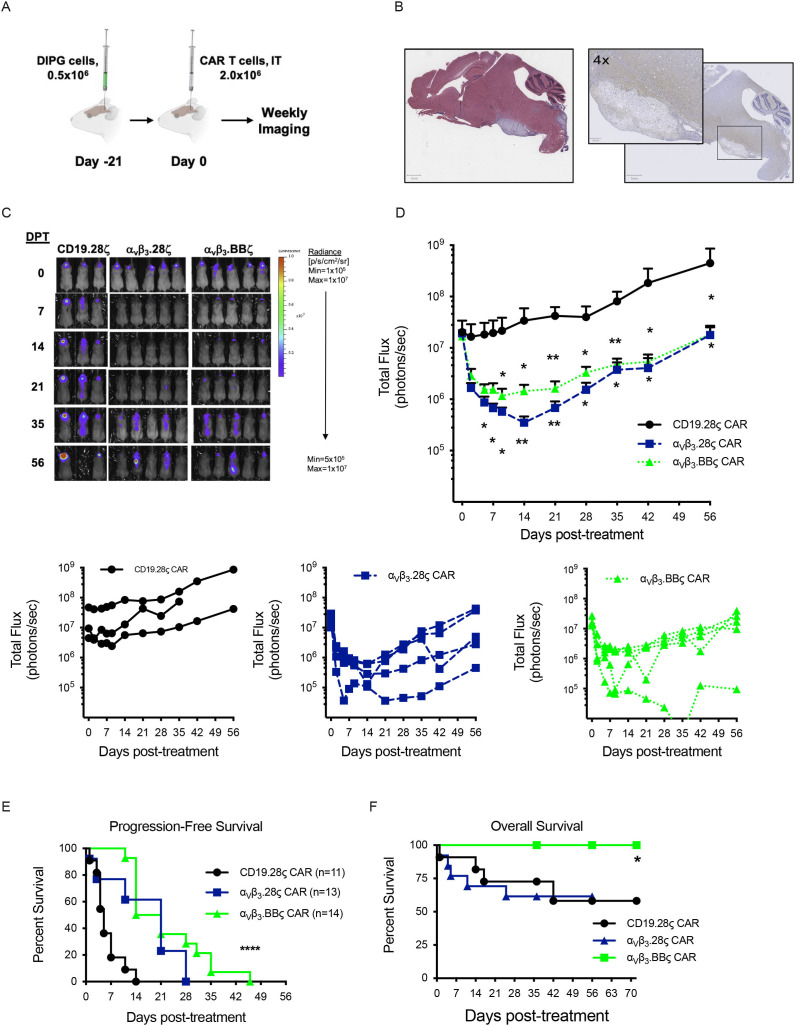
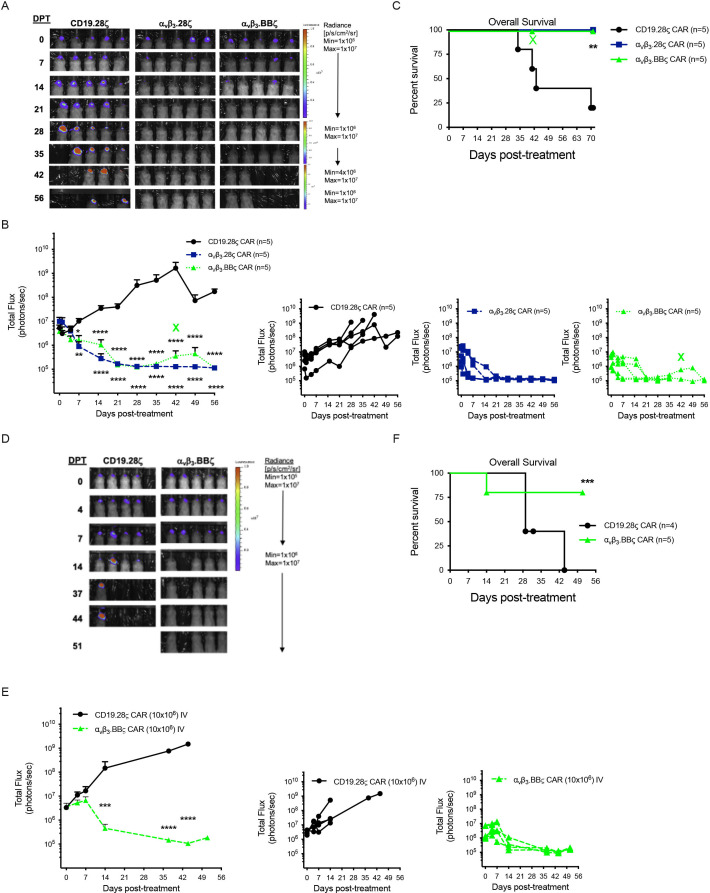
Methods: Patient-derived DIPG and GBM cell lines were evaluated by flow cytometry for surface expression of αvβ3. Second-generation CAR-T cells expressing an anti-αvβ3 single-chain variable fragment were generated by retroviral transduction containing either a CD28 or 4-1BB costimulatory domain and CD3zeta. CAR-T cells were evaluated by flow cytometry for CAR expression, memory phenotype distribution, and inhibitory receptor profile. DIPG and GBM cell lines were orthotopically implanted into NSG mice via stereotactic injection and monitored with bioluminescent imaging to evaluate αvβ3 CAR-T cell-mediated antitumor responses.

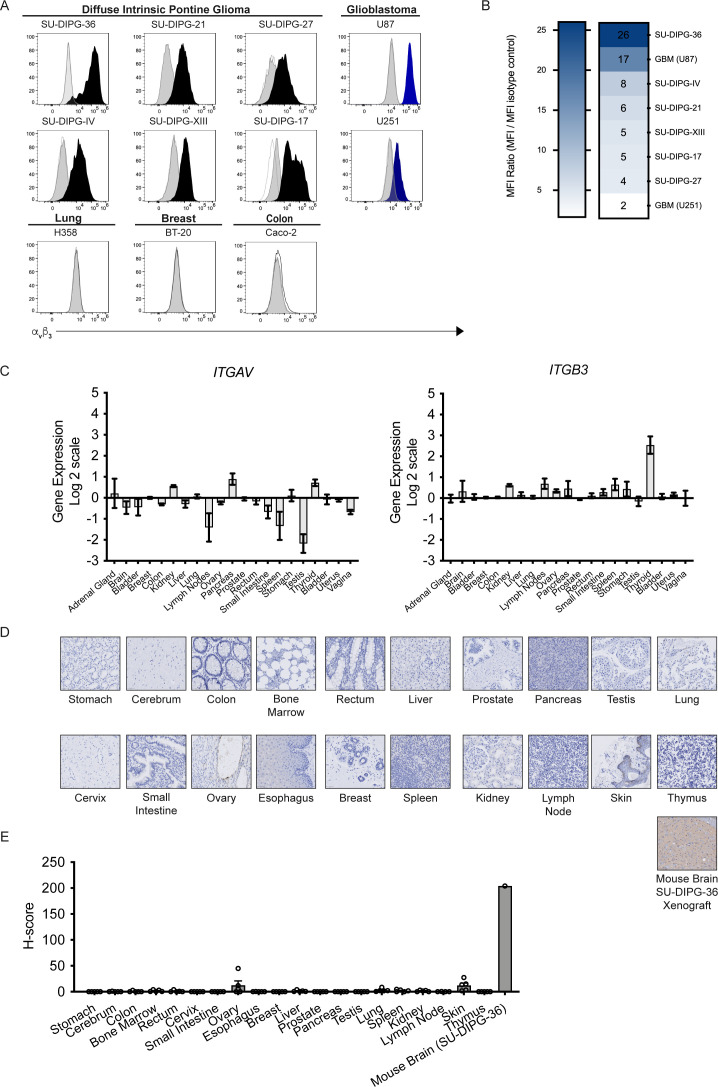
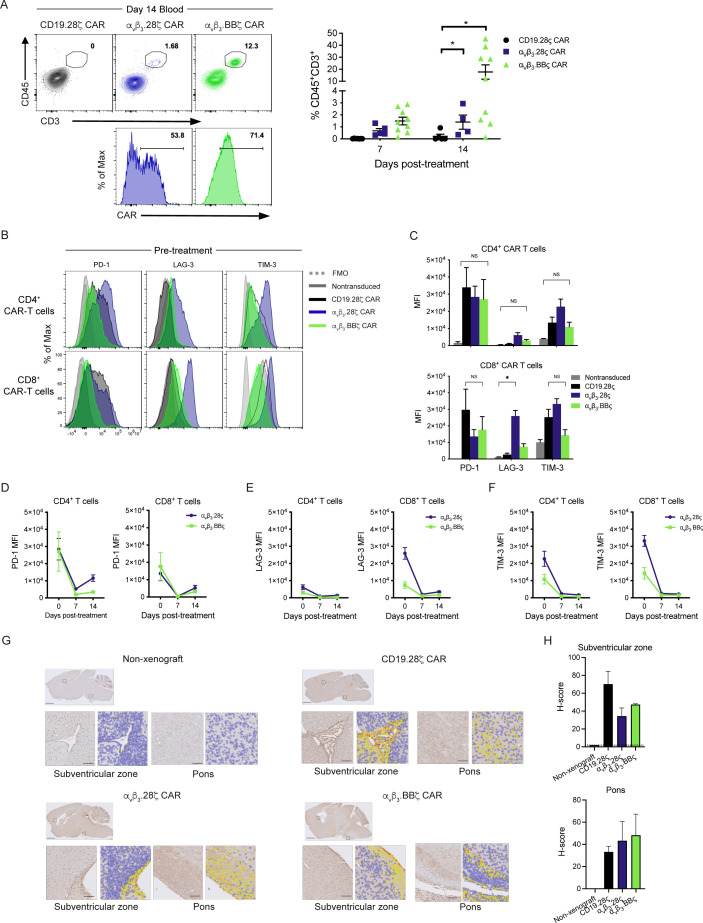
Results: We found that patient-derived DIPG cells and GBM cell lines express high levels of surface αvβ3 by flow cytometry, while αvβ3 is minimally expressed on normal tissues by RNA sequencing and protein microarray. The manufactured CAR-T cells consisted of a substantial frequency of favorable early memory cells and a low inhibitory receptor profile. αvβ3 CAR-T cells demonstrated efficient, antigen-specific tumor cell killing in both cytotoxicity assays and in in vivo models of orthotopically and stereotactically implanted DIPG and GBM tumors into relevant locations in the brain of NSG mice. Tumor responses were rapid and robust with systemic CAR-T cell proliferation and long-lived persistence associated with long-term survival. Following tumor clearance, TCF-1+αvβ3 CAR-T cells were detectable, underscoring their ability to persist and undergo self-renewal.

Conclusions: These results highlight the potential of αvβ3 CAR-T cells for immunotherapeutic treatment of aggressive brain tumors with reduced risk of on-target, off-tumor mediated toxicity due to the restricted nature of αvβ3 expression in normal tissues.

Keywords: T-lymphocytes; chimeric antigen; immunologic memory; immunotherapy; pediatrics; receptors.


Conflict of interest statement

Competing interests: DWL serves as a consultant to Juno Therapeutics/BMS, Harpoon Therapeutics, and Amgen, and his institution receives clinical trial funding from Kite Pharma/Gilead. His spouse is an employee of Karyopharm Therapeutics. DAC and DWL have a patent application pending based on the results presented in this study. All other authors declare that they have no competing interests.

Figures

Figure 1
Figure 1
The integrin complex αvβ3 is highly expressed on patient-derived DIPG cells and GBM tumor cell lines. (A) Representative histograms from flow cytometry analysis of DIPG, GBM, lung (H358), breast (BT-20), and colon (Caco-2) tumor cell lines surface stained with anti-αvβ3. Gray dotted line histograms indicate unstained tumor cells, gray-shaded histograms represent staining with an isotype control antibody, and solid color-filled histograms indicate tumor cells stained with anti-αvβ3 antibody (clone LM609). (B) Heat map summarizing the expression of αvβ3 across multiple DIPG and GBM tumor cell lines. The MFI ratio (MFI/MFI isotype control) for αvβ3 in each cell type was calculated and ranked from highest to lowest. (C) Gene expression for ITGAV and ITGB3 within normal human tissues obtained by accessing Affymetrix mRNA expression data within the expO Normal Tissue Expression microarray via the NIH Pediatric Oncology Branch Oncogenomics Database. (D) Immunohistochemical staining for αvβ3 expression was performed on a normal human TMA containing 20 different tissue types from five different donors and brain tissue from a mouse with a human DIPG xenograft (SU-DIPG-36). Shown are representative tissue cores from each tissue type. (E) αvβ3 normal tissue expression was quantified by H-score for each tissue type and is represented in the bar graph. Data are shown as mean±SEM. αvβ3, alphav beta3; DIPG, diffuse intrinsic pontine glioma; GBM, glioblastoma; TMA, tissue microarray.
Figure 2
Figure 2
Design, production, and immunophenotypic characterization of αvβ3 CAR-T cells following retroviral transduction and ex vivo expansion. (A) Schematic representation of the αvβ3 CAR constructs. The anti-αvβ3 scFv targeting domain derived from the monoclonal antibody LM609 is preceded by the signal peptide for granulocyte-macrophage colony stimulating factor receptor (GM-CSFR). Following the scFv is the CD8α transmembrane domain, either CD28 or 4-1BB intracellular signaling domain and CD3ζ. (B) Left: representative histograms of CAR surface expression gated on CD3+ T cells. CAR expression was detected with biotinylated protein L followed by streptavidin-PE and analyzed by flow cytometry. Numbers on histograms represent the percentage of CAR positive cells. Right: bar graph shows the mean transduction efficiency of CD3+ T cells on days 9–10 post-transduction from 11 independent CAR-T cell productions using PBMCs from three different normal donors. (C) Representative experiment showing fold expansion of CAR-T cells after retroviral transduction. (D) Flow cytometry gating strategy for identification and evaluation of memory cell differentiation including ‘TSCM-like’ memory (CD45RA+CD45RO+CCR7+CD127+), central memory (CD45RO+CCR7+CD127+), and effector memory populations (CD45RO+CCR7CD127). Shown are representative contour plots for αvβ3.28ζ CAR-T cells (top left/blue), αvβ3.BBζ CAR-T cells (bottom left/green), CD19.28ζ CAR-T cells (top right/black), and non-transduced T cells (bottom right/gray). (E) Percentage of CAR-T cells that are CD45RO+ in CD8+ and CD4+ T cell subsets. (F) Graphical representation of the frequencies of CD8+ and CD4+ memory T cell subsets following CAR-T cell expansion protocol. (D–F) Characterization of memory subsets were performed on CAR-T cells generated from three different normal donors and results shown are from four independent experiments. *P<0.05 and **p<0.01 were determined by one-way ANOVA (in E) or two-way ANOVA (in F). Data are shown as mean±SEM. αvβ3, alphav beta3; ANOVA, analysis of variance; CAR, chimeric antigen receptor; scFv, single-chain variable fragment
Figure 3
Figure 3
In vitro antitumor activity of αvβ3 CAR-T cells against DIPG and GBM. (A) In an 18-hour bioluminescence-based cytotoxicity assay, DIPG tumor cells were cocultured with non-transduced T cells, CD19.28ζ CAR, αvβ3.28ζ CAR, or αvβ3.BBζ CAR-T cells at E:T ratios ranging from 10:1 to 2.5:1. Bioluminescence of viable tumor cells (luciferase activity) was measured within 20 min following addition of D-luciferin. A representative image capturing bioluminescence is shown. Coculture groups were plated in triplicate wells. (B) Percent cytotoxicity of CAR-T cells against SU-DIPG-IV, SU-DIPG-XIII, SU-DIPG-36, and SU-DIPG-XVII. (C) Effector cytokine production by CAR-T cells was measured in DIPG tumor cell cocultures after 24 hours. Levels of IFN-γ (left), IL-2 (middle), and TNF-α (right) were measured by ELISA. Bar graphs represent the mean cytokine values from multiple donors in at least two to three independent experiments. (D) GBM tumor cells were cocultured with non-transduced T cells, CD19.28ζ CAR, αvβ3.28ζ CAR, or αvβ3.BBζ CAR-T cells at E:T ratios ranging from 10:1 to 2.5:1. (E) Percent cytotoxicity of CAR-T cells against GBM U87 and U251 cell lines. (F) Effector cytokine production by CAR-T cells was measured in GBM U87 tumor cell cocultures after 24 hours. Levels of IFN-γ (left), IL-2 (middle), and TNF-α (right) were measured by ELISA. Bar graphs represent the mean cytokine values from multiple donors in at least three to four independent experiments. (G) Percent cytotoxicity of CAR-T cells against αvβ3-negative tumor cell lines H358 and BT-20. (H) For blockade of αvβ3-specific cytotoxicity, U87 tumor cells were first incubated with LM609 antibody (10 µg/mL) for 3 hours, and then cocultured with non-transduced T cells, CD19.28ζ CAR, αvβ3.28ζ CAR, or αvβ3.BBζ CAR-T cells at an E:T ratio of 2.5:1 in triplicate wells for each group. Tumor cell bioluminescence was then measured following overnight incubation. Data in the bar graph show a representative experiment that was performed twice. (B and E) Experiments were performed at least three times. (C and F) Experiments for each tumor line were performed two to three times with CARs generated from different donors and data are shown as mean±SEM. (H) *P<0.05, **p<0.01, ****p<0.0001 were determined by one-way ANOVA. Data in bar graph are shown as mean±SD. ANOVA, analysis of variance; CARs, chimeric antigen receptors; DIPG, diffuse intrinsic pontine glioma; E:T, effector-to-target; GBM, glioblastoma.
Figure 4
Figure 4
CAR-T cells targeting αvβ3 mediate rapid regression of well-established DIPG tumors and limit growth in vivo. (A) Schematic representation of orthotopic DIPG xenograft model. NSG mice implanted with 5×10⁵ SU-DIPG-36 (eGFP+/ffLuc+) were treated intratumorally with 2×10⁶ CD19.28ζ CAR, αvβ3.28ζ CAR, or αvβ3.BBζ CAR-T cells on day 21 postimplantation. (B) H&E (left) and immunohistochemical staining for human αvβ3 (right) of a longitudinal brain section from NSG mouse depicting anatomical location of SU-DIPG-36 implantation following stereotactic injection and engraftment. (C) Tumor bioluminescence was measured two to three times per week during the first 2 weeks after CAR-T cell administration and once per week thereafter for the duration of the experiment. Representative experiment showing tumor bioluminescence in DIPG engrafted mice following treatment with CD19.28ζ CAR (n=3), αvβ3.28ζ CAR (n=5), or αvβ3.BBζ CAR-T cells (n=5). (D) Graphs represent the total flux (photons/second) of tumor bioluminescence in mice treated with CD19.28ζ CAR, αvβ3.28ζ CAR, or αvβ3.BBζ CAR-T cells in the representative experiment shown in C. Mean values for each treatment group (top) or individual mice in each group (bottom) are shown. (E) Progression-free survival analysis of mice bearing DIPG tumors following CAR-T cell treatment. Progression-free survival was defined as the number of days from CAR-T cell treatment to the first day of disease progression or death. (F) Overall survival analysis of mice following CAR-T cell treatment. (E–F) Results from three independent experiments were pooled (CD19.28ζ, n=11; αvβ3.28ζ, n=13; αvβ3.BBζ, n=14), and Kaplan-Meier survival analysis was performed with log-rank (Mantel-Cox) test for comparison between treatment groups. The representative experiment shown in figure parts C and D was repeated for a total of three independent experiments. Data are presented as means with error bars representing SEM. P values *p<0.05, **p<0.01, ****p<0.0001 were determined by two-way ANOVA with Tukey’s multiple comparisons test. ANOVA, analysis of variance; CAR, chimeric antigen receptor; DIPG, diffuse intrinsic pontine glioma.
Figure 5
Figure 5
DIPG tumor recurrence in mice treated with αvβ3 CAR-T cells does not appear to be a result of poor expansion, T cell exhaustion, or target antigen loss. (A) Peripheral blood was collected on day 7 and day 14 post-treatment for analysis of circulating human T cells (CD45+CD3+) and CAR expression by flow cytometry. Symbols in graph represent individual mice. (B) CAR-T cells were evaluated for expression of PD-1, LAG-3, and TIM-3 following ex vivo expansion. Representative histograms of PD-1, LAG-3, and TIM-3 expression on CD4+ (top) and CD8+ (bottom) CAR-T cell subsets prior to administration into mice with DIPG xenografts. (C) Graphical representation of the MFI of PD-1, LAG-3, and TIM-3 on CD4+ (top) or CD8+ (bottom) CAR-T cells following ex vivo production and expansion. (D–F) MFI of PD-1, LAG-3, and TIM-3 on CD8+ and CD4+ CAR-T cells (stained with protein L) from peripheral blood of treated mice was analyzed by flow cytometry on day 7 and day 14 post-treatment. (G) Brain tissue sections from SU-DIPG-36 xenografts on day 56 post-treatment with CAR-T cells were evaluated by immunohistochemistry staining for human αvβ3. To account for non-specific background staining, non-xenografted mouse brain was used as a control. Scale bars in unmagnified view are 1 mm and bars in insets are 50 µm. Digital detection overlays over the same fields are shown in adjacent panels. The color scheme is as follows: blue: negative; yellow: low (1+); orange: medium (2+); and red: high (3+). (H) Bar graphs represent the mean H-score values across brain tissue sections from multiple mice (n=3–4/group) treated with CAR-T cells. Non-xenografted brain tissue showed minimal staining, yielding an H-score of 0.08, across the full brain section, 0 in the pons, and 1.9 in the subventricular zone (SVZ) (indicated by dotted line on graph). Data in all graphs are presented as means with error bars representing SEM. *P<0.05 was determined by two-way ANOVA with Tukey’s multiple comparisons test. (B–C) Characterization of inhibitory receptor profiles was performed on CAR-T cells generated from three different normal donors. ANOVA, analysis of variance; CAR, chimeric antigen receptor; DIPG, diffuse intrinsic pontine glioma.
Figure 6
Figure 6
αvβ3 CAR-T cells delivered either intratumorally or systemically mediate complete clearance of GBM tumors. (A) NSG mice implanted orthotopically with 5×10⁵ GBM (U87) (eGFP+/ffLuc+) were treated intratumorally with 2×10⁶ CD19.28ζ CAR, αvβ3.28ζ CAR, or αvβ3.BBζ CAR-T cells on day 21 postimplant. Tumor bioluminescence was measured weekly after CAR-T cell administration. Representative experiment showing tumor bioluminescence in GBM engrafted mice following treatment with CD19.28ζ CAR (n=5), αvβ3.28ζ CAR (n=5), or αvβ3.BBζ CAR-T cells (n=5). (B) Graphs represent the total flux (photons/second) of tumor bioluminescence in mice treated with CD19.28ζ CAR, αvβ3.28ζ CAR, or αvβ3.BBζ CAR-T cells in the representative experiment shown in figure part A. Individual values for each mouse in each group (left) or mean values for each treatment group are shown (right). (C) Overall survival analysis of mice following CAR-T cell treatment in figure parts A and B. Kaplan-Meier survival analysis was performed with log-rank (Mantel-Cox) test for comparison between treatment groups. (D) NSG mice implanted orthotopically with 5×10⁵ GBM (U87) (eGFP+/ffLuc+) were treated intravenously with 10×106 CD19.28ζ CAR or αvβ3.BBζ CAR-T cells on day 21 postimplantation. Representative experiment showing tumor bioluminescence in GBM engrafted mice following treatment with CD19.28ζ CAR (n=4) or αvβ3.BBζ CAR-T cells (n=5). (E) Graphs represent the total flux of tumor bioluminescence in mice treated with CD19.28ζ CAR or αvβ3.BBζ CAR-T cells in the representative experiment shown in figure part D. Individual values for each mouse in each group (left) or mean values for each treatment group (right) are shown. (F) Overall survival analysis of mice following CAR-T cell treatment in figure parts D and E. Results shown in figure parts A–C (intratumoral CAR-T injection) and figure parts D–F (intravenous CAR-T injection) were each replicated in two independent experiments. In C and D, deaths due to a procedural issue, and not related to disease, are denoted with an X and have not been counted against survival. (B and E) Data are presented as means with error bars representing SEM. (B) P values: *p<0.05, **p<0.01, ***p<0.001, and ****p<0.0001 were determined by two-way ANOVA with Tukey’s multiple comparisons test. (E) P values: ***p<0.001 and ****p<0.0001 were determined by multiple unpaired t-tests. ANOVA, analysis of variance; CAR, chimeric antigen receptor; GBM, glioblastoma.
Figure 7
Figure 7
Development of long-lived memory αvβ3 CAR-T cells following clearance of GBM tumors in mice. NSG mice implanted orthotopically with 5×10⁵ GBM (U87) (eGFP+/ffLuc+) were treated intratumorally with 2×10⁶ CD19.28ζ CAR, αvβ3.28ζ CAR, or αvβ3.BBζ CAR-T cells on day 21 postimplant. (A) Peripheral blood was collected on day 42 post-treatment for analysis of circulating T cells (CD45+CD3+) by flow cytometry. (B) Representative flow cytometry dot plots of CD127 and PD-1 expression on CAR+ T cells evaluated on day 42 post-treatment. (C) Graphical representation of CD127+PD-1+ and CD127-PD-1+ populations in circulating CAR-T cells on day 42 post-treatment. (D) Representative flow cytometry histograms of TCF-1 staining in CD8+ CAR-T cells on day 42 post-treatment. Gray-shaded histograms indicate FMO control cells (stained with all fluorochromes minus TCF-1) and black, blue, and green histograms represent CD19.28ζ, αvβ3.28ζ, and αvβ3.BBζ CAR-T cells, respectively. (E) TCF-1 MFI was calculated in CD127+PD-1+ and CD127-PD-1+ populations of CD8+ CAR-T cells for individual mice. (F) Peripheral blood, spleen, and brain were harvested on day 70 post-treatment and analyzed by flow cytometry for the presence of human T cells. (G) Memory CAR-T cell populations (CCR7+CD127+, CCR7+CD127-, CCR7-CD127+, and CCR7-CD127-) were analyzed on day 70 post-treatment in blood, spleen, and brain by gating on CD45+CD3+CAR+ cells. Average CAR+ gated event counts (±SEM) from all mice were as follows for each harvested tissue: blood: 4692 (±3278); spleen: 13 662 (±4470); brain: 2317 (±1068). (A) P values: *p<0.05 and **p<0.01 were determined by using an unpaired nonparametric Mann-Whitney test. (C) Significance was determined with a two-way ANOVA with Tukey’s multiple comparisons test. (E) P values: *p<0.05 and **p<0.01 were determined by two-way ANOVA with Tukey’s multiple comparisons test. Data are presented as means±SEM and symbols in graphs represent individual mice. ANOVA, analysis of variance; CAR, chimeric antigen receptor; GBM, glioblastoma.

Similar articles

Cited by

References

    1. Celgene, ABECMA (idecabtagene vicleucel) [Package Insert] 2021.
    1. Neelapu SS, Locke FL, Bartlett NL, et al. . Axicabtagene ciloleucel CAR T-cell therapy in refractory large B-cell lymphoma. N Engl J Med Overseas Ed 2017;377:2531–44. 10.1056/NEJMoa1707447 - DOI - PMC - PubMed
    1. Abramson JS, Palomba ML, Gordon LI, et al. . Lisocabtagene maraleucel for patients with relapsed or refractory large B-cell lymphomas (TRANSCEND NHL 001): a multicentre seamless design study. Lancet 2020;396:839–52. 10.1016/S0140-6736(20)31366-0 - DOI - PubMed
    1. Maude SL, Laetsch TW, Buechner J, et al. . Tisagenlecleucel in children and young adults with B-cell lymphoblastic leukemia. N Engl J Med 2018;378:439–48. 10.1056/NEJMoa1709866 - DOI - PMC - PubMed
    1. Wang M, Munoz J, Goy A, et al. . KTE-X19 CAR T-cell therapy in relapsed or refractory mantle-cell lymphoma. N Engl J Med 2020;382:1331–42. 10.1056/NEJMoa1914347 - DOI - PMC - PubMed

Publication types