. 2022 Feb 24;11(1):43.
doi: 10.1038/s41377-022-00731-w.

Chip-based multimodal super-resolution microscopy for histological investigations of cryopreserved tissue sections

Affiliations

Chip-based multimodal super-resolution microscopy for histological investigations of cryopreserved tissue sections

Luis E Villegas-Hernández et al. Light Sci Appl. .

Abstract

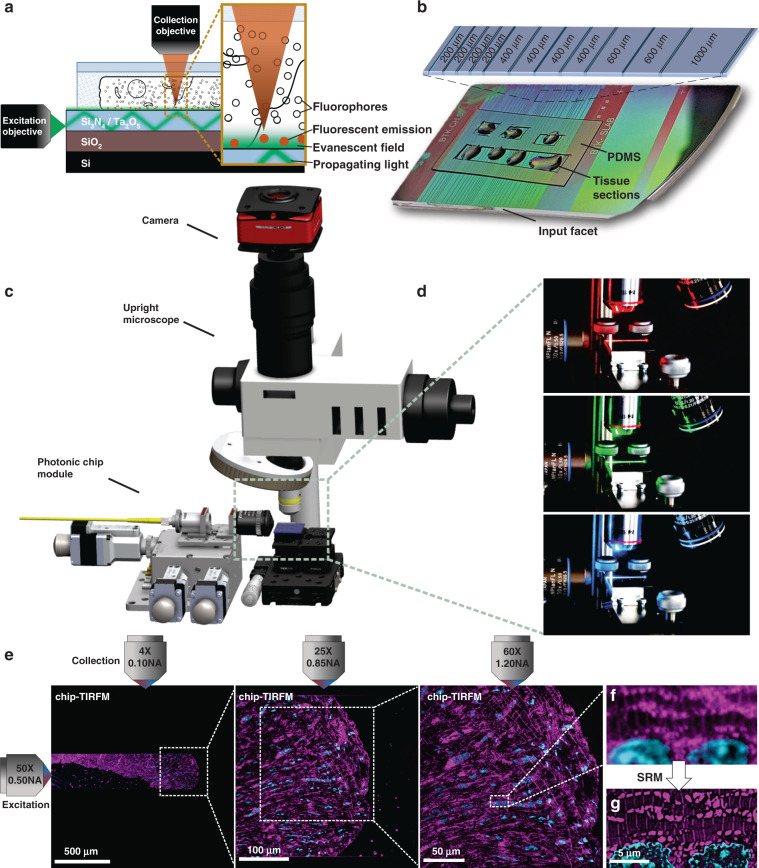
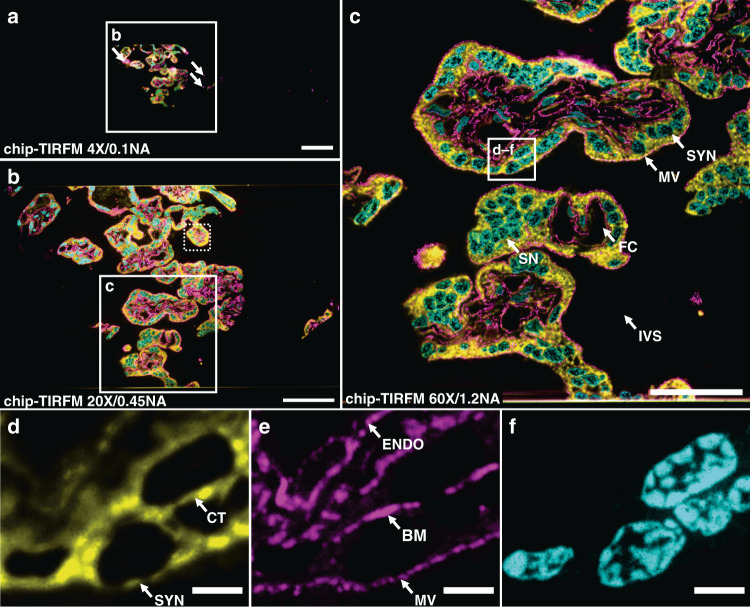
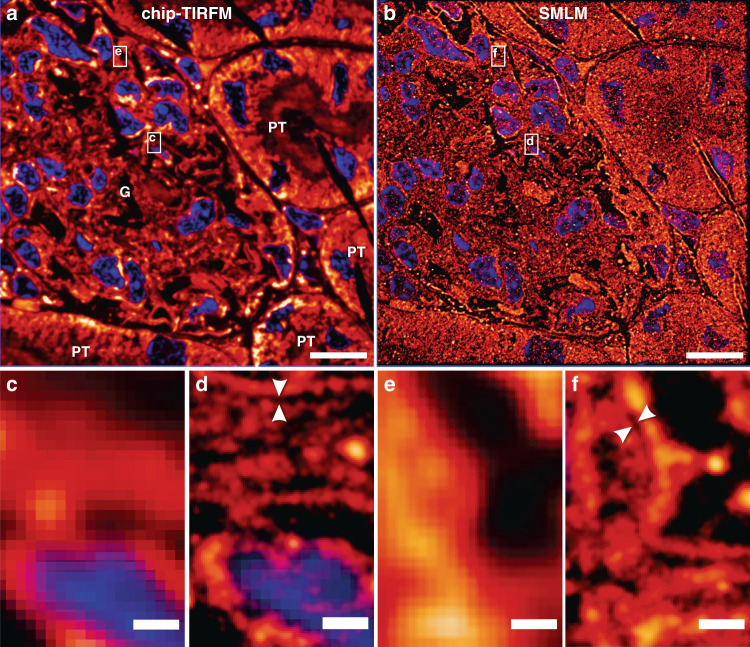
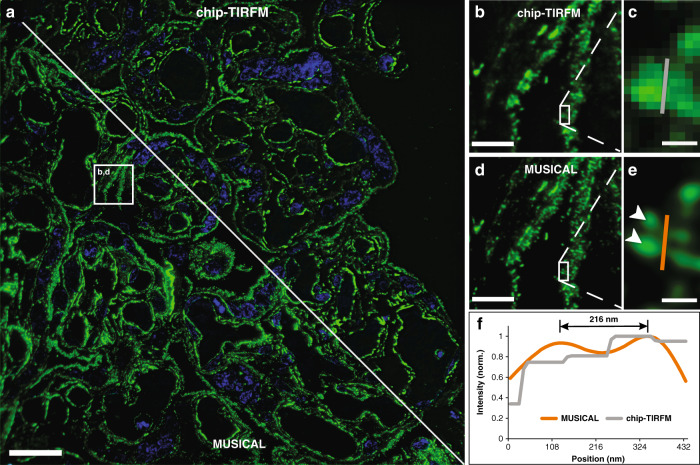
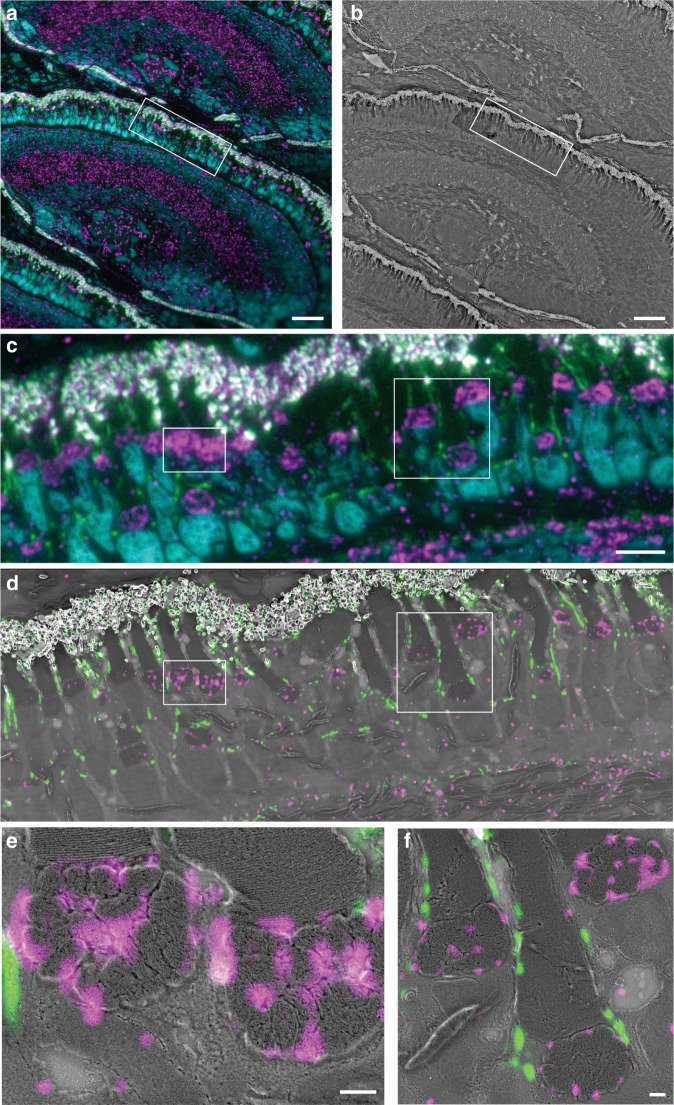
Histology involves the observation of structural features in tissues using a microscope. While diffraction-limited optical microscopes are commonly used in histological investigations, their resolving capabilities are insufficient to visualize details at subcellular level. Although a novel set of super-resolution optical microscopy techniques can fulfill the resolution demands in such cases, the system complexity, high operating cost, lack of multi-modality, and low-throughput imaging of these methods limit their wide adoption for histological analysis. In this study, we introduce the photonic chip as a feasible high-throughput microscopy platform for super-resolution imaging of histological samples. Using cryopreserved ultrathin tissue sections of human placenta, mouse kidney, pig heart, and zebrafish eye retina prepared by the Tokuyasu method, we demonstrate diverse imaging capabilities of the photonic chip including total internal reflection fluorescence microscopy, intensity fluctuation-based optical nanoscopy, single-molecule localization microscopy, and correlative light-electron microscopy. Our results validate the photonic chip as a feasible imaging platform for tissue sections and pave the way for the adoption of super-resolution high-throughput multimodal analysis of cryopreserved tissue samples both in research and clinical settings.


Conflict of interest statement

BSA has applied for a patent for chip-based optical nanoscopy and he is co-founder of the company Chip NanoImaging AS, which commercializes on-chip super-resolution microscopy systems.

Figures

Fig. 1
Fig. 1. Schematic representation of the chip-based total internal reflection fluorescence microscopy (chip-TIRFM) setup.
a Working principle of chip-TIRFM: upon coupling onto the input facet, the excitation light propagates through the waveguide core material due to total internal reflection. An evanescent field of ~150 nm height excites a thin layer of fluorescent dyes in the vicinity of the photonic chip surface, allowing for TIRFM imaging. b Top view of a photonic chip containing ultrathin Tokuyasu cryosections covered with a 1:1 cryoprotectant mixture of 2.3 M sucrose and 2% methylcellulose, and surrounded by a custom-made transparent polydimethylsiloxane (PDMS) frame. The inset illustrates the various strip waveguide widths available on the chip. c The chip-TIRFM setup is composed of a custom-made photonic chip module and a commercially available upright collection module. Upon coupling the excitation light on the photonic chip, the fluorescent signal is allowed through a filter set and captured with a scientific CMOS camera. d The photonic chip allows decoupling of the excitation and the collection light paths, enabling TIRFM imaging using conventional microscope objectives. Different wavelengths propagating on the waveguide core allow for multicolor TIRFM imaging. e TIRFM images of a 100 nm thick pig heart cryosection imaged on a photonic chip through different microscope objectives. Membranes in magenta and nuclei in cyan. Supplementary Information S9 provides a detailed view and an extended description of this tissue sample. f Magnified view of the diffraction-limited TIRFM image acquired with a 60X/1.20NA water immersion microscope objective. g Subsequent post-processing of the raw data enables super-resolution microscopy (SRM), allowing the visualization of structures beyond the diffraction limit of conventional optical microscopy. Image was taken by SIM
Fig. 2
Fig. 2. Chip-based multicolor TIRFM imaging of a 400 nm placental tissue section prepared by Tokuyasu method.
Membranes labeled with CellMask Deep Red (pseudo-colored in yellow), F-actin labeled with Phalloidin-Atto565 (pseudo-colored in magenta), and nuclei labeled with Sytox Green (pseudo-colored in cyan). a Large field of view chip-based multicolor TIRFM image acquired with a 4X/0.1NA microscope objective. The white arrows indicate the locations of unspecific binding of the F-actin marker to the waveguide. The white box represents the area imaged with a higher magnification objective lens in (b). b Chip-based multicolor TIRFM image acquired with a 20X/0.45NA microscope objective. The white box represents the area subsequently imaged with a higher magnification objective lens in (c). The white-dotted box illustrates the maximum field of view (50 µm × 50 µm) attainable in a conventional TIRFM setup. c Multicolor chip-TIRFM image acquired with a 60X/1.2NA microscope objective allows the identification of morphologically relevant structures of the chorionic villi such as the syncytiotrophoblastic cells (SYN), fetal capillaries (FC), syncytial knots (SN), and intervillous space (IVS) without maternal red blood cells due to thorough rinsing during sample preparation. The white box corresponds to the individual channels magnified in (df). d A magnified view of the membrane signal allows the distinction between a SYN and a cytotrophoblastic cell (CT). e A magnified view of the F-actin signal conforms to the expected location for this marker, in places such as the microvilli brush border (MV), the SYN’s basal membrane (BM), and the capillary endothelial cell (ENDO). f Magnified view of syncytial and cytotrophoblast nuclei. Scale bars a 200 µm, b 100 µm, c 50 µm, d, e 5 µm
Fig. 3
Fig. 3. Chip-based single-molecule localization microscopy of a 400 nm mouse kidney cryosection prepared by Tokuyasu method.
Membranes labeled with CellMask Deep Red (pseudo-colored in orange) and nuclei labeled with Sytox Green (pseudo-colored in blue). Images were collected using a 60X/1.2NA water immersion microscope objective. a Chip-TIRFM image of a glomerulus (G) surrounded by proximal tubuli (PT). b Chip-based SMLM image reconstructed with the dSTORM algorithm. cf A magnified view of the white rectangles in (a, b) allows the comparison between the chip-TIRFM and dSTORM images. In particular, the white arrowheads in the SMLM segments show a separation of ~100 nm between cellular structures that are otherwise not observable in the TIRFM segments. Arguably, this nanostructural feature is in agreement with the dimensions of the glomerular basal membrane present in this filtration compartment of the kidney. Scale bars a, b 10 µm, c 500 nm
Fig. 4
Fig. 4. Chip-based intensity fluctuation optical nanoscopy of a 400 nm thick placental tissue section prepared per Tokuyasu method.
F-actin labeled with Phalloidin-Atto565 (pseudo-colored in green) and nuclei labeled with Sytox Green (pseudo-colored in blue). a Multicolor fluorescent image over a 220 µm × 220 µm FOV acquired with a 60x/1.2NA microscope objective. A solid white line divides the image into two segments, illustrating the averaged chip-TIRFM on the top and the MUSICAL reconstruction at the bottom. b, d A magnified view of the white box in (a) allows for visualization of the microvilli (MV) lining the syncytiotrophoblast’s brush border. c Further magnification of the white box in (b) shows a single structure. e White arrowheads denote the location of two adjacent MV over the magnified white box in (d). f Line-profile measurements reveal a separation of 216 nm between two adjacent MV on the MUSICAL reconstruction in (e) that is otherwise not distinguishable on the averaged chip-TIRFM image in (c). Scale bars a 25 µm, b, d 5 µm, and c, e 500 nm. The MUSICAL image was adjusted with a logarithmic transformation in FIJI to improve its contrast
Fig. 5
Fig. 5. Chip-based CLEM imaging of a 110 nm thick zebrafish retina cryosection prepared by Tokuyasu method on a 600 µm wide optical waveguide.
a Diffraction-limited chip-TIRFM image. In magenta, mitochondrial clusters immunolabeled with rabbit anti-Tomm20 protein (primary antibody) and Alexa Fluor 647-conjugated donkey anti-rabbit (secondary antibody). In green, actin segments labeled with Texas Red-X Phalloidin. In cyan, nuclei labeled with Sytox Green. b Scanning electron microscope image of the same region shown in (a) scanned at 30 nm pixel size. c high-magnification image of the white frame in (a) showing the diffraction-limited chip-TIRFM signal of mitochondria, actin, and nuclei. d CLEM image of areas in frames (a) and (b). Scanning electron microscope image acquired at 4 nm pixel size correlates with the MUSICAL images of mitochondria (magenta) and actin (green). e CLEM image of the white region in (d). MUSICAL image of the Tomm20 signal (magenta) in the outer membrane of mitochondria correlating with the morphology of the complex clusters of mitochondria. The tightly packed membranes of the outer segment are clearly recognized. f CLEM image of MUSICAL-processed actin signal along with the outer segments (green) and three mitochondria clusters. The MUSICAL signal in (df) were gamma-corrected to increase the contrast of the actin (γ = 1.2) and the Tomm20 signal (γ = 1.1). Scale bars a, b 20 µm, c, d 5 µm, e, f 500 nm

References

    1. Aeffner F, et al. Digital microscopy, image analysis, and virtual slide repository. ILAR J. 2018;59:66–79. - PMC - PubMed
    1. Redman CWG, et al. Does size matter? Placental debris and the pathophysiology of pre-eclampsia. Placenta. 2012;33:S48–S54. - PubMed
    1. Lange K. Fundamental role of microvilli in the main functions of differentiated cells: outline of an universal regulating and signaling system at the cell periphery. J. Cell. Physiol. 2011;226:896–927. - PubMed
    1. Unwin PNT, Zampighi G. Structure of the junction between communicating cells. Nature. 1980;283:545–549. - PubMed
    1. Inaga S, et al. Rapid three-dimensional analysis of renal biopsy sections by low vacuum scanning electron microscopy. Arch. Histol. Cytol. 2011;73:113–125. - PubMed