. 2022 Feb 24;13(2):175.
doi: 10.1038/s41419-022-04636-9.

Latexin deficiency attenuates adipocyte differentiation and protects mice against obesity and metabolic disorders induced by high-fat diet

Affiliations

Latexin deficiency attenuates adipocyte differentiation and protects mice against obesity and metabolic disorders induced by high-fat diet

Shuang Kan et al. Cell Death Dis. .

Abstract

Obesity is a risk factor for many chronic diseases, and is associated with increased incidence rate of type 2 diabetes, hypertension, dyslipidemia and cardiovascular diseases. Adipocyte differentiation play critical role during development of obesity. Latexin (LXN), a mammalian carboxypeptidase inhibitor, plays important role in the proliferation and differentiation of stem cells, and highlights as a differentiation-associated gene that was significantly downregulated in prostate stem cells and whose expression increases through differentiation. However, it is unclear whether LXN is involved in adipocyte differentiation. The aim of this study was to evaluate the role of LXN on adipocyte differentiation, as well as its effects on high fat-induced obesity and metabolic disorders. In this study, we determine the expression of LXN in adipose tissue of lean and fat mice by Western blot, qPCR and immunohistochemistry. We found that LXN in fat tissues was continuous increased during the development of diet-induced obesity. We fed wild-type (WT) and LXN-/-mice with high-fat diet (HFD) to study the effects of LXN on obesity and related metabolic functions. We found that mice deficient in LXN showed resistance against high-fat diet (HFD)-induced obesity, glucose tolerance, insulin tolerance and hepatic steatosis. In vitro studies indicated that LXN was highly induced during adipocyte differentiation, and positively regulated adipocyte differentiation and adipogenesis in 3T3-L1 cells and primary preadipocytes. Functional analysis revealed that the expression of LXN was positively regulated by mTOR/RXR/PPARɤ signaling pathway during the differentiation of adipocytes, while LXN deletion decreased the protein level of PPARɤ in adipocyte through enhancing FABP4 mediated ubiquitination, which led to impaired adipocyte differentiation and lipogenesis. Collectively, our data provide evidence that LXN is a key positive regulator of adipocyte differentiation, and therapeutics targeting LXN could be effective in preventing obesity and its associated disorders in clinical settings.


Conflict of interest statement

The authors declare no competing interests.

Figures

Fig. 1
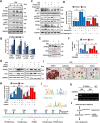
Fig. 1. Enhanced expression of LXN in obese mice.
A Representative pictures for WT and ob/ob mice after feeding with normal diet (ND) for 16 weeks. B, C QPCR (B) and Western blot (C) analysis for LXN in the subcutaneous adipose tissue of WT and ob/ob mice. The bar graphs showing the results of all animals examined. Data are mean ± SD. **P < 0.01 vs. WT. D Immunohistological analysis of LXN expression in adipose tissues of WT and ob/ob mice. Scale bars, 200 μm. E, F 8-week-old male C57/B6 mice (n = 6) were fed with high fat-diet (HFD) for additional 8, 14 or 23 weeks, then adipose tissue were harvested. LXN was determined by QPCR (E) and western blot (F). The bar graph shows quantification of LXN level in all animals examined. **P < 0.01 vs. 0 W.
Fig. 2
Fig. 2. Reduced adiposity in LXN-deficient mice.
A Representative pictures for WT and LXN−/− mice after feeding with HFD or ND for 23 weeks. B Comparison of body weight changes between WT and LXN−/− mice during the course of ND or HFD induction (n = 8). ND-WT, WT mice fed with ND; ND-KO, LXN−/− mice fed with ND; HF-WT, WT mice fed with HFD; HF-KO, LXN-/- mice fed with HFD. C, D Representative pictures for perirenal adipose tissue (C) and subcutaneous adipose tissue (D) collected from WT and LXN-/- mice after 23 weeks of HFD or ND feeding, and analysis of the weight. E, F Representative pictures for H&E-stained perirenal adipose sections (E) and subcutaneous adipose sections (F) collected from WT and LXN-/- mice after 23 weeks of HFD or ND feeding. Scale bar = 200 μm. Mean adipocyte size was calculated. All results were presented as mean ± SD, and P values were calculated with use of Student t test. *P < 0.05, and **P < 0.01.
Fig. 3
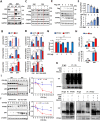
Fig. 3. LXN deficiency inhibits adipocyte differentiation and adipogenesis in vitro.
A, B 3T3-L1 cells were cultured with differentiation medium for 0,3 and 5 d, the mRNA level of LXN (A), PPARɤ, CEBPα and FABP4 (B) were determined by qPCR. C, D 3T3-L1 cells were transfected with LXN siRNA or flag-LXN plasmid. After 48 h, the cells were cultured with differentiation medium for 3 d. Cultured cells were subjected to Oil Red O staining (C) and imaged by EVOS microscope (D). EV empty vector, siCTL siRNA control, Scale bar = 50 μm. E, F WT and LXN−/ preadipocytes (KO) were cultured with differentiation medium for 3 d (E). Cultured cells were subjected to Oil Red O staining (F). Scale bar = 50 μm. G LXN−/− preadipocytes were transfected with flag-LXN plasmid or empty vector. The cells were cultured with differentiation medium for 3 d, and subjected to Oil Red O staining. Scale bar = 50 μm.
Fig. 4
Fig. 4. RNA sequencing reveals down-regulation of PPARɤ targeted genes in preadipocytes after deletion of LXN.
A Volcano plot of differentially expressed genes (DGEs) in WT and KO preadipocytes cultured with normal medium (KO vs WT), WT preadipocytes cultured with normal medium and differentiation medium (DM_WT vs WT) and WT or KO preadipocytes cultured with differentiation medium (DM_KO vs DM_WT). B The overlapping genes identified in different experimental groups. C DEGs identified by RNA-seq were presented in Heatmap. D GO enrichment analysis of DEGs in DM_WT vs WT group (left) and DM_KO vs DM_WT group (right). EG Heatmap shows the GSEA of representative KEGG pathway in WT preadipocytes cultured with differentiation medium or normal medium (E), WT and KO preadipocytes cultured with normal medium (F) and differentiation medium (G). H Real-time PCR results for analysis of LXN and PPARɤ targeted genes in WT or KO preadipocytes under normal medium or differentiation medium. All results were presented as mean ± SD. *P < 0.05, and **P < 0.01, ns: no significance.
Fig. 5
Fig. 5. mTOR/RXR/PPARɤ signaling pathway is required for the upregulation of LXN during adipogenesis.
A, B 3T3-L1 cells were cultured in differentiation medium for 0, 3, 5, 7 d. Cell extracts were subjected to Western blot analysis with the indicated antibodies (A) and then quantified and normalized (B). *P < 0.05, and **P < 0.01 vs. 0 d. C, D 3T3-L1 cells were pre-treated with 10µmol/L perifosine (AKT inhibitor) or 20nmol/L rapamycin (mTOR inhibitor) for 12 h. After that, the cells were cultured with normal medium or differentiation medium for 3 d. The cell extracts were then subjected to Western blot analysis with the indicated antibodies (C), and the relative protein levels of PPARɤ and LXN were assessed (D). E, F 3T3-L1 cells were pre-treated with 10 µmol/L GW9662 (PPARɤ antagonist) for 2 h, and then cells were cultured with normal medium or differentiation medium for 3 d. The cell extracts were then subjected to Western blot analysis with the indicated antibodies (E), and the relative protein levels of PPARɤ and LXN were assessed (F). G, H Normal medium or differentiation medium-cultured 3T3-L1 cells were treated with 20 µmol/L 3BDO (mTOR agonist) for 12 h followed by treatment with 20 µmol/L PA452 (RXR antagonist) for an additional 60 h. to assess PPARɤ and LXN protein levels. The cell extracts were then subjected to Western blot analysis with the indicated antibodies (G), and the relative protein levels of PPARɤ and LXN were assessed (H). I 3T3-L1 cells were cultured in differentiation medium with GW9662, rapamycin or PA452, respectively, for 3 d. Cultured cells were subjected to Oil Red O staining. Scale bar = 50 μm. J Prediction of PPARɤ and PPARɤ::Rxra binding sites in LXN promoter region (~3000 bp) by JASPAR CORE database (https://jaspar.genereg.net/). Pink, represents the predicted PPARɤ binding region; Green, represents the predicted PPARɤ::Rxra binding region; K 3T3-L1 cells cultured in normal medium (NM) and differentiation medium (DM) with or without GW9662 (PPARɤ antagonists) treatment for 3 d, and the binding activity of PPARɤ to LXN promoter in 3T3-L1 cells was determined by ChIP assay. L Schematic diagram to demonstrate the mechanism by which LXN was upregulated during preadipocyte differentiation. All results were presented as mean ± SD. *P < 0.05, and **P < 0.01, ns: no significance.
Fig. 6
Fig. 6. LXN negatively regulates PPARɤ ubiquitination by inhibiting FABP4 expression.
A, B Primary preadipocytes isolated from WT and LXN−/− mice were cultured with normal medium (NM) or differentiation medium (DM) for three days. Cell extracts were subjected to Western blot analysis with the indicated antibodies (A), and the relative protein levels of LXN, PPARɤ and FABP4 were assessed (B). C, D 3T3-L1 cells were transfected with scramble siRNA or LXN siRNA. Twelve hours later, the medium was changed, and the cells were cultured in the differentiation medium containing 20 µmol/L BMS (FABP4 inhibitor) for 3 days. The cell extracts were then subjected to Western blot analysis with the indicated antibodies (C), and the relative protein levels of LXN, PPARɤ and FABP4 were assessed (D). E-G Normal medium-cultured 3T3-L1 cells were transfected with 0, 1, 3, 5 µg Flag-LXN plasmid, respectively, for 48 h. The cell extracts were then subjected to Western blot analysis with the indicated antibodies (E), and relative quantification of FABP4 and PPARɤ were presented (F). The relative mRNA levels of FABP4 and PPARɤ were determined by qPCR (G). H qPCR determine the relative mRNA level of FABP4 (left) and PPAR ɤ (right) in WT and LXN-/- primary preadipocytes under normal medium or differentiation medium condition. I WT and LXN-/- primary preadipocytes were treated with CHX (350 mmol/L) and harvested at the indicated times after CHX addition. Immunoblots of cell extracts with antibodies directed against PPARɤ, LXN, and β-actin are shown (left). Half-life analysis of PPARɤ protein, relative to time 0 (right). J Overexpression of LXN by lentivirus in LXN-/- primary preadipocytes followed by CHX treatment for the indicated times. Immunoblots of cell extracts with antibodies directed against PPARɤ, LXN, and β-actin are shown (left). Half-life analysis of PPARɤ protein, relative to time 0 (right). K 3T3-L1 cells were transfected with scramble siRNA or LXN siRNA for 48 h. After that the cells were treated with 20 µmol/L BMS for 12 h, and then the cells were cultured with differentiation medium. After 48 h, the cells were treated with MG132 (0.1 µmol/L) for another 12 h. Cell lysates were immunoprecipitated with an anti-ubiquitin or anti-PPARɤ antibody, and the immunoprecipitates were immunoblotted with antibodies directed against ubiquitin or PPARɤ. All results were presented as mean ± SD. *P < 0.05, and **P < 0.01, *** P < 0.001, ns: no significance.
Fig. 7
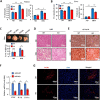
Fig. 7. LXN-deficient mice are resistant to HFD-induced hepatic steatosis.
A, B Results for TG and cholesterol levels in plasma (A) and liver (B) of WT and LXN-/- mice fed a ND or HFD for 23 weeks (n = 8). C Comparison of liver weight. Top: Representative pictures for livers collected from WT and LXN−/− mice. Bottom: Results for liver weight (n = 8). D, E Representative results for H&E staining (D) and Oil Red O staining (E) of liver sections. Scale bar = 200 μm. F Real-time PCR results for analysis of inflammation marker genes in liver (n = 8). G Representative pictures for immunofluorescence staining of F4/80 of liver sections. Scale bar = 100 μm. All results were presented as mean ± SD, and P values were calculated with use of Student t test. *P < 0.05, and **P < 0.01, ns: no significance.
Fig. 8
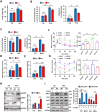
Fig. 8. LXN deficiency ameliorates HFD-induced insulin resistance and glucose intolerance.
A Body weight in WT and LXN−/− mice fed a ND or HFD for 16 weeks (n = 8). B, C Results for TG and cholesterol levels in perirenal adipose tissue (B) and sWAT (C) of WT and LXN-/- mice fed a ND or HFD for 16 weeks (n = 8). D, E Analysis of fasting plasma glucose (D) and insulin (E) levels. All mice were fasted for 12 h before the analysis. F Results for intraperitoneal glucose tolerance tests (GTT) (left) and area under the curve (AUC) for the blood glucose levels (right). G Results for intraperitoneal insulin tolerance tests (ITT) (left) and AUC for the blood glucose levels (right). For the GTT, fasting overnight mice were gavage fed with a 2 mg glucose/g body wt glucose load. For the ITT, mice fasted for 6 h were intraperitoneally injected with 0.5 U insulin/kg body wt using an insulin syringe. ND-WT, WT mice fed with ND; ND-KO, LXN−/ mice fed with ND; HF-WT, WT mice fed with HFD; HF-KO, LXN-/- mice fed with HFD. H Western blot analysis for p-AMPK, total AMPK, and LXN in the sWAT. I Western blot analysis for p-IRS1 (Ser307), total IRS1, p-AKT (Ser473), and total AKT in the sWAT. Mice were fasted overnight and injected intraperitoneally with insulin (1U/kg body wt). Tissues were excised 15 min after injection for immunoblotting analyses. All results were presented as mean ± SD, and P values were calculated with use of Student t test. *P < 0.05, and **P < 0.01, ns: no significance.

Similar articles

Cited by

References

    1. Heymsfield SB, Wadden TA. Mechanisms, pathophysiology, and management of obesity. N Engl J Med. 2017;376:254–66. - PubMed
    1. Piche ME, Tchernof A, Despres JP. Obesity phenotypes, diabetes, and cardiovascular diseases. Circulation Res. 2020;126:1477–1500. - PubMed
    1. Global BMIMC. Di Angelantonio E, Bhupathiraju Sh N, Wormser D, Gao P, Kaptoge S, et al. Body-mass index and all-cause mortality: individual-participant-data meta-analysis of 239 prospective studies in four continents. Lancet. 2016;388:776–86. - PMC - PubMed
    1. Collaborators GBDO. Afshin A, Forouzanfar MH, Reitsma MB, Sur P, Estep K, et al. Health effects of overweight and obesity in 195 countries over 25 years. N Engl J Med. 2017;377:13–27. - PMC - PubMed
    1. Cinti S. The adipose organ. Prostaglandins, leukotrienes, Essent Fat acids. 2005;73:9–15. - PubMed

Publication types