. 2022 Feb 24;12(1):3179.
doi: 10.1038/s41598-022-06307-3.

The impact of tethered recording techniques on activity and sleep patterns in rats

Affiliations

The impact of tethered recording techniques on activity and sleep patterns in rats

Katharina Aulehner et al. Sci Rep. .

Abstract

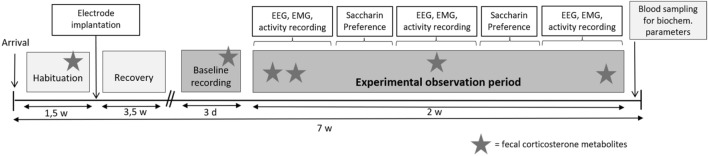
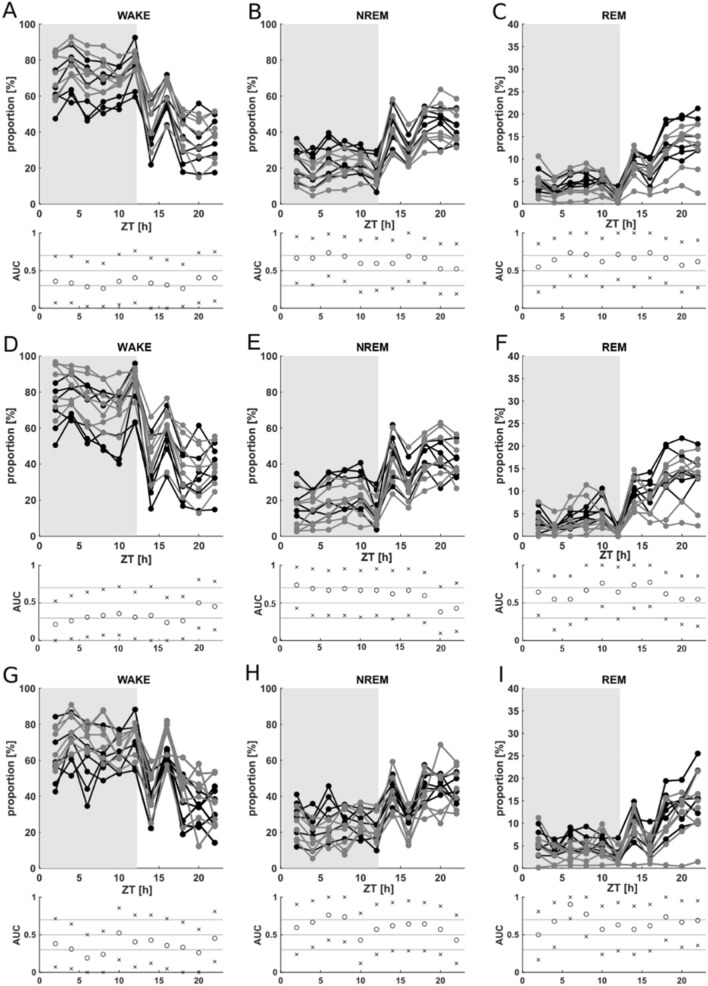
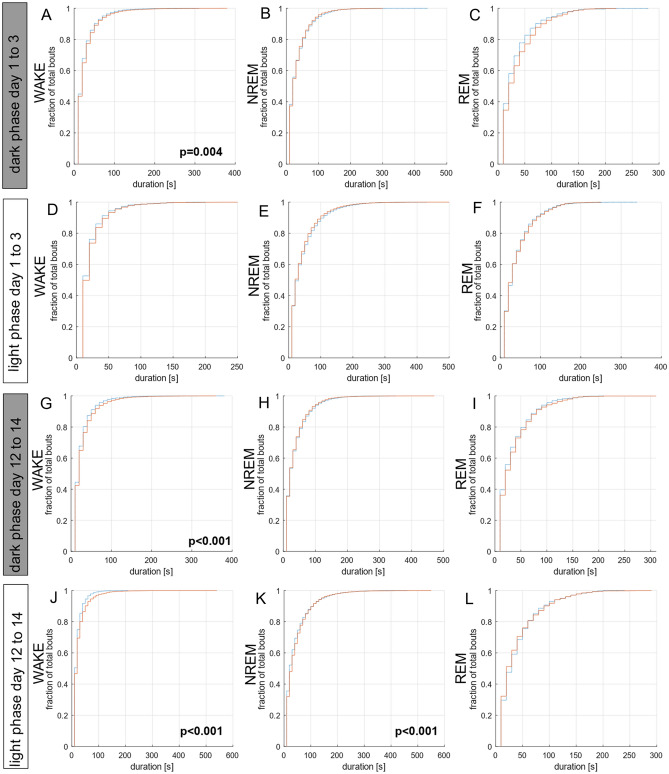
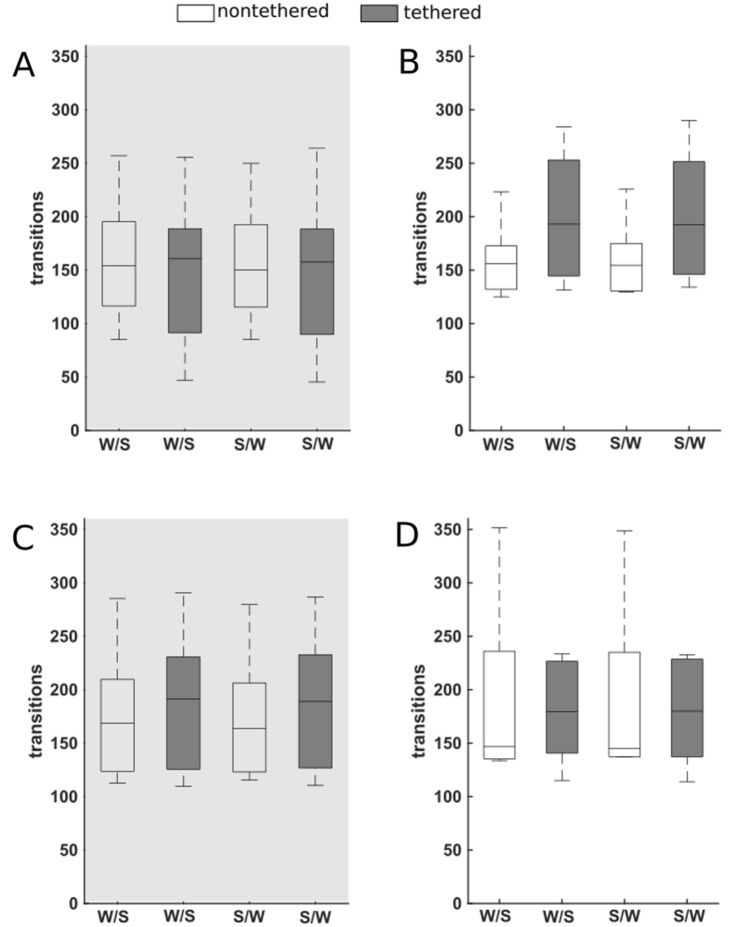
Electrophysiological recordings in animals constitute frequently applied techniques to study neuronal function. In this context, several authors described tethered recordings as a semi-restraint situation with negative implications for animal welfare and suggested radiotelemetric setups as a refinement measure. Thus, we here investigated the hypothesis that tethered recordings exert measurable effects on behavioral and sleep patterns in Sprague-Dawley rats. Animals were kept in monitoring glass cages either with or without a head connection to a recording cable. Saccharin preference, nest building, serum corticosterone and fecal corticosterone metabolite levels were in a comparable range in both groups. The proportion of vigilance states was not affected by the cable connection. Minor group differences were detected in bout lengths distributions, with a trend for longer NREM and WAKE stages in animals with a cable connection. However, a relevant effect was not further confirmed by an analysis of the number of sleep/wake and wake/sleep transitions. The analysis of activity levels did not reveal group differences. However, prolonged exposure to the tethered condition resulted in an intra-group increase of activity. In conclusion, the comparison between freely moving vs tethered rats did not reveal major group differences. Our findings indicate that telemetric recordings only offer small advantages vs cabled set ups, though this may differ in other experimental studies where for example anxiety- or drug-induced effects are analyzed.


Conflict of interest statement

The authors declare no competing interests.

Figures

Figure 1
Figure 1
Timeline of the study. EEG: electroencephalographic; EMG: electromyographic.
Figure 2
Figure 2
Hypnogram of the nontethered (A) and tethered (B) animals throughout the 22 h experimental observation period. Lights were turned on after 12 h. The x-axis represents Zeitgeber time (ZT). The gray rectangle exhibits the dark phase, the white rectangle exhibits the light phase. White exhibits WAKE, light gray exhibits NREM sleep and dark gray exhibits REM sleep. The synchronous interruption of sleep at H14 (ZT) coincides with entering the animal room to take nest photos. This synchronous interruption at this time of the day is visible throughout the entire experimental observation period. #: individual animal number.
Figure 3
Figure 3
Proportion of the vigilance states of the nontethered (black, n = 6) and tethered (gray, n = 7) animals for nonoverlapping 2 h observation episodes throughout the 22 h. Lights were turned on after 12 h. Gray exhibits the dark phase, white exhibits the light phase. The x-axis represents Zeitgeber time (ZT). Circles represent the calculated AUC. The limits of the 95% confidence intervals are represented by the letter x. NREM: NREM sleep, REM: REM sleep (AC) Averaged values for all 9 days of the experimental observation period for WAKE (A), NREM sleep (B) and REM sleep (C). The AUC analysis detected no effect between the nontethered (black) and tethered (gray) animals. (DF) Averaged values for the first 3 days (early) of the experimental observation period for WAKE (D), NREM sleep (E) and REM sleep (F). The AUC analysis detected no effect between the nontethered (black) and tethered (gray) animals. (GI) Averaged values for the last 3 days (late) of the experimental observation period for WAKE (G), NREM sleep (H) and REM (I) sleep. The AUC analysis detected no effect between the nontethered (black) and tethered (gray) animals. Data are plotted individually for each animal.
Figure 4
Figure 4
Bout length distribution of the vigilance states of the nontethered (broken blue lines, n = 6) and tethered (solid red lines, n = 7) animals pooled for dark phase and light phase. (AC) Bout lengths of the dark phase at the beginning (first 3 days) of the experimental observation period for WAKE (A), NREM sleep (B) and REM sleep (C). Differences in the bout lengths for WAKE were detected (p = 0.004). (DF) Bout lengths of the light phase at the beginning (first 3 days) of the experimental observation period for WAKE (D), NREM sleep (E) and REM sleep (F). (GI) Bout lengths of the dark phase at the end (last 3 days) of the experimental observation period for WAKE (G), NREM sleep (H) and REM sleep (I). Differences in the bout lengths for WAKE were detected (p < 0.001). (JL) Bout lengths of the light phase at the end (last 3 days) of the experimental observation period for WAKE (J), NREM sleep (K) and REM sleep (L). Differences in the bout lengths for WAKE (p < 0.001) and NREM (p < 0.001) were detected. Differences between the groups were tested using the Kolmogorov–Smirnov test and cumulative probability plots.
Figure 5
Figure 5
Transitions between WAKE and SLEEP of the nontethered (n = 6) and tethered (n = 7) animals. W/S = Transitions from WAKE to SLEEP. S/W = Transitions from SLEEP to WAKE. (A,B) Averaged values for the first 3 days of the experimental observation period (early) for the dark phase (A) and light phase (B). There was no significant difference between the nontethered and tethered animals in (A) the dark phase and in (B) the light phase. (C,D) Averaged values for the last 3 days of the experimental observation period (late) for the dark phase (C) and light phase (D). There was no significant difference between the nontethered and tethered animals in (C) the dark phase and in (D) the light phase. Box-plots show minimum to maximum values with median. Differences between the groups were tested using the Mann–Whitney-U test.
Figure 6
Figure 6
SWA power of the nontethered (n = 6) and tethered (n = 7) animals for each 10-s episode that was scored NREM. (A,B) Averaged values for the first 3 days of the experimental observation period (early) for the dark phase (A) and light phase (B). There was no significant difference between the nontethered and tethered animals in the dark phase (A) and in the light phase (B). (C,D) Averaged values for the last 3 days of the experimental observation period (late) for the dark phase (C) and light phase (D). There was no significant difference between the nontethered and tethered animals in the dark phase (C) and in the light phase (D). Box-plots show minimum to maximum values with median. Differences between the groups were tested using the Mann–Whitney-U test.
Figure 7
Figure 7
Nest building, anhedonia‐associated behavior, fecal corticosterone metabolite (FCM) levels and serum corticosterone levels for the nontethered (n = 6) and tethered (n = 7) animals. Baseline data: n = 13 animals. (A,B) Averaged nest building scores for day 4 to 6 (A) and day 11 to 13 (B). No significant differences between the nontethered and tethered animals were detected. (C,D) Anhedonia‐associated behavior for the first week (C) and the second week (D). No significant differences between the nontethered and tethered animals were detected. (AD) Data are presented as median (interquartile range). Differences between the groups were tested using the Mann–Whitney-U test. An asterisk indicates a significant difference. (E) Fecal corticosterone metabolite (FCM) levels for Baseline 1 (BL1), Baseline 2 (BL2), Experimental day 1 (Exp1), Experimental day 2 (Exp), Experimental day 8 (Exp8) and Experimental day 14 (Exp14). No significant differences were detected. Data are presented as mean ± SEM. Differences between the groups were tested using a two-way ANOVA with factors “nontethered/tethered” and “days”, followed by a post-hoc Bonferroni multiple comparison test. (F) No significant differences between the nontethered and tethered animals were detected for the serum corticosterone levels. Data are presented as mean ± SEM. Differences were tested using an unpaired t-test (two-tailed).
Figure 8
Figure 8
Activity analysis of the nontethered (n = 6) and tethered (n = 7) animals. (AC) Activity counts of the nontethered (black) and tethered (gray) animals for nonoverlapping 2 h observation episodes throughout the 22 h. Lights were turned on after 12 h. Gray = dark phase, white = light phase. The x-axis represents Zeitgeber time (ZT). cpm = counts per minute. (A) Averaged values for all 9 days of the experimental observation period. The analysis detected no significant difference between the nontethered (black) and tethered (gray) animals at any time point. (B) Averaged values for the first 3 days (early) of the experimental observation period. The analysis detected no significant difference between the nontethered (black) and tethered (gray) animals at any time point. (C) Averaged values for the last 3 days (late) of the experimental observation period. The analysis detected no significant difference between the nontethered (black) and tethered (gray) animals at any time point. Data are plotted individually for each animal. Differences between the groups were tested using a two-way ANOVA with factors “nontethered/tethered” and “hours”, followed by a post-hoc Bonferroni multiple comparison test. (DG) Linear regression model of activity counts of the nontethered and tethered animals throughout the experimental observation phase. For each animal, the average per day pooled for the dark phase and light phase was calculated. The x-axis represents the days. (D,E) Linear regression model of activity counts of the nontethered animals for the dark phase (D) and light phase (E). The activity level was not significantly different over the time course of the observation period. (F,G) Linear regression model of activity counts of the tethered animals for the dark phase (F) and light phase (G). A significant increase in activity counts was analyzed for the dark phase (p = 0.043) and the light phase (p = 0.014). Data are plotted individually for each animal.

References

    1. Russell WMS, Burch RL. The Principles of Humane Experimental Technique. Methuen; 1959.
    1. Lidster K, et al. Opportunities for improving animal welfare in rodent models of epilepsy and seizures. J. Neurosci. Methods. 2016;260:2–25. doi: 10.1016/j.jneumeth.2015.09.007. - DOI - PubMed
    1. Kramer K, Kinter LB. Evaluation and applications of radiotelemetry in small laboratory animals. Physiol. Genomics. 2003;13:197–205. doi: 10.1152/physiolgenomics.00164.2002. - DOI - PubMed
    1. Weiergräber M, Henry M, Hescheler J, Smyth N, Schneider T. Electrocorticographic and deep intracerebral EEG recording in mice using a telemetry system. Brain Res. Protoc. 2005;14:154–164. doi: 10.1016/j.brainresprot.2004.12.006. - DOI - PubMed
    1. Zayachkivsky A, Lehmkuhle MJ, Ekstrand JJ, Dudek FE. Ischemic injury suppresses hypoxia-induced electrographic seizures and the background EEG in a rat model of perinatal hypoxic-ischemic encephalopathy. J. Neurophysiol. 2015;114:2753–2763. doi: 10.1152/jn.00796.2014. - DOI - PMC - PubMed

Publication types