Comparative Study
. 2022 Feb 24;12(1):3186.
doi: 10.1038/s41598-022-06769-5.

Sex-specific differences in KCC2 localisation and inhibitory synaptic transmission in the rat hippocampus

Affiliations
Comparative Study

Sex-specific differences in KCC2 localisation and inhibitory synaptic transmission in the rat hippocampus

Daniele C Wolf et al. Sci Rep. .

Abstract

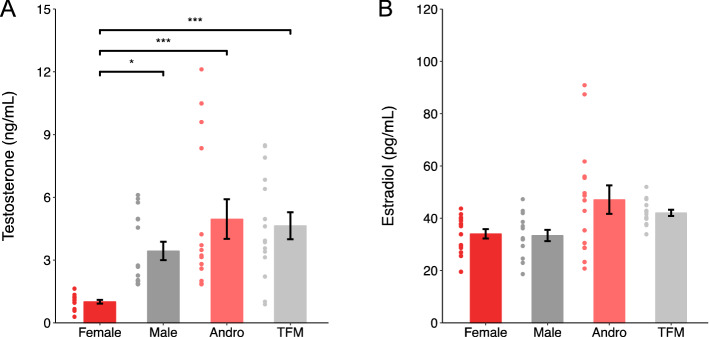
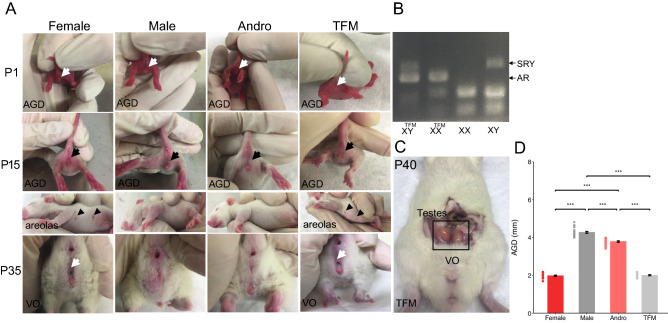
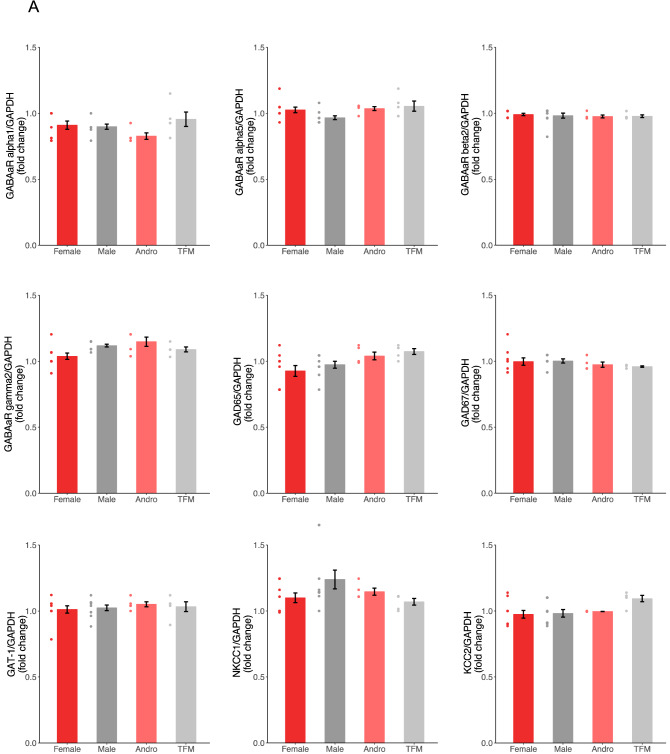
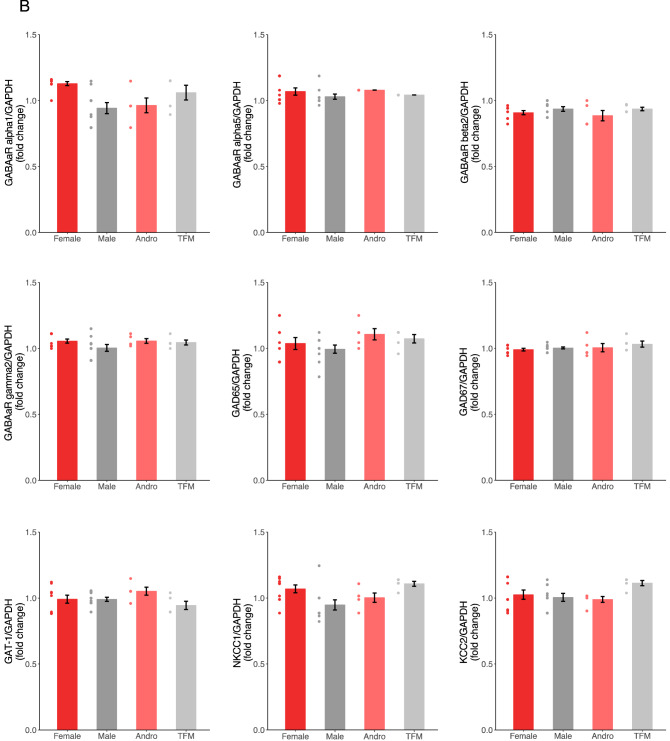
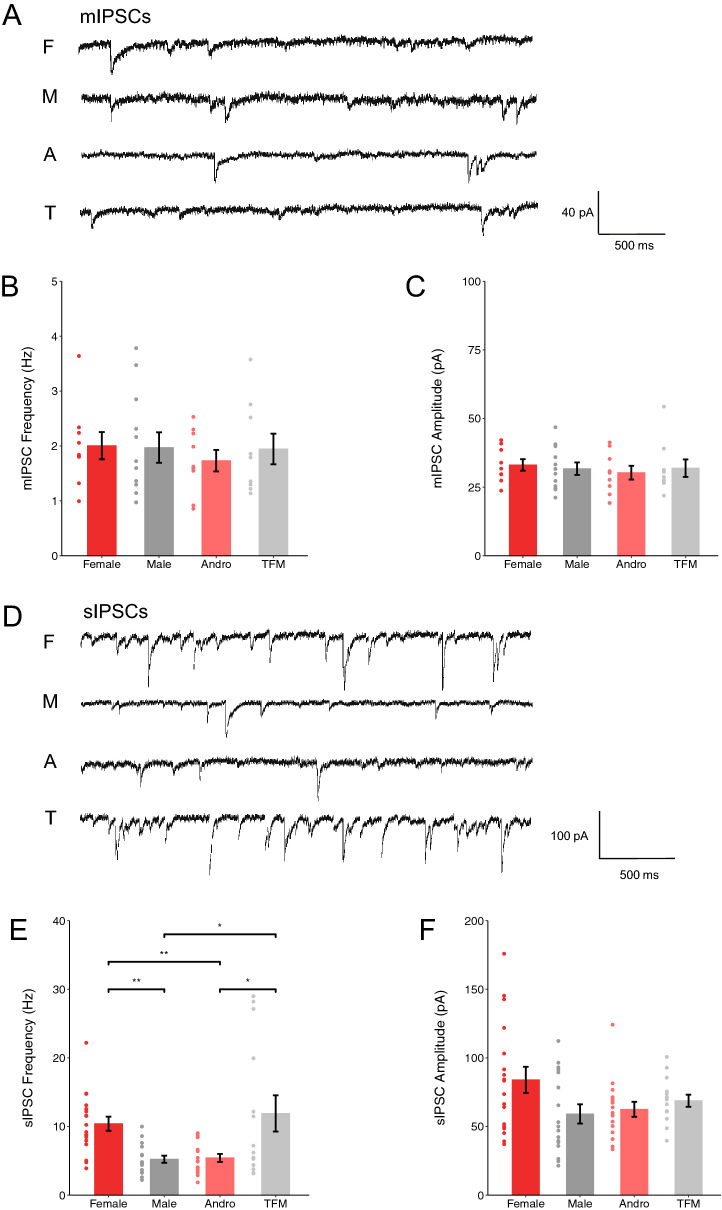
Sexual differentiation of the brain is influenced by testosterone and its metabolites during the perinatal period, when many aspects of brain development, including the maturation of GABAergic transmission, occur. Whether and how testosterone signaling during the perinatal period affects GABAergic transmission is unclear. Here, we analyzed GABAergic circuit functional markers in male, female, testosterone-treated female, and testosterone-insensitive male rats after the first postnatal week and in young adults. In the hippocampus, mRNA levels of proteins associated with GABA signaling were not significantly affected at postnatal day (P) 7 or P40. Conversely, membrane protein levels of KCC2, which are critical for determining inhibition strength, were significantly higher in females compared to males and testosterone-treated females at P7. Further, female and testosterone-insensitive male rats at P7 showed higher levels of the neurotrophin BDNF, which is a powerful regulator of neuronal function, including GABAergic transmission. Finally, spontaneous GABAergic currents in hippocampal CA1 pyramidal cells were more frequent in females and testosterone-insensitive males at P40. Overall, these results show that perinatal testosterone levels modulate GABAergic circuit function, suggesting a critical role of perinatal sex hormones in regulating network excitability in the adult hippocampus.


Conflict of interest statement

The authors declare no competing interests.

Figures

Figure 1
Figure 1
Testosterone is significantly lower in females whereas estradiol levels are similar between sex groups. (A) Bar graph shows higher testosterone levels in all sexes, except for female rat pups (F: 1.01 ± 0.09 ng/mL, n = 15 rats from 3 litters; M: 3.44 ± 0.44 ng/mL, n = 15 rats from 3 litters; A: 4.96 ± 0.95 ng/ml, n = 14 rats from 4 litters; TFM: 4.64 ± 0.65 ng/Ml, n = 15 rats from 5 litters; One-way ANOVA with Tukey’s post hoc analysis, F × M: p = 0.028; F × A: p < 0.001; F × TFM: p < 0.001). (B) Bar graph shows no significant differences in levels of estradiol between all groups (F: 34.0 ± 1.81 pg/mL, n = 15 rats from 3 litters; M: 33.4 ± 2.14 pg/mL, n = 15 rats from 3 litters; A: 47.1 ± 5.47 pg/mL, n = 14 rats from 4 litters; TFM: 42.1 ± 1.18 pg/mL, n = 15 rats from 5 litters; One-way ANOVA with Tukey’s post hoc analysis, F × M: p = 0.995; F × A: p = 0.080; F × TFM: p = 0.140). Dots represent individual data points. M males, F females, A andro/testosterone-treated females, TFM testosterone-insensitive males. Graphs represent mean ± SEM.
Figure 2
Figure 2
Testosterone levels affect sexual developmental markers. (A) Photographs show representative anogenital distances AGD (white arrows) observed in male, female, testosterone-treated females, and testosterone-insensitive male rats at P1, 15 and 35. Presence or absence of areolas are represented by black arrowheads. Vaginal opening (VO) is observed (white arrows) at P35. (B) PCR confirming the genotype of each animal (Tfm vs. wt alleles for androgen receptor (AR). (C) Presence of testes in testosterone-insensitive males despite the feminine external phenotype. (D) Bar graph shows significant differences in AGD length between sex groups (F: 1.98 ± 0.03 mm, n = 24 rats from 5 litters; M: 4.27 ± 0.05 mm, n = 25 rats from 5 litters; A: 3.79 ± 0.04 mm, n = 23 rats from 7 litters; TFM: 2.00 ± 0.03 mm, n = 17 rats from 6 litters; One-way ANOVA with Tukey’s post hoc analysis, F × M, F × A TFM × M, TFM × A: p < 0.0001). Dots represent individual data points. F females, M males, A andro/testosterone-treated females, TFM testosterone-insensitive males. Graphs represent mean ± SEM.
Figure 3
Figure 3
Testosterone does not affect mRNA levels of major GABAergic neurotransmission determinants. (A,B) Fold-change values in mRNA expression of GABA signaling components extracted from rat hippocampus at P7 (A) and P40 (B) do not show significant differences between groups (F: n = 10 rats from 3 litters; M: n = 10 rats from 3 litters; A: n = 5 rats from 3 litters; TFM: n = 5 rats from 3 litters; One-way ANOVA with Tukey’s post hoc analysis, p > 0.05, fold change > 2 or < 0.5 for all comparisons at P7; One-way ANOVA with Tukey’s post hoc analysis, p > 0.05, fold change > 2 or < 0.5 for all comparisons at P40). Dots represent individual data points. F females, M males, A andro/testosterone-treated females, TFM testosterone-insensitive males. Graphs represent mean ± SEM.
Figure 3
Figure 3
Testosterone does not affect mRNA levels of major GABAergic neurotransmission determinants. (A,B) Fold-change values in mRNA expression of GABA signaling components extracted from rat hippocampus at P7 (A) and P40 (B) do not show significant differences between groups (F: n = 10 rats from 3 litters; M: n = 10 rats from 3 litters; A: n = 5 rats from 3 litters; TFM: n = 5 rats from 3 litters; One-way ANOVA with Tukey’s post hoc analysis, p > 0.05, fold change > 2 or < 0.5 for all comparisons at P7; One-way ANOVA with Tukey’s post hoc analysis, p > 0.05, fold change > 2 or < 0.5 for all comparisons at P40). Dots represent individual data points. F females, M males, A andro/testosterone-treated females, TFM testosterone-insensitive males. Graphs represent mean ± SEM.
Figure 4
Figure 4
Perinatal testosterone limits KCC2 localisation at the membrane. (A) Western blot membrane of total KCC2 (images were cropped from the same gel). (B,C) Quantification of total KCC2 expression levels (monomer band at 140 kDa) in the hippocampus of different experimental groups do not show significant differences at P7 (B) (F: 1.28 ± 0.17 au, n = 8 rats from 3 litters; M: 1.18 ± 0.19 au, n = 8 rats from 3 litters; A: 1.19 ± 0.15 au, n = 8 rats from 3 litters; TFM: 1.38 ± 0.22 au, n = 8 rats from 3 litters; One-way ANOVA with Tukey’s post hoc analysis, p = 0.926) or at P40 (C) (F: 0.90 ± 0.12 au, n = 8 rats from 3 litters; M: 0.67 ± 0.11 au, n = 8 rats from 3 litters; A: 0.66 ± 0.09 au, n = 8 rats from 3 litters; TFM: 0.67 ± 0.09 au, n = 8 rats from 3 litters; One-way ANOVA with Tukey’s post hoc analysis, , p = 0.355). (D) Western blot membrane of KCC2 in membrane fractions (images were cropped from different gels). (E,F) Quantification of KCC2 monomer expression levels in the membrane fractions show sex differences in the hippocampus at P7 (E) (F: 1.07 ± 0.10 au, n = 12 rats from 4 litters; M: 0.48 ± 0.03 au, n = 12 rats from 5 litters; A: 0.58 ± 0.05 au, n = 8 rats from 3 litters; TFM: 1.10 ± 0.04 au, n = 5 rats from 3 litters; one-way ANOVA with Tukey’s post hoc analysis, F × M: p < 0.001; F × A: p = 0.001, TFM × M: p < 0.001; TFM × A: p = 0.001). Conversely, no sex differences were found at P40 (F) (F: 0.62 ± 0.08 au, n = 8 rats from 3 litters; M: 0.60 ± 0.04 au, n = 8 rats from 4 litters, A: 0.69 ± 0.11 au, n = 8 rats from 3 litters; TFM: 0.87 ± 0.06 au, n = 8 rats from 3 litters; One-way ANOVA with Tukey’s post hoc analysis, p = 0.121). Each lane represents a different animal. Blot shows representative samples of different sex groups. Dots represent individual data points. F females, M males, A andro/testosterone-treated females, T TFM/testosterone-insensitive males. Graphs represent mean ± SEM.
Figure 5
Figure 5
Perinatal testosterone negatively correlates with BDNF expression levels during the first postnatal week. (A) Western blot analysis of mature BDNF (14 kDa) expression levels in the hippocampus of different experimental groups at P7. Each lane represents a different animal. Blot shows representative samples of different sex groups (images were cropped from different gels). (B) Quantification revealed that the expression of mature BDNF is significantly lower in male when compared to female and testosterone-insensitive male rat pups (F: 1.21 ± 0.14 au, n = 13 rats from 4 litters; M: 0.68 ± 0.09 au, n = 10 rats from 4 litters; A: 0.74 ± 0.12 au, n = 6 rats from 3 litters; TFM: 1.4 ± 0.19 au, n = 6 rats from 3 litters; One-way ANOVA with Tukey’s post hoc analysis, F × M: p = 0.009; TFM × M: p = 0.007). Dots represent individual data points. F females, M males, A andro/testosterone-treated females, T TFM/testosterone-insensitive males. Graphs represent mean ± SEM.
Figure 6
Figure 6
Testosterone signaling is associated with lower sIPSC frequency in young adult CA1 pyramidal neurons. (A) Representative traces of mIPSCs from CA1 pyramidal neurons. (B) mIPSC frequency (F: 2.01 ± 0.25 Hz, n = 9 cells, 4 rats from 3 litters; M: 1.97 ± 0.28 Hz, n = 12 cells, 5 rats from 3 litters; A: 1.73 ± 0.20 Hz, n = 9 cells, 4 rats from 3 litters; TFM: 1.95 ± 0.28 Hz, n = 9 cells , 4 rats from 3 litters; One-way ANOVA with Tukey’s post hoc analysis, p = 0.985) and (C) amplitude (F: 33.10 ± 2.10 pA, n = 9 cells, 4 rats from 3 litters; M: 31.70 ± 2.27 pA, n = 12 cells, 5 rats from 3 litters; A: 30.28 ± 2.52 pA, n = 9 cells, 4 rats from 3 litters; TFM: 31.92 ± 3.20 pA, n = 9 cells,4 rats from 3 litters; One-way ANOVA with Tukey’s post hoc analysis, p = 0.849) did not differ in hippocampal CA1 pyramidal neurons between the sex groups. (D) Representative traces of sIPSCs from CA1 pyramidal neurons. (E) Sex differences were found in the frequency of sIPSC (F: 10.40 ± 1.03 Hz, n = 18 cells, 7 rats from 4 litters; M: 5.23 ± 0.52 Hz, n = 17 cells, 6 rats from 3 litters; A: 5.42 ± 0.58 Hz, n = 16 cells, 6 rats from 3 litters; TFM: 11.90 ± 2.64 Hz, n = 14 cells, 5 rats from 3 litters; One-way ANOVA with Tukey’s post hoc analysis, F × M: p = 0.002; TFM × M: p = 0.021; F × A: p = 0.004; TFM × A: p = 0.030). (F) Conversely, no sex differences were found in the amplitude of sIPSC (F: 83.98 ± 9.48 pA, n = 18 cells, 7 rats from 4 litters; M: 59.13 ± 7.00 pA, n = 17 cells, 6 rats from 3 litters; A: 62.50 ± 5.45 pA, n = 16 cells, 6 rats from 3 litters; TFM: 68.74 ± 4.43, n = 14 cells, 5 rats from 3 litters; One-way ANOVA with Tukey’s post hoc analysis, p = 0.067) in the four experimental groups. Dots represent individual data points. F females, M males, A andro/testosterone-treated females, TFM testosterone-insensitive males. Graphs represent mean ± SEM.

References

    1. Will TR, et al. Problems and progress regarding sex bias and omission in neuroscience research. eNeuro. 2017;4:ENEURO. 0278-17.2017. - PMC - PubMed
    1. Cahill L. Why sex matters for neuroscience. Nat. Rev. Neurosci. 2006;7:477–484. - PubMed
    1. Shansky RM, Murphy AZ. Considering sex as a biological variable will require a global shift in science culture. Nat. Neurosci. 2021;24:457–464. - PubMed
    1. Beery AK, Zucker I. Sex bias in neuroscience and biomedical research. Neurosci. Biobehav. Rev. 2011;35:565–572. - PMC - PubMed
    1. Pinares-Garcia P, Stratikopoulos M, Zagato A, Loke H, Lee J. Sex: A significant risk factor for neurodevelopmental and neurodegenerative disorders. Brain Sci. 2018;8:154. - PMC - PubMed

Publication types

MeSH terms