. 2022 Feb 24;12(1):3152.
doi: 10.1038/s41598-022-06667-w.

Real-time tracking of bioluminescent influenza A virus infection in mice

Affiliations

Real-time tracking of bioluminescent influenza A virus infection in mice

Jin H Kim et al. Sci Rep. .

Abstract

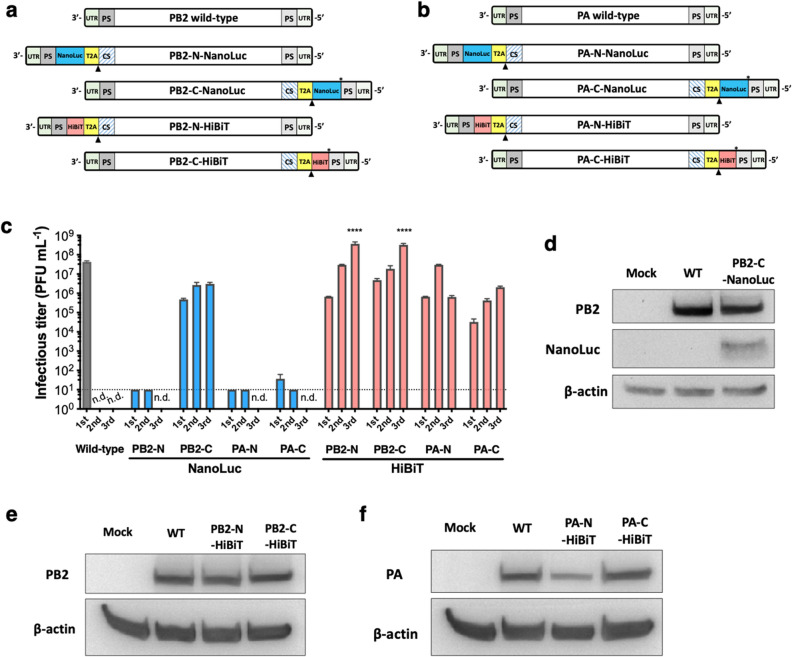
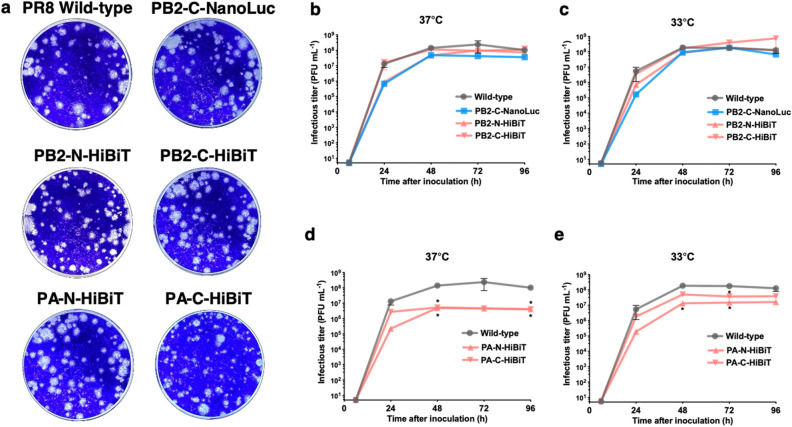
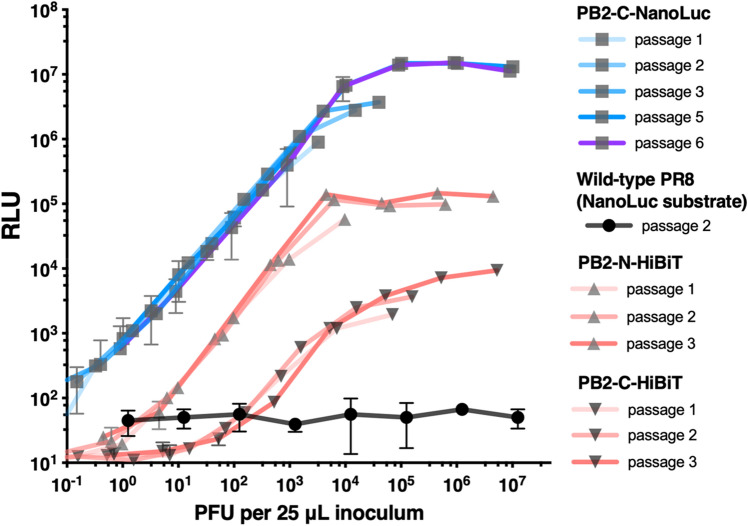
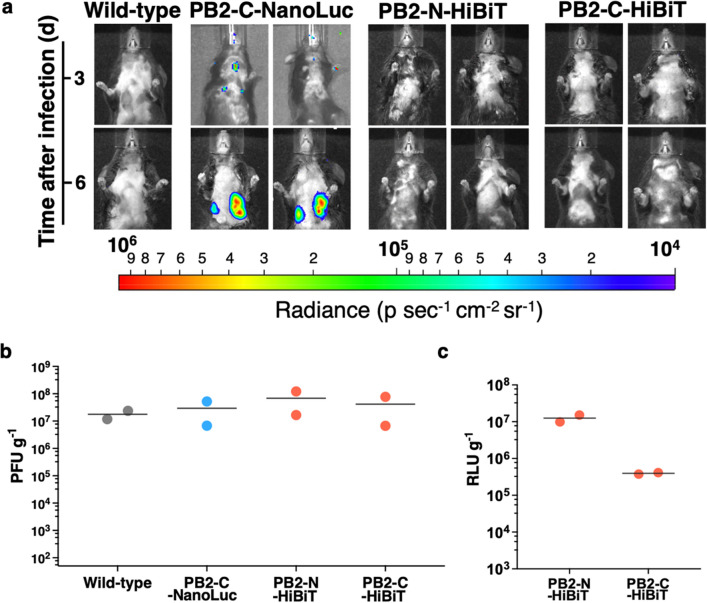
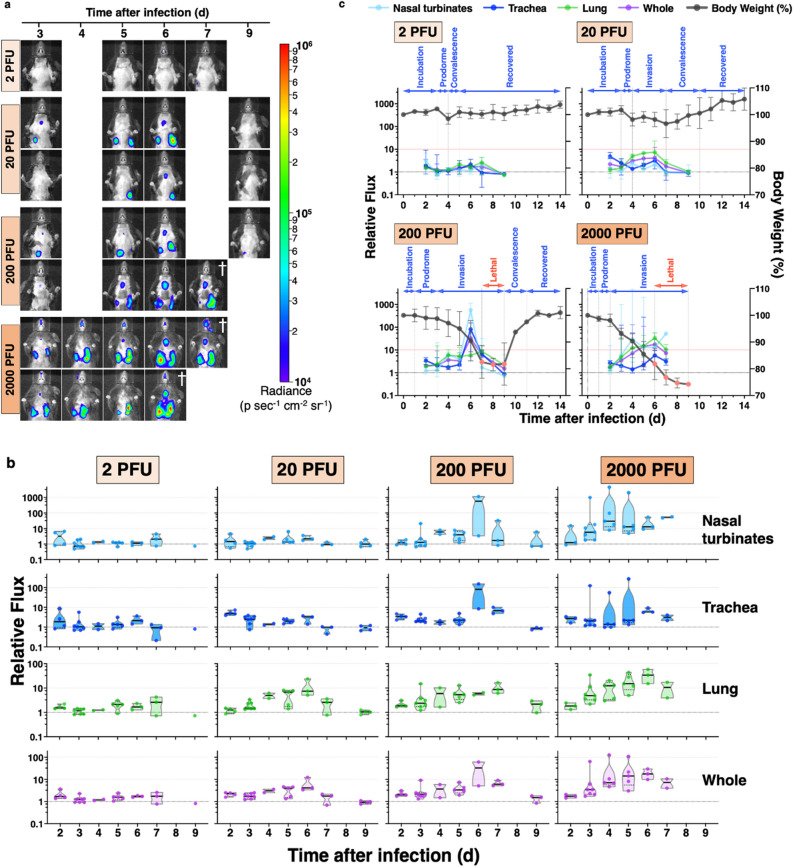
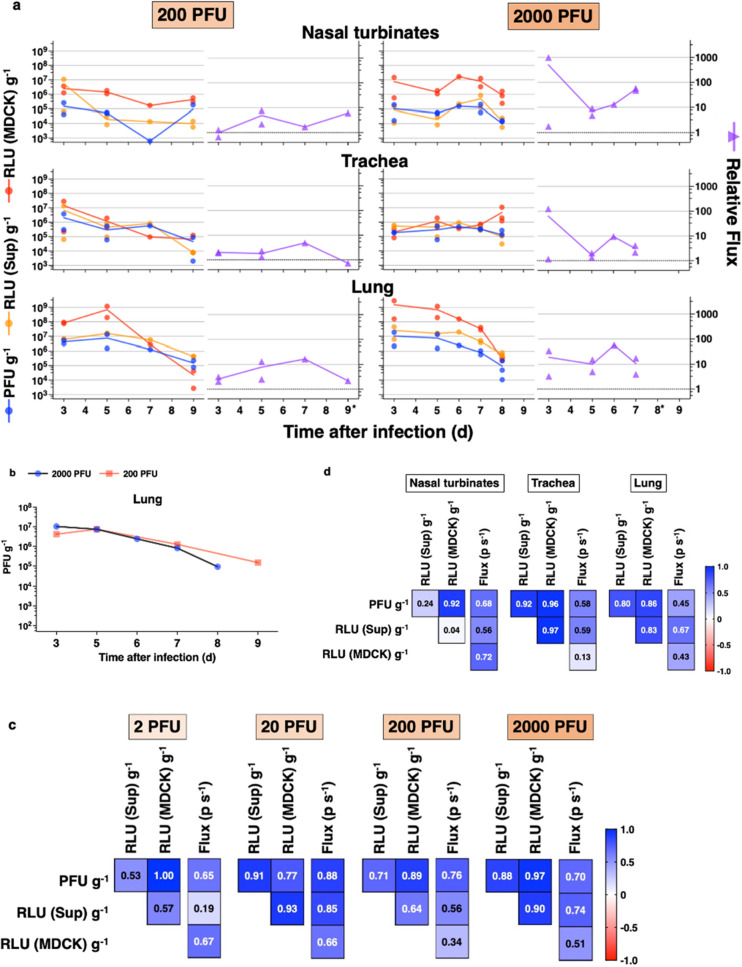
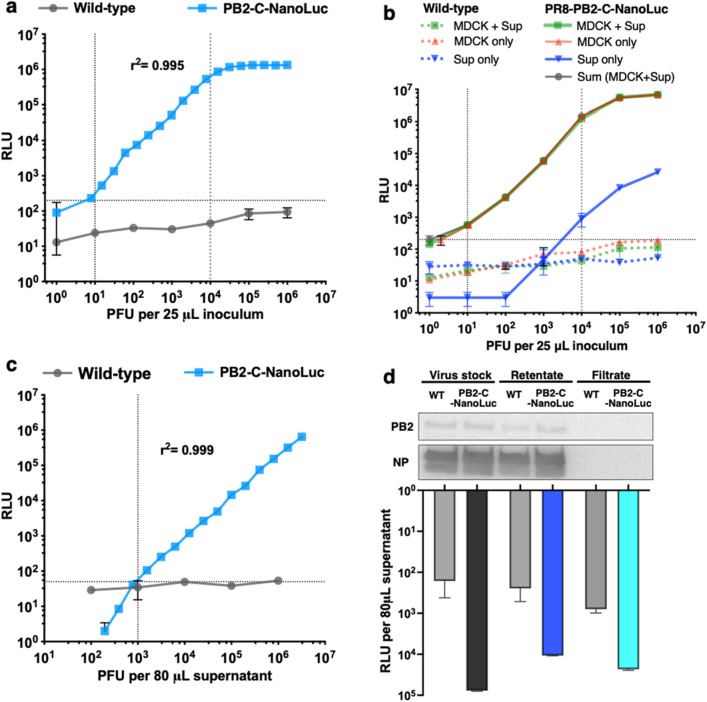
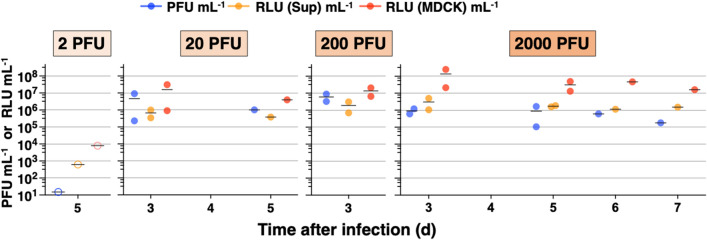
Despite the availability of vaccines and antiviral therapies, seasonal influenza infections cause 400,000 human deaths on average per year. Low vaccine coverage and the occurrence of drug-resistant viral strains highlight the need for new and improved countermeasures. While influenza A virus (IAV) engineered to express a reporter gene may serve as a valuable tool for real-time tracking of viral infection, reporter gene insertion into IAV typically attenuates viral pathogenicity, hindering its application to research. Here, we demonstrate that lethal or even sublethal doses of bioluminescent IAV carrying the NanoLuc gene in the C-terminus of PB2 can be tracked in real-time in live mice without compromising pathogenicity. Real-time tracking of this bioluminescent IAV enables spatiotemporal viral replication tracking in animals that will facilitate the development of countermeasures by enhancing the interpretation of clinical signs and prognosis while also allowing less animal usage.


Conflict of interest statement

The authors declare no competing interests.

Figures

Figure 1
Figure 1
Generation of bioluminescent PR8 IAV carrying NanoLuc or HiBiT reporters. (a,b) Schematic of viral RNA (vRNA) segments in bioluminescent IAV. NanoLuc (510 nt, blue) or HiBiT (33 nt, pink) was inserted into the N- or C-terminus of IAV protein-coding regions linked by the T2A self-cleaving peptide sequence (63 nt, yellow). Native packaging signal (PS) sequences adjacent to the T2A sequence were replaced with codon swapped (CS) sequences. Diagrams are not to scale. Modified sequences in PB2 and PA segments are presented in Supplementary Fig. 8a,b. (a) PB2 vRNA segments. 3′-PB2 fragments contained 3′-UTR (27 nt), 3′-minimum PS sequence (120 nt), NanoLuc or HiBiT sequence, T2A sequence, and 3′ CS sequence (67% of nt homology to PB2). 5′-PB2 fragments included 5′ CS sequence (66% of nt homology to PB2) where the stop codon was removed, T2A sequence, T2A cleavage site (black triangle), NanoLuc or HiBiT sequence, stop codon (*), 5′-minimum PS sequence (120 nt), and 5′-UTR (34 nt). (b) PA vRNA segments. 3′-PA fragments contained 3′-UTR (24 bp), 3′-minimum PS sequence (60 nt), NanoLuc or HiBiT sequence, T2A sequence, and 3′ CS sequence (71% of nt homology to PA). 5′-PA fragments included 5′ CS sequence (75% of nt homology to PA) where the stop codon was removed, T2A sequence, NanoLuc or HiBiT sequence, stop codon (*), 5′-minimum PS sequence (60 nt), and 5′-UTR (58 nt). (c) Rescue of bioluminescent IAVs and serial passages in MDCK cells at low multiplicity of infection (MOI, 0.001) and 37 °C. Data reported as mean ± SD of results in triplicate for first, second, and third passages. Viral infectious titers shown for wild-type (WT) IAV (gray) or IAVs carrying NanoLuc (blue) or HiBiT (pink). n.d. not determined. Dotted line indicates limit of detection (10 PFU mL−1). ****p < 0.0001. (d–f) Protein expression from bioluminescent IAV-infected MDCK cells. Whole MDCK cell lysate with mock infection or infection with WT or bioluminescent IAV (MOI, 0.001), collected at 24 h post inoculation, and examined by Western blot using specific antibodies for PB2, PA, NanoLuc, and β-actin. Cropped blots are displayed. Full-length blots are presented in Supplementary Fig. 9a,b. (d) PB2-C-NanoLuc. (e) PB2-N-HiBiT and PB2-C-HiBiT. (f) PA-N-HiBiT and PA-C-HiBiT.
Figure 2
Figure 2
Growth kinetics of bioluminescent IAVs in MDCK cells. (a) Plaque formation of bioluminescent IAVs in MDCK cells. We compared plaque formation from bioluminescent IAVs at 4 days post inoculation. Confluent MDCK cells in 12-well plates were infected with IAVs (MOI, 0.0002), and plaques were stained with crystal violet, and imaged. PB2-C-NanoLuc and all HiBiT IAVs formed plaques like wild-type PR8 IAV, indicating that the NanoLuc or HiBiT tags did not hinder plaque formation of bioluminescent IAVs. (b,c) Multi-step growth curves of PB2-C-NanoLuc (blue), PB2-N-HiBiT and PB2-C-HiBiT (pink), and wild-type PR8 IAVs (gray) at low multiplicity of infection (MOI, 0.001). (b) At 37 °C, all PB2 bioluminescent IAVs replicated productively, like wild-type PR8 IAV. (c) At 33 °C, all PB2 bioluminescent IAVs replicated productively, like wild-type PR8 IAV. (d,e) Multi-step growth kinetics of PA-N-HiBiT and PA-C-HiBiT (pink) and wild-type PR8 IAVs (gray) at low MOI (0.001). (d) At 37 °C, PA-N-HiBiT and PA-C-HiBiT replication were significantly less than wild-type IAV. *p < 0.05. (e) At 33 °C, PA-N-HiBiT and PA-C-HiBiT replication were significantly less than wild-type IAV. Data represent the mean ± SEM of results determined in 3 independent experiments, each performed in triplicate. The limit of detection was 10 PFU mL−1. *p < 0.05.
Figure 3
Figure 3
Functional stability of luciferase activity in bioluminescent IAVs after sequential passage. PB2-C-NanoLuc (blue) and PB2-N-HiBiT and PB2-C-HiBiT (pink) IAVs were sequentially passaged in MDCK cells at 37 °C. Each passaged IAV was serially diluted, and IAV luciferase activity was determined in MDCK cells at 12 h after inoculation. Stability of NanoLuc or HiBiT tag in PB2-C-NanoLuc, PB2-N-HiBiT, and PB2-C-HiBit was confirmed after 3–6 sequential passages of these IAVs in MDCK cells. RLU with NanoLuc substrate from MDCK cells infected with wild-type PR8 IAV (black) was plotted as a reference. Data reported as mean ± SD (N = 3). PFU plaque forming units, RLU relative luciferase units.
Figure 4
Figure 4
In vivo imaging of PB2-C-NanoLuc, PB2-N-HiBiT, and PB2-C-HiBiT IAVs. Female C57BL/6 mice aged 6 to 8 weeks were infected with 2000 PFU of wild-type PR8 or 20,000 PFU of PB2-C-NanoLuc, PB2-N-HiBiT, or PB2-C-HiBiT IAVs intranasally (2 mice per each virus). Luciferase substrates for PB2-C-NanoLuc or PB2-N-HiBiT and PB2-C-HiBiT were prepared and injected retro-orbitally for imaging. The mice were imaged using an in vivo imaging system (IVIS) and viral titers were determined in lung homogenates prepared from euthanized animals on day 6 post challenge. Black lines, mean values. (a) IVIS imaging from NanoLuc or HiBiT-LgBiT complex at 3 and 6 days post infection. Radiance, defined as the number of photons per s per square cm per steradian (p s−1 cm−2 sr−1), is shown on the heat maps. (b) In vitro viral titers in lung homogenates determined by plaque assay (PFU g−1). The limit of detection: nasal turbinates, 136 PFU g−1; trachea, 188 PFU g−1; lung, 65 PFU g−1. (c) In vitro viral titers in lung homogenates from PB2-N-HiBiT, or PB2-C-HiBiT IAV infected mice determined by luciferase assay on MDCK cells. The infected lung homogenates showed active luciferase signals, indicating that HiBiT peptide carried by IAVs caused luciferase activity when substrate and LgBiT protein were supplemented. The limit of detection in lung, 34,783 RLU (MDCK) g−1. PFU plaque forming units, RLU relative luciferase units.
Figure 5
Figure 5
Virulence of wild-type and PB2-C-NanoLuc PR8 IAVs in mice. Female C57BL/6 mice aged 6 to 8 week were infected intranasally with wild-type or PB2-C-NanoLuc PR8 IAV at various doses or no virus (mock) in sterile PBS and observed for 14 days. Body weight reported as percentage of initial body weight (mean ± SD). (a) Body weight in cohorts of mice given mock infection or infected with wild-type PR8 IAV. Body weight decreased initially in infected mice but increased after 7 days in mice infected with 20 or 200 PFU of wild-type IAV that survived. (b) Body weight change in cohorts of mice infected with PB2-C-NanoLuc PR8 IAV. Body weight decreased initially in infected mice but increased in mice infected with 20 or 200 PFU of PB2-C-NanoLuc IAV that survived beyond 7 to 9 days. (c) Survival in mice given mock infection or infected with wild-type PR8 IAV; 5 of 6 mice infected with 200 PFU (83%) died, and all 6 mice infected with 2000 PFU (100%) died within 9 days. The 50% mouse lethal dose (MLD50) of wild-type PR8 IAV was 95 PFU. (d) Survival in mice infected with PB2-C-NanoLuc PR8 IAV; 3 of 5 mice infected with 200 PFU (60%) died, and all 6 mice infected with 2000 PFU (100%) died within 8.5 days. The MLD50 of PB2-C-NanoLuc PR8 IAV was 160 PFU. Log-rank test showed no significant difference between survival curves from wild-type vs PB2-C-NanoLuc IAV at 200 PFU (p = 0.26) and 2000 PFU (p = 0.42). Time to loss of 25% of initial body weight was similar between mice challenged with wild-type (200 PFU, 7–8 days post infection; 2000 PFU, 5–9 days post infection) and PB2-C-NanoLuc PR8 IAV (200 PFU, 7–9 days post infection; 2000 PFU, 6–8.5 days post infection). PFU plaque forming units.
Figure 6
Figure 6
Real-time in vivo tracking of bioluminescent PB2-C-NanoLuc IAVs and spatiotemporal resolution of IAV replication kinetics in the mouse respiratory tract. (a) Bioluminescence from mice infected with PB2-C-NanoLuc IAV (2, 20, 200, or 2000 PFU) in the virulence study from 3 to 9 days after infection, expressed as radiance (p s−1 cm−2 sr−1). Each row of images was acquired longitudinally from 1 mouse. Differences in bioluminescence between mice were observed in the nasal turbinates (2000 PFU), trachea (200 PFU), and right or left lung (20 PFU). Imaging performed before mouse was euthanized because of loss of > 25% of initial body weight. (b) Replication kinetics of bioluminescent PB2-C-NanoLuc IAV in mice at different infection doses. Relative bioluminescence flux at each region was the bioluminescence photon flux normalized to the mean flux from 3 mock-infected mice at the nasal turbinates (3.0 × 103 ± 8.7 × 102 photons s−1), trachea (2.4 × 104 ± 3.6 × 103 photons s−1), lung (5.8 × 104 ± 7.4 × 103 photons s−1), and whole body including head and torso (1.2 × 105 ± 1.2 × 104 photons s−1). Additional measurements were done at 2 and 5 days after infection to fill gaps resulting from the limited retro-orbital administration of substrate. There were 1 to 7 mice imaged at each time, except that there were no surviving mice at 9 days after infection with 2000 PFU. Data are shown as truncated violin plots with median (line) and first and third quartiles (dashed lines). (c) Relative flux for each IAV dose from the nasal turbinates, trachea, lung, and whole-body (median ± 95% confidence interval). Body weight (mean ± SD) after infection with bioluminescent IAV was replotted from Fig. 5b to facilitate comparison of the time course of relative flux and body weight. The natural history of influenza viral infection and progression in animals included incubation (no body weight drop after infection), prodrome (initial body weight drop), invasion (rapid or continuous loss of body weight), and convalescence periods (gaining of body weight) and recovered healthy condition (steady status of body weight). The lethal phase (red points) was defined by the loss of more than 25% of initial body weight.
Figure 7
Figure 7
Correlation of in vitro measurements from tissue homogenates and in vivo bioluminescence from live mice. (a) In vitro measurements from plaque assay (PFU g−1), in vitro luciferase assay (RLU (Sup) g−1 and RLU (MDCK) g−1), and in vivo bioluminescence (relative flux) for infection with 200 and 2000 PFU. After infection with 200 or 2000 PFU, nasal turbinates, trachea, and lung were collected from 2 mice each at 3 and 5 days after infection. Additional tissues were harvested from 3 mice (200 PFU dose) and 6 mice (2000 PFU dose) which were moribund after terminal IVIS imaging. Mean values are connected by a line. *Mice that had no in vivo imaging because of severe dehydration and tachypnea. (b) Mean infectious viral titers (PFU g−1) from mouse lung homogenates vs time after infection with IAV at 200 or 2000 PFU. (c,d) Pearson correlation coefficient matrix for plaque assay (PFU g−1) and in vitro luciferase assay for supernatant (RLU (Sup) g−1) and MDCK cells (RLU (MDCK) g−1), and nonparametric Spearman correlation coefficient for flux (p s−1) from 63 measurements in different infectious dose groups and respiratory organs. p values are shown in Supplementary Table 1. Number of data for comparison: 2 PFU, 12 data; 20 PFU, 12 data; 200 PFU, 18 data; 2000 PFU, 21 data; nasal turbinates, trachea, and lung, each 21 mice. PFU plaque forming units, RLU relative luciferase units, Sup supernatant.
Figure 8
Figure 8
Linear detection range of PB2-C-NanoLuc IAV. Results reported as mean ± SD relative luciferase units (RLU) for triplicate measurements. (a) Linear detection range of PB2-C NanoLuc IAV in MDCK cells. Serially diluted samples (25 μL each) of wild-type or PB2-C-NanoLuc IAV were inoculated onto MDCK cells in white 96-well plates. At 12 h after inoculation, equal volume of luciferase substrate (80 μL) was added and luminescence was measured from MDCK cells and supernatant combined. There was strong correlation between measured luciferase activity vs infectious IAV titer from 101 to 104 PFU per 25 μL of inoculum (r2, 0.995; p < 0.0001). (b) Comparison of luciferase activity between MDCK cells and supernatants of MDCK cultures infected with PB2-C-NanoLuc IAV. To determine the source of the luciferase activity in the infected MDCK cultures, we separated MDCK cells and culture supernatants and measured the luciferase activity separately. At 12 h after inoculation of wild-type or PB2-C-NanoLuc IAV onto MDCK cells, luciferase activity was measured from MDCK cells and supernatant combined (squares; same method as in (a)), MDCK cells only (triangles; replacing with 80 μL PBS before adding 80 μL substrate), and supernatant only (upside-down triangles; adding 80 μL substrate); sum of data from MDCK only and supernatant only (circles). Within the linear range of detection (101–104 PFU per 25 μL inoculum), the luciferase activity from MDCK cells and supernatants combined was most comparable to that from MDCK cells alone. (c) Linear detection range of PB2-C NanoLuc IAV in supernatants. Luciferase activity of serially diluted 80 μL of wild-type or PB2-C-NanoLuc IAV was measured without infection to MDCK cells (same method of supernatant only as in (b)). Luciferase activity correlated with IAV PFU concentration linearly at PFU > 103 per 80 μL supernatant (r2, 0.999; p < 0.0001). (d) Stocks of wild-type and PB2-C-NanoLuc IAV were filtered (100 kDa cutoff), and the retentates and filtrates were adjusted to the original volume (1 mL) and analyzed via luciferase assay and Western blot for PB2 and nucleoprotein (NP) as a marker for the presence of IAV. Cropped blots are displayed. Full-length blots are presented in Supplementary Fig. 9c.
Figure 9
Figure 9
In vitro measurements on BALF samples to compare plaque vs luciferase assay. BALF was collected during the terminal procedure from 1 mouse or 2 mice at each inoculation dose (2, 20, 200, or 2000 PFU) of IAV and evaluated with in vitro plaque assay (PFU mL−1) and luciferase assay on supernatant (RLU (Sup) g−1), and MDCK cells (RLU (MDCK) g−1). Mean, black line. Hollow circles indicate measurements that were below the limit of detection of BALF samples for plaque assay (15 PFU mL−1) or luciferase assay on supernatant (625 RLU (Sup) mL−1) or MDCK cells (8000 RLU (MDCK) mL−1). PFU plaque forming units, RLU relative luciferase units, Sup supernatant.

Similar articles

Cited by

References

    1. Iuliano AD, et al. Estimates of global seasonal influenza-associated respiratory mortality: A modelling study. Lancet. 2018;391:1285–1300. - PMC - PubMed
    1. Centers for Disease Control and Prevention, National Center for Immunization and Respiratory Diseases. CDC Seasonal Flu Vaccine Effectiveness Studies. Centers for Disease Control and Prevention. https://www.cdc.gov/flu/vaccines-work/effectiveness-studies.htm (Accessed 5 August 2021).
    1. Heaton NS, et al. In vivo bioluminescent imaging of influenza A virus infection and characterization of novel cross-protective monoclonal antibodies. J. Virol. 2013;87:8272–8281. - PMC - PubMed
    1. Czakó R, et al. In vivo imaging of influenza virus infection in immunized mice. MBio. 2017;8:e00714–e00717. - PMC - PubMed
    1. Karlsson EA, et al. Visualizing real-time influenza virus infection, transmission and protection in ferrets. Nat. Commun. 2015;6:6378. - PMC - PubMed

Publication types