. 2022 Feb 24;12(1):3162.
doi: 10.1038/s41598-022-06861-w.

Experienced entropy drives choice behavior in a boring decision-making task

Affiliations

Experienced entropy drives choice behavior in a boring decision-making task

Johannes P-H Seiler et al. Sci Rep. .

Abstract

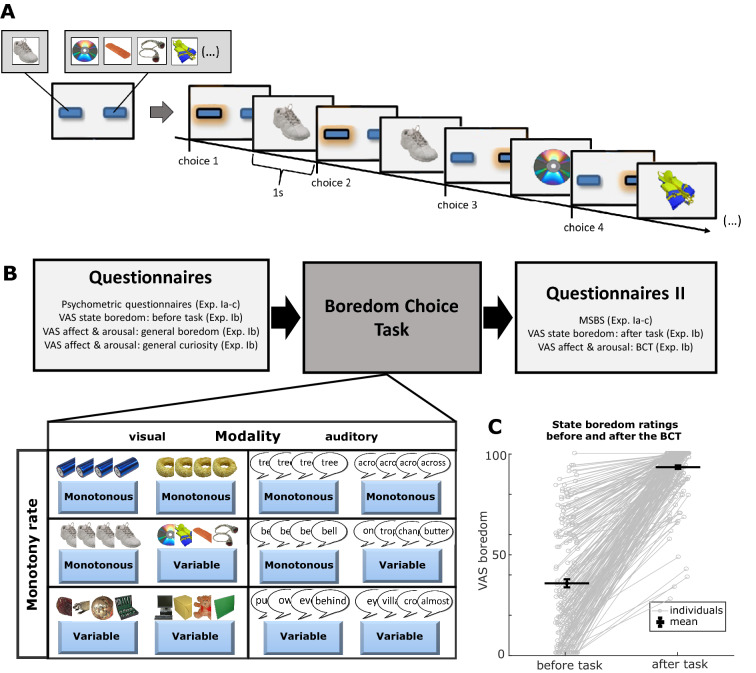
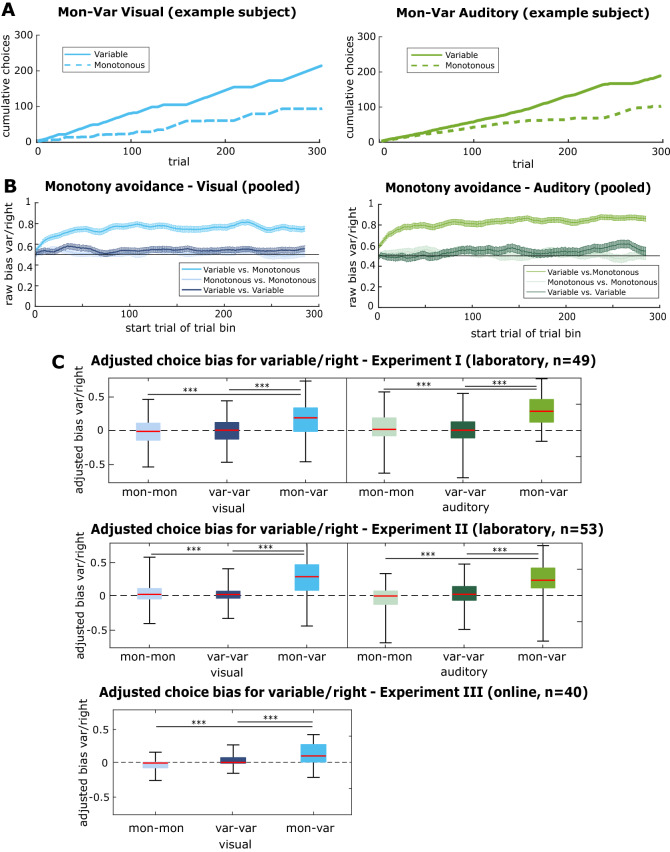
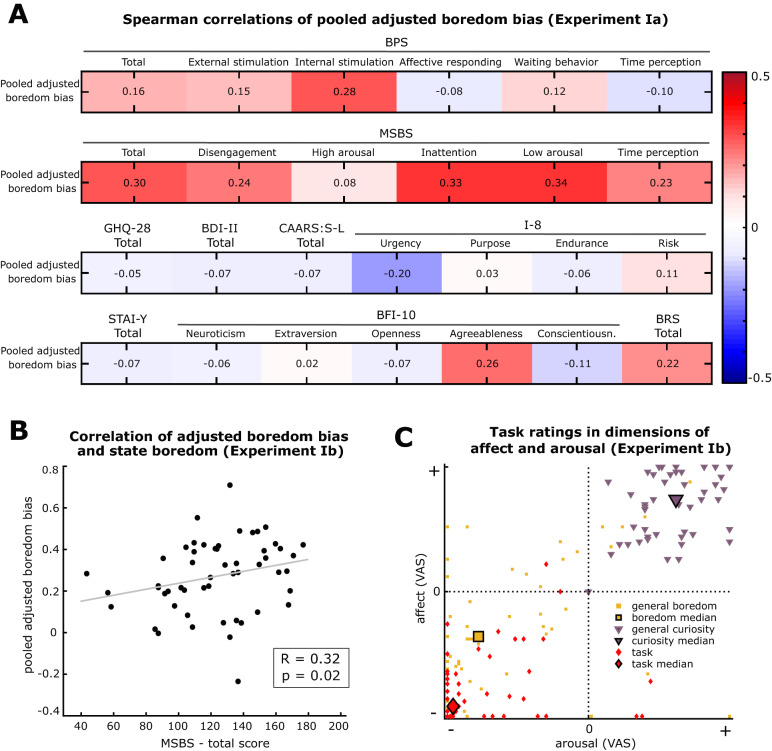
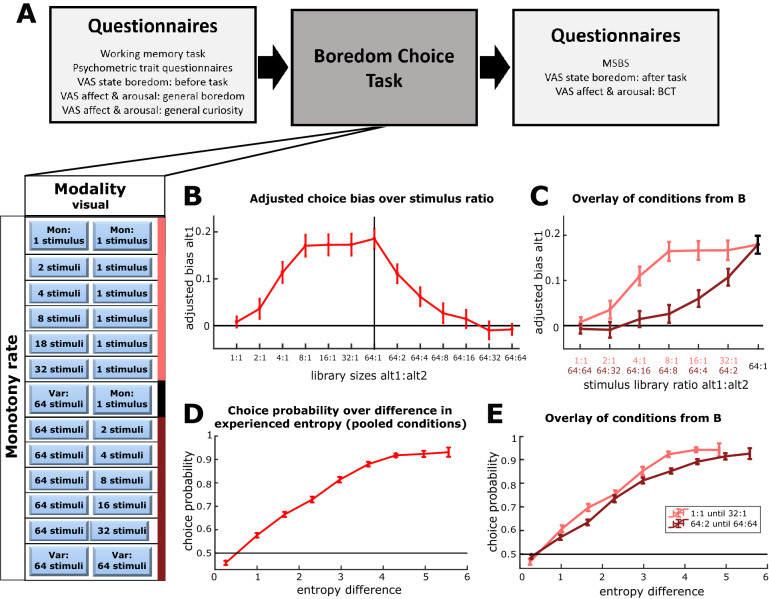
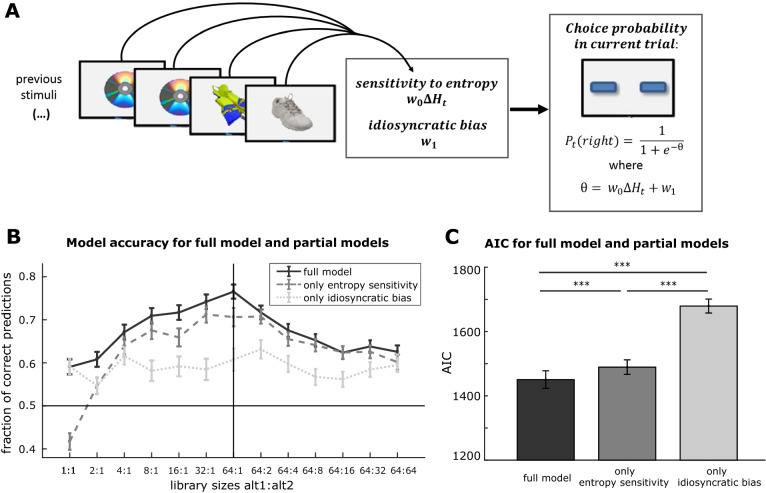
Boredom has been defined as an aversive mental state that is induced by the disability to engage in satisfying activity, most often experienced in monotonous environments. However, current understanding of the situational factors inducing boredom and driving subsequent behavior remains incomplete. Here, we introduce a two-alternative forced-choice task coupled with sensory stimulation of different degrees of monotony. We find that human subjects develop a bias in decision-making, avoiding the more monotonous alternative that is correlated with self-reported state boredom. This finding was replicated in independent laboratory and online experiments and proved to be specific for the induction of boredom rather than curiosity. Furthermore, using theoretical modeling we show that the entropy in the sequence of individually experienced stimuli, a measure of information gain, serves as a major determinant to predict choice behavior in the task. With this, we underline the relevance of boredom for driving behavioral responses that ensure a lasting stream of information to the brain.


Conflict of interest statement

The authors declare no competing interests.

Figures

Figure 1
Figure 1
Concept of the Boredom Choice Task: (A) Trial structure of the paradigm and example sequence of choices and stimulus presentations in the monotonous vs. variable condition, where the monotonous alternative in this example is located left. The shaded buttons represent the currently chosen options. (B) Schematic of the procedure, illustrating six basic task conditions (monotonous vs. variable, monotonous vs. monotonous, variable vs. variable in visual and auditory modality). Images are examples from the visual stimulus libraries taken from the Bank of Standardized Stimuli,. The structure of the experiments involved the BCT and various self-report questionnaires to assess boredom (BPS, MSBS, VAS-B), personality traits and symptoms of mental disorders (GHQ-28, CAARS-S:L, BDI-II, BFI-10, I-8, STAI-Y, BRS) as well as affect and arousal for imagined states of boredom, curiosity and the BCT (VAS-AA). (C) Visual analog state boredom ratings (VAS-B) before starting and after completing the Boredom Choice Task. Connected grey circles reflect the ratings of each individual (n = 201 participants). The horizontal bars reflect the average over all subjects and the vertical bars indicate the standard error of the mean. The boredom ratings after the task are significantly higher compared to the prior condition (p < 0.001 in a Wilcoxon signed rank test).
Figure 2
Figure 2
Boredom bias of monotony avoidance in the Boredom Choice Task: (A) Choice behavior of one exemplary subject in the visual and auditory monotonous vs. variable (Mon–Var) BCT cycle. The cumulative number of choices for either alternative is plotted over the respective trial. (B) Average raw boredom bias of all participants from Experiment Ia-c (n = 142 participants for visual modality, n = 102 participants for auditory modality) over the duration of each task cycle across all conditions. The raw boredom bias is computed in a bin of 15 trials (first bin: trial 1–15) which is then shifted stepwise until the end of the task (last bin: trial 286–300). The vertical bars indicate the standard error of the mean. (C) Boxplots with the distributions of the adjusted boredom bias for Experiment Ia (n = 49 participants), Ib (n = 53 participants) and Ic (n = 40 participants). The red line indicates the median, the box indicates the upper and lower 25% quantiles and the whiskers indicate the 50% quantiles around the median. Blue colors reflect visual task cycles, whereas green colors represent auditory task cycles. In all experiments the Mon–Var distributions were significantly different from a mean of zero (***p < 0.001 in one-sample t tests).
Figure 3
Figure 3
Construct validation of the Boredom Choice Task: (A) Exploratory investigation of the Spearman correlations between the pooled adjusted boredom bias and the diverse psychometric self-reports (BPS Boredom Proneness Scale, MSBS Multidimensional State Boredom Scale, GHQ-28 General Health Questionnaire, BDI-II Beck’s Depression Inventory, CAARS:S-L Conner’s Adult ADHD Rating Scale, I-8 Impulsivity Questionnaire, STAI-Y State Trait Anxiety Inventory, BFI-10 Big Five Inventory, BRS Brief Resilience Scale). Each correlation is computed over n = 49 participants from Experiment Ia. The color of each cell displays the magnitude of correlation (R-value). (B) Specific correlation analysis with the independent data from Experiment Ib: The scatter plot illustrates the relationship between the pooled adjusted boredom bias of each participant and the corresponding MSBS state boredom report (n = 53 participants; Spearman’s R = 0.32, p = 0.02). The grey line indicates the best linear fit. (C) Scatter plot of participants’ visual analog scale (VAS) ratings of affect and arousal for imagined boredom (yellow), imagined curiosity (violet) and the BCT experience (red) (n = 53 participants from Experiment Ib). The large markers indicate the overall median of each condition.
Figure 4
Figure 4
Boredom bias at varied degrees of monotony and its link to empirical entropy: (A) Procedure of Experiment II and the corresponding stimulus library ratios of each task cycle. Subjects underwent all 13 conditions in a randomized order. (B) The average adjusted boredom bias is computed over all subjects from Experiment II (n = 148) for each of the 13 stimulus library pairings. The vertical bars indicate the standard error of the mean. (C) The same adjusted boredom bias data from B is plotted over the ratio of stimulus libraries with both sides of the previous plot (1:1 to 32 and 64:64 to 2) overlaid. Here, both sets of conditions show an incongruent shape, despite equivalent library ratios. (D) Average probability of choice for one alternative presented over the previously experienced difference in entropy for this alternative. Thereby, entropy difference and the consecutive choice probability is computed for all trials in all BCT cycles of each subject’s (99 choices per 13 cycles resulting in 1287 pairs of data per subject). For negative values of entropy difference, the data pairs are inverted, leading to only positive values of entropy difference. Next, the data pairs of each subject are sorted into 9 equally spaced bins in the range of [0, 6] according to their entropy difference value and choice probability is computed over the choice data of each bin. Finally, the binned entropy difference and choice probability are averaged over all 148 subjects, leading to the plotted curve. The bars indicate the standard error of the mean (horizontal bars are vanishingly small). (E) In analogy to D, the entropy difference and consecutive choice probability is computed for each trial, where the data is grouped into two sets of different task conditions that in C showed high divergence (1:1 to 32:1 versus 64:2 to 64:64). In line with the previous procedure, we analyze entropy difference and the consecutive choice for each subject in the two sets of conditions (99 trials per 6 cycles resulting in 594 data pairs for each condition set). For negative values of entropy difference, the data pairs are inverted, leading to only positive values of entropy difference. For each subject the data is sorted into 9 evenly equally spaced bins in the range of [0, 6] according to the experienced entropy difference and the choice probability is calculated for each bin. The individual data of all 148 participants is then averaged leading to the plotted curves. Different from (C), both sets of conditions show a widely congruent relationship between experienced entropy difference and consecutive choice probability.
Figure 5
Figure 5
A logistic regression model to explain decision-making in the BCT: (A) Schematic explanation of the model and how its parameters are derived from participants’ experience: (i) sensitivity to entropy describes how strongly the experienced entropy difference impacts the consecutive choice, and (ii) idiosyncratic bias describes a general bias for one alternative. Images are examples from the visual stimulus libraries taken from the Bank of Standardized Stimuli,. (B) Average fraction choices that are correctly predicted by the model over the different BCT conditions, where three models are independently fit to the choice data and their predictions are compared (each line presents the average over n = 148 participants, vertical bars indicate the standard error of the mean): (i) the full model with two parameters, (ii) a partial model with only sensitivity to entropy and (iii) a partial model with only idiosyncratic bias. The accuracy of the full model is found to strongly depend on the parameter of entropy sensitivity, where this parameter increases its predictive power as the difference between both alternatives is raised. The idiosyncratic bias on the other hand has a smaller impact on choice predictions that is widely independent from the stimulus libraries of the task. (C) Comparison of the model goodness measured as Akaike’s Information Criterion (AIC) between the full regression model and partial models with only one parameter (each bar spans the data from n = 148 participants, vertical bars indicate the standard error of the mean). Smaller AIC values indicates a better model. All partial models (only entropy sensitivity and only idiosyncratic bias) show a decreased goodness of fit in comparison to the full model (***: one-tailed Wilcoxon signed rank tests with p < 0.001). Furthermore, the model with only entropy sensitivity performs better than the model with only idiosyncratic bias (***: one-tailed Wilcoxon signed rank test with p < 0.001), indicating that entropy sensitivity is an important determinant of the following choice probability in the BCT.

References

    1. Eastwood JD, Frischen A, Fenske MJ, Smilek D. The unengaged mind: Defining boredom in terms of attention. Perspect. Psychol. Sci. 2012;7:482–495. doi: 10.1177/1745691612456044. - DOI - PubMed
    1. Cummings ML, Gao F, Thornburg KM. Boredom in the workplace: A new look at an old problem. Hum. Factors. 2016;58:279–300. doi: 10.1177/0018720815609503. - DOI - PubMed
    1. Yazzie-Mintz, E. Charting the Path from Engagement to Achievement: A Report on the 2009 High School Survey of Student Engagement (Indiana University Center for Evaluation and Education Policy (CEEP), 2010).
    1. Kompanje EJO. Burnout, boreout and compassion fatigue on the ICU: It is not about work stress, but about lack of existential significance and professional performance. Intensive Care Med. 2018;44:690–691. doi: 10.1007/s00134-018-5083-2. - DOI - PubMed
    1. Sundberg ND, Latkin CA, Farmer RF, Saoud J. Boredom in young adults. Gend. Cult. Comp. 1991;22:209–223. doi: 10.1177/0022022191222003. - DOI

Publication types