. 2022 Feb 24;12(1):3114.
doi: 10.1038/s41598-022-06873-6.

Improving the efficiency and effectiveness of an industrial SARS-CoV-2 diagnostic facility

Affiliations

Improving the efficiency and effectiveness of an industrial SARS-CoV-2 diagnostic facility

Julie A Douthwaite et al. Sci Rep. .

Abstract

On 11th March 2020, the UK government announced plans for the scaling of COVID-19 testing, and on 27th March 2020 it was announced that a new alliance of private sector and academic collaborative laboratories were being created to generate the testing capacity required. The Cambridge COVID-19 Testing Centre (CCTC) was established during April 2020 through collaboration between AstraZeneca, GlaxoSmithKline, and the University of Cambridge, with Charles River Laboratories joining the collaboration at the end of July 2020. The CCTC lab operation focussed on the optimised use of automation, introduction of novel technologies and process modelling to enable a testing capacity of 22,000 tests per day. Here we describe the optimisation of the laboratory process through the continued exploitation of internal performance metrics, while introducing new technologies including the Heat Inactivation of clinical samples upon receipt into the laboratory and a Direct to PCR protocol that removed the requirement for the RNA extraction step. We anticipate that these methods will have value in driving continued efficiency and effectiveness within all large scale viral diagnostic testing laboratories.


Conflict of interest statement

The authors declare no competing interests.

Figures

Figure 1
Figure 1
Standard laboratory process showing the journey of a sample from bio-sampling to result. Purified SARS Cov-2 RNA from clinical swab samples is detected by RT-qPCR targeting the ORF1ab gene. Flow diagram at the top describes each step; the internal laboratory procedure shown in purple, and the external processes in green. The time recorded for each step to occur is highlighted in orange. Definition of the Laboratory Information Management System (LIMS) timestamps described in this manuscript are outlined in the white boxes.
Figure 2
Figure 2
Direct to PCR (D2PCR) concordance data. (a) Cq values for samples tested as positive in both D2PCR and standard assay, showing typical increase of 2–4 Cq units with D2PCR. (b) Concordance of test results. Samples which tested positive in either the standard assay or the D2PCR assay binned depending on the standard assay Cq. Graph indicates the number of samples tested and the concordance by Cq bin. (c) Lab TAT for standard assay (including RNA extraction) compared to D2PCR. For standard test all test results generated within March 2021 are shown, for D2PCR all data from a trial run over 3 days is shown. P value calculated using Wilcox test. (d) Lab TAT for D2PCR, comparing Heat Inactivation during the lab process (via thermal cycler) with Heat Inactivation prior to lab entry. P value calculated using Wilcox test. Figure prepared using R with ggplot2 v 3.3.2 [CRAN—Package ggplot2 (r-project.org)].
Figure 3
Figure 3
Using informatics dashboards to improve process efficiency in Sample Preparation. (a) Each point represents a single microplate where the x axis describes creation time within LIMS and y axis the total time spent within the Sample Preparation step. Grey points are before the introduction of the in-lab dashboard; Black points are post introduction. Blue line is a regression calculated using a generalized additive model with the SE shown. (b) Box plot of data from (a). P value from Wilcox test. Figure prepared using R with ggplot2 v 3.3.2 [CRAN—Package ggplot2 (r-project.org)].
Figure 4
Figure 4
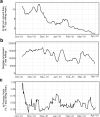
Lab TAT, samples processed, and quality control of the CCTC from October 2020–March 2021. (a) 7-day rolling mean of the lab TAT. (b) 7-day rolling mean of the total daily sample number processed. (c) 7-day rolling mean of the in-process voids within the lab. Figure prepared using R with ggplot2 v 3.3.2 [CRAN—Package ggplot2 (r-project.org)].
Figure 5
Figure 5
Evolution of the CCTC laboratory process. Evolution from initial standard process to fully optimised (incorporating both Heat Inactivation upon receipt and D2PCR format). Key changes from the initial process are shown in grey boxes—including physical laboratory steps along with alignment of data QC tools and continuous Operational informatics analysis.

References

    1. WHO. WHO Director-General's opening remarks at the media briefing on COVID-19—11 March 2020, https://www.who.int/director-general/speeches/detail/who-director-genera... (2020).
    1. Li R, et al. Substantial undocumented infection facilitates the rapid dissemination of novel coronavirus (SARS-CoV-2) Science. 2020;368:489–493. doi: 10.1126/science.abb3221. - DOI - PMC - PubMed
    1. Shim E, Tariq A, Choi W, Lee Y, Chowell G. Transmission potential and severity of COVID-19 in South Korea. Int. J. Infect. Dis. 2020;93:339–344. doi: 10.1016/j.ijid.2020.03.031. - DOI - PMC - PubMed
    1. Gudbjartsson DF, et al. Spread of SARS-CoV-2 in the Icelandic population. N. Engl. J. Med. 2020;382:2302–2315. doi: 10.1056/NEJMoa2006100. - DOI - PMC - PubMed
    1. Geoghegan JL, et al. Genomic epidemiology reveals transmission patterns and dynamics of SARS-CoV-2 in Aotearoa New Zealand. Nat. Commun. 2020;11:1–7. doi: 10.1038/s41467-020-20235-8. - DOI - PMC - PubMed