. 2022 Feb 24;12(1):3183.
doi: 10.1038/s41598-022-07034-5.

Cross-institutional outcome prediction for head and neck cancer patients using self-attention neural networks

Affiliations

Cross-institutional outcome prediction for head and neck cancer patients using self-attention neural networks

William Trung Le et al. Sci Rep. .

Abstract

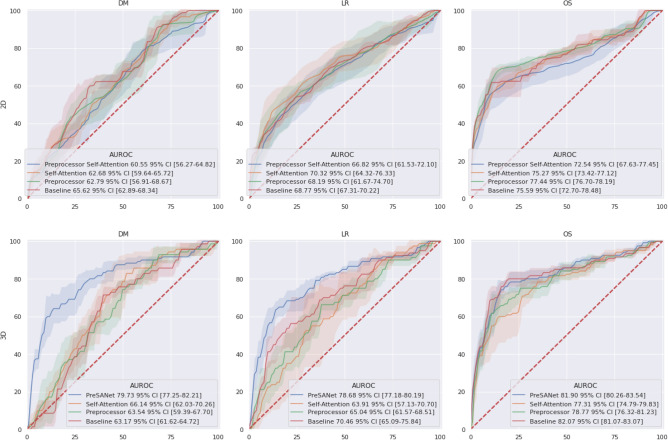
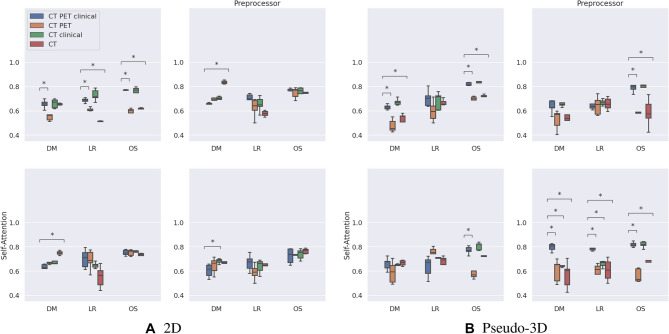
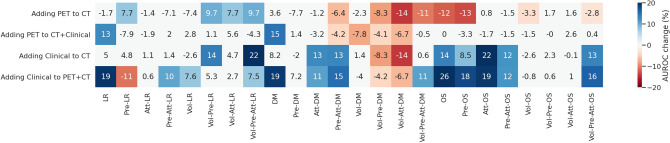
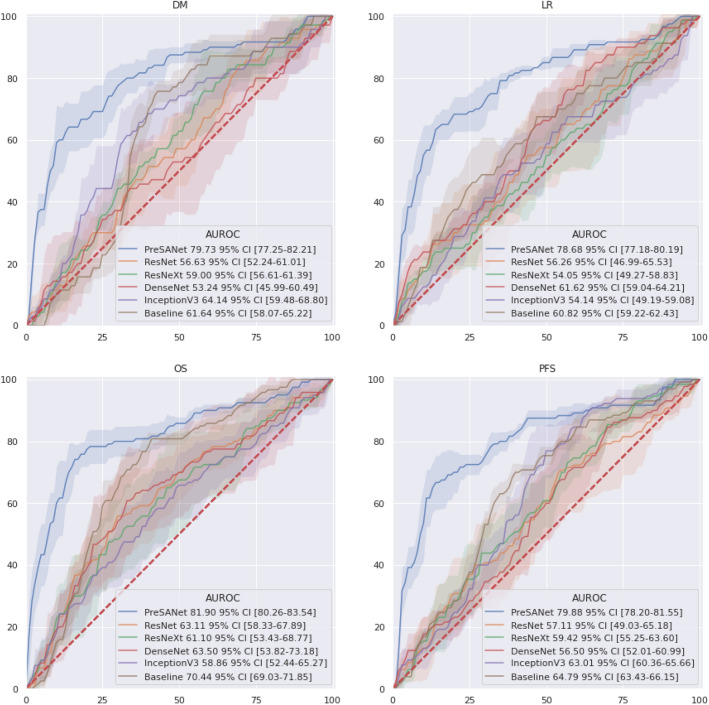
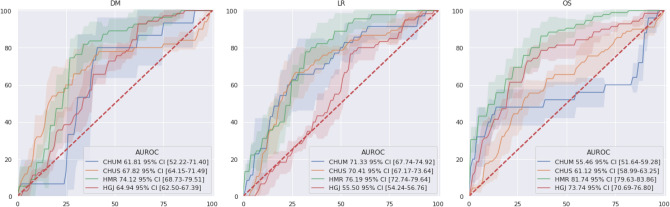
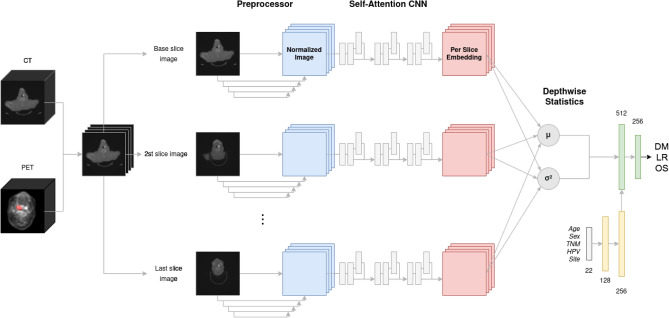
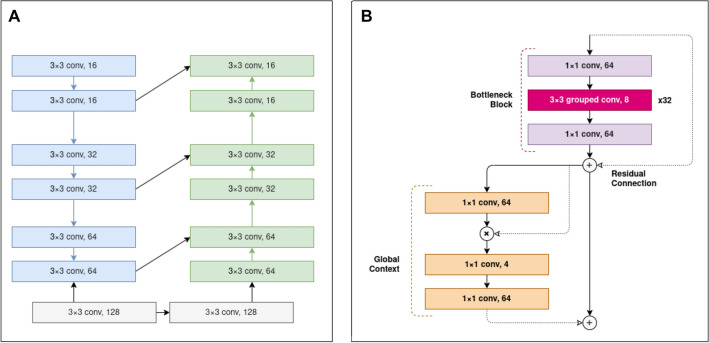
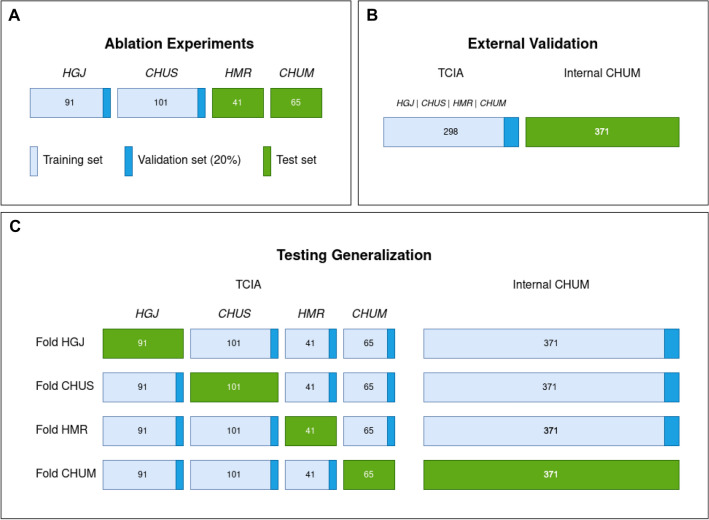
In radiation oncology, predicting patient risk stratification allows specialization of therapy intensification as well as selecting between systemic and regional treatments, all of which helps to improve patient outcome and quality of life. Deep learning offers an advantage over traditional radiomics for medical image processing by learning salient features from training data originating from multiple datasets. However, while their large capacity allows to combine high-level medical imaging data for outcome prediction, they lack generalization to be used across institutions. In this work, a pseudo-volumetric convolutional neural network with a deep preprocessor module and self-attention (PreSANet) is proposed for the prediction of distant metastasis, locoregional recurrence, and overall survival occurrence probabilities within the 10 year follow-up time frame for head and neck cancer patients with squamous cell carcinoma. The model is capable of processing multi-modal inputs of variable scan length, as well as integrating patient data in the prediction model. These proposed architectural features and additional modalities all serve to extract additional information from the available data when availability to additional samples is limited. This model was trained on the public Cancer Imaging Archive Head-Neck-PET-CT dataset consisting of 298 patients undergoing curative radio/chemo-radiotherapy and acquired from 4 different institutions. The model was further validated on an internal retrospective dataset with 371 patients acquired from one of the institutions in the training dataset. An extensive set of ablation experiments were performed to test the utility of the proposed model characteristics, achieving an AUROC of [Formula: see text], [Formula: see text] and [Formula: see text] for DM, LR and OS respectively on the public TCIA Head-Neck-PET-CT dataset. External validation was performed on a retrospective dataset with 371 patients, achieving [Formula: see text] AUROC in all outcomes. To test for model generalization across sites, a validation scheme consisting of single site-holdout and cross-validation combining both datasets was used. The mean accuracy across 4 institutions obtained was [Formula: see text], [Formula: see text] and [Formula: see text] for DM, LR and OS respectively. The proposed model demonstrates an effective method for tumor outcome prediction for multi-site, multi-modal combining both volumetric data and structured patient clinical data.


Conflict of interest statement

The authors declare no competing interests

Figures

Figure 1
Figure 1
ROC curves for the proposed PreSANet model with different feature ablation. Rows represent the baseline 2D and the proposed pseudo-3D architectures. Figures presented are mean AUC [95% CI] over 5 trials. Training and validation split used is shown in Fig. 8A. Figure created with seaborn/matplotlib v0.11.2 (seaborn.pydata.org).
Figure 2
Figure 2
Ablation AUROC results for the proposed PreSANet model. Subfigure grids represent ablations of the Preprocessor and self-attention features for the (A) 2D variant, and (B) pseudo-volumetric variant. Within each sub-figure, the combination of input imaging and clinical modalities are presented. Figures presented are mean performance over 5 repeated trials with error bars representing 95% CI. Stars indicate statistical significance using the dependent t-test for paired samples with Bonferroni correction, with the number of stars indicating: (1) p<0.05, (2) p<0.01, (3) p<0.001, (4) p<0.0001. Each modality combination is compared with the proposed model that uses CT image, PET image and clinical data as inputs. Training and validation split employed matched the one presented by Vallieres et al.. Figure created with seaborn/matplotlib v0.11.2 (seaborn.pydata.org)
Figure 3
Figure 3
Effect of adding clinical data or PET images combined to the baseline CT. Columns represent different architectures used in the ablation experiments, for each of the predicted targets. Figures are percentage change in mean AUROC with the addition of the indicated modality to the indicated base modalities. Figures and colors represent the effect size for cases where a statistical significance was found (p value < 0.05). Squares in white indicate no statistically significant difference was found. Figure created with seaborn/matplotlib v0.11.2 (seaborn.pydata.org)
Figure 4
Figure 4
ROC curves for the proposed PreSANet model compared with previous works and off-the-shelf models. Figures presented are mean AUC [95% CI] over 5 trials. Training and validation split used is shown in Fig. 8A. Figure created with seaborn/matplotlib v0.11.2 (seaborn.pydata.org)
Figure 5
Figure 5
ROC curves for the proposed PreSANet evaluated in a single-site cross-validation. Figures presented are mean AUC [95% CI] over 5 trials. Training and validation used is shown in Fig. 8C. Figure created with seaborn/matplotlib v0.11.2 (seaborn.pydata.org).
Figure 6
Figure 6
Proposed PreSANet deep learning architecture for radiotherapy outcome prediction. The convolutional backbones consist of the combination of the preprocessor module and the self-attention CNN feature extractor. Using shared weights, each of the two channel (PET, CT) input volume is split into individual slices passed to the backbone. The resulting per-slice feature vectors are aggregated using mean and variance into two 256-feature vectors. They are then concatenated with the outputs of a fully connected network component (yellow) that processes the clinical input data forming a 768 feature vector. Figure created with Draw.io
Figure 7
Figure 7
Details of the convolutional backbones of the proposed PreSANet model. (A) Preprocessor sub-module consisting of a downsampling and upsampling branch with skip connections taking a 2D image as input and returning a normalized 2D image as output. (B) Convolutional blocks in the feature extractor module consist of a residual bottleneck unit with depthwise-separable group convolutions followed by a global context unit. Every bottleneck unit outputs four times as many channels as it takes at its input, using 32 grouped convolutions with a 3×3 kernel. Downsampling is performed in the middle layer of the bottleneck block using a stride of 2. Residual skip connections sum the input of the bottleneck block into its output. Self-attention is modelled with a context-modelling layer using an element-wise product. The residual addition of an attention map to the output of each block allows the model to process global context and attend salient parts of the image. Figure created with Draw.io
Figure 8
Figure 8
Data splitting strategies for model evaluation. The mean performance is reported across all five folds. (A) The training set are samples originating from CHUS and HGJ, with 20% held out as a validation set. The test set is composed of samples from CHUM and HMR. This split is used for ablation experiments as well as comparison to previous literature. (B) 5-fold cross-validation over the entire dataset. This split is used to evaluate the novel Internal CHUM dataset. (C) Hold-one-institution-out cross-validation strategy where each source institution is held as a test set with the remaining samples used for training and validation. This split is used to test cross-institution generalization. Figure created with Draw.io

References

    1. Delaney G, Jacob S, Featherstone C, Barton M. The role of radiotherapy in cancer treatment: Estimating optimal utilization from a review of evidence-based clinical guidelines. Cancer Interdiscip. Int. J. Am. Cancer Soc. 2005;104:1129–1137. - PubMed
    1. Begg AC, Stewart FA, Vens C. Strategies to improve radiotherapy with targeted drugs. Nat. Rev. Cancer. 2011;11:239–253. doi: 10.1038/nrc3007. - DOI - PubMed
    1. Barton MB, Delaney GP. A decade of investment in radiotherapy in new south wales: Why does the gap between optimal and actual persist? J. Med. Imaging Radiat. Oncol. 2011;55:433–441. doi: 10.1111/j.1754-9485.2011.02292.x. - DOI - PubMed
    1. Atun R, et al. Expanding global access to radiotherapy. Lancet Oncol. 2015;16:1153–1186. doi: 10.1016/S1470-2045(15)00222-3. - DOI - PubMed
    1. Kayalibay, B., Jensen, G. & van der Smagt, P. CNN-based segmentation of medical imaging data. arXiv preprintarXiv:1701.03056 (2017).

Publication types

MeSH terms

Substances