. 2022 Mar;24(3):384-399.
doi: 10.1038/s41556-022-00850-x. Epub 2022 Feb 24.

EZH2 noncanonically binds cMyc and p300 through a cryptic transactivation domain to mediate gene activation and promote oncogenesis

Affiliations

EZH2 noncanonically binds cMyc and p300 through a cryptic transactivation domain to mediate gene activation and promote oncogenesis

Jun Wang et al. Nat Cell Biol. 2022 Mar.

Abstract

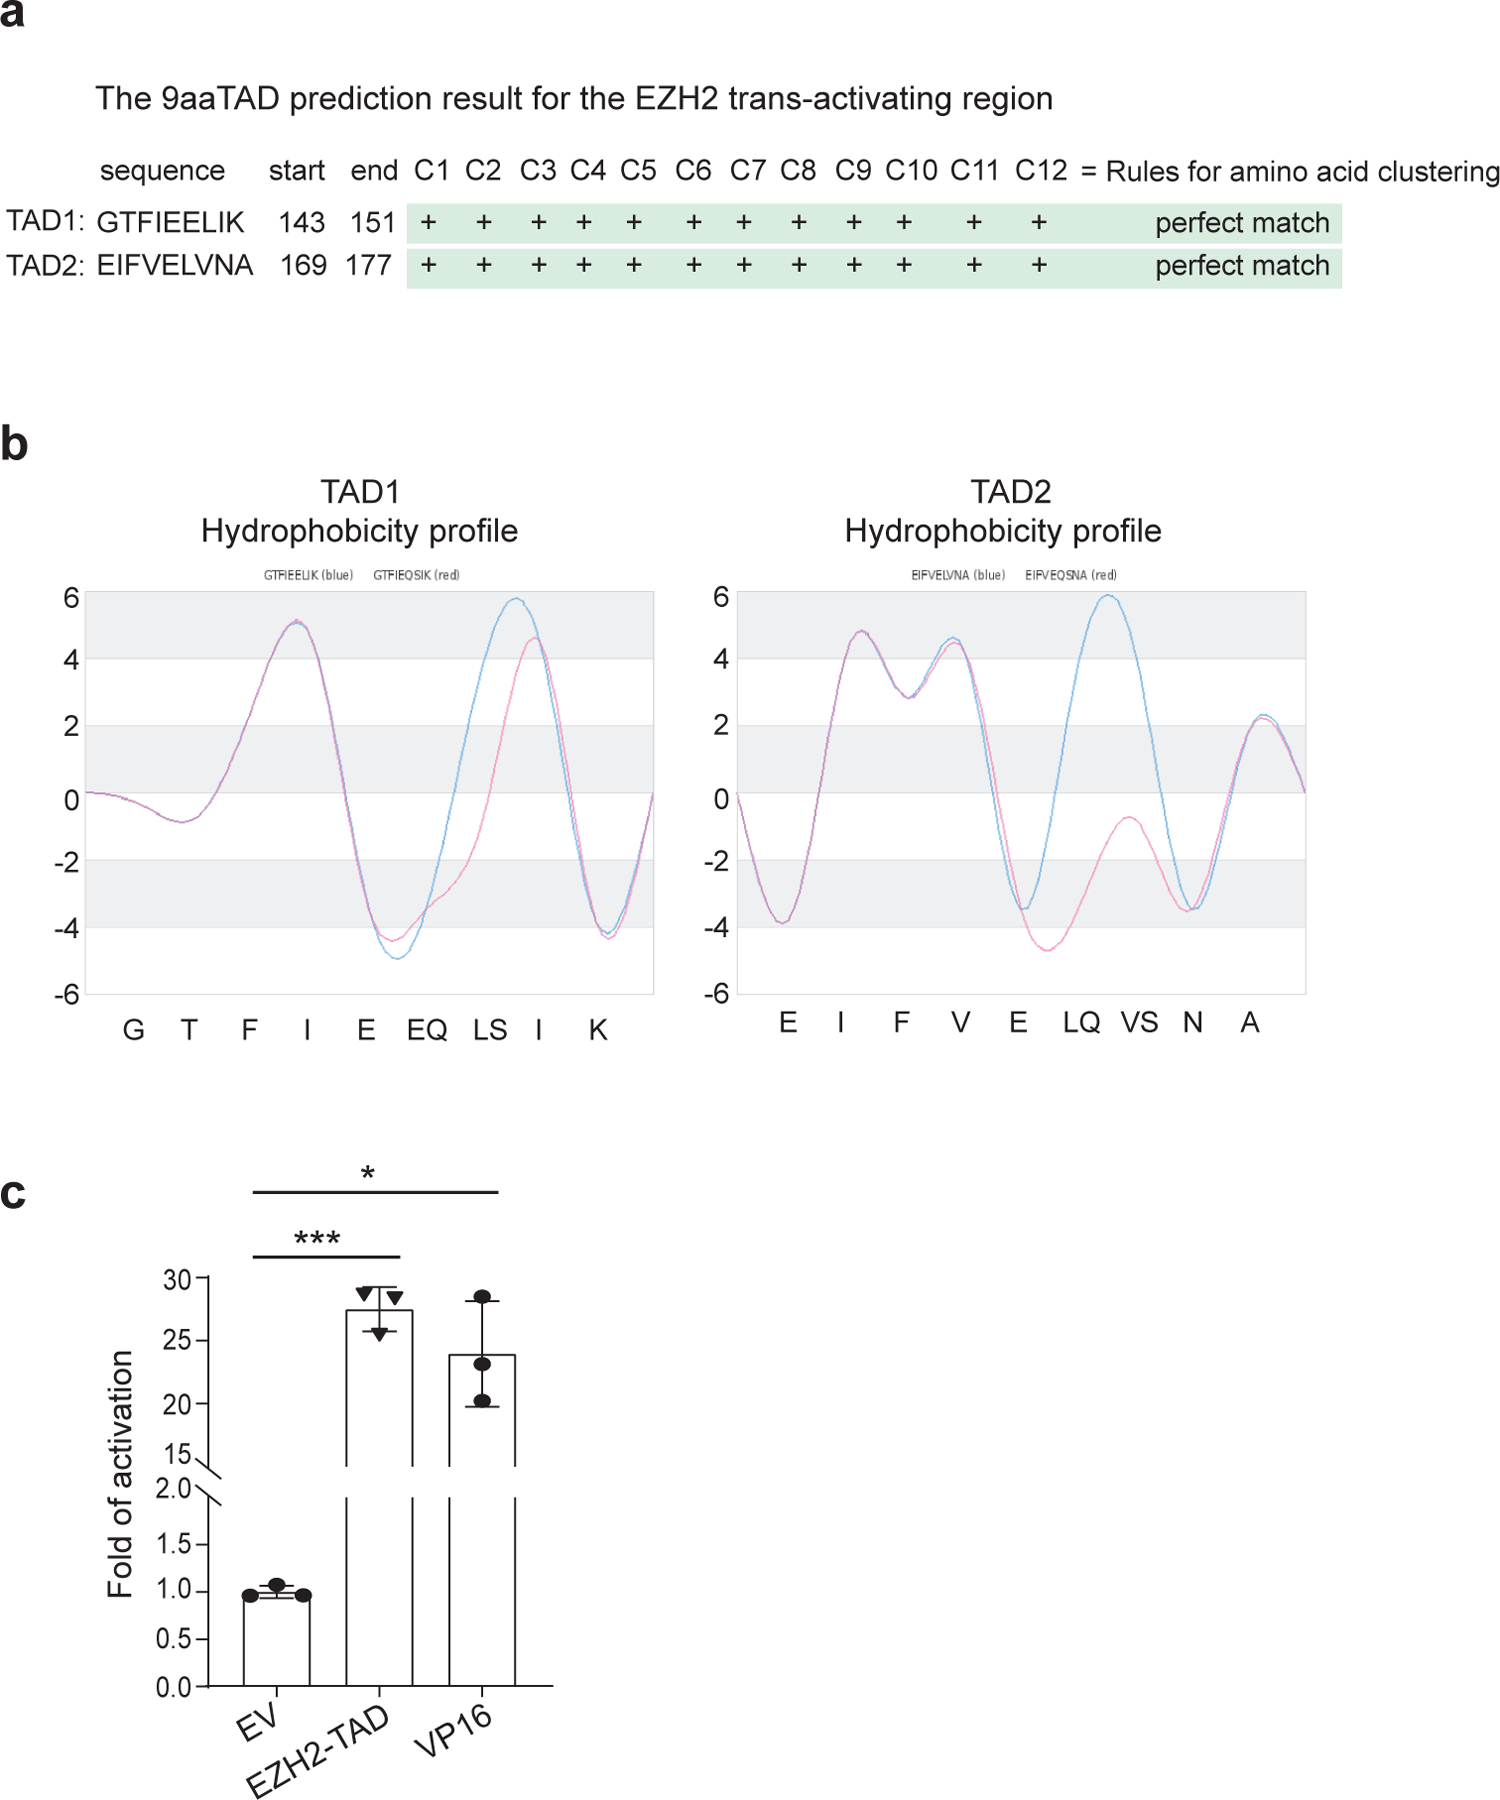
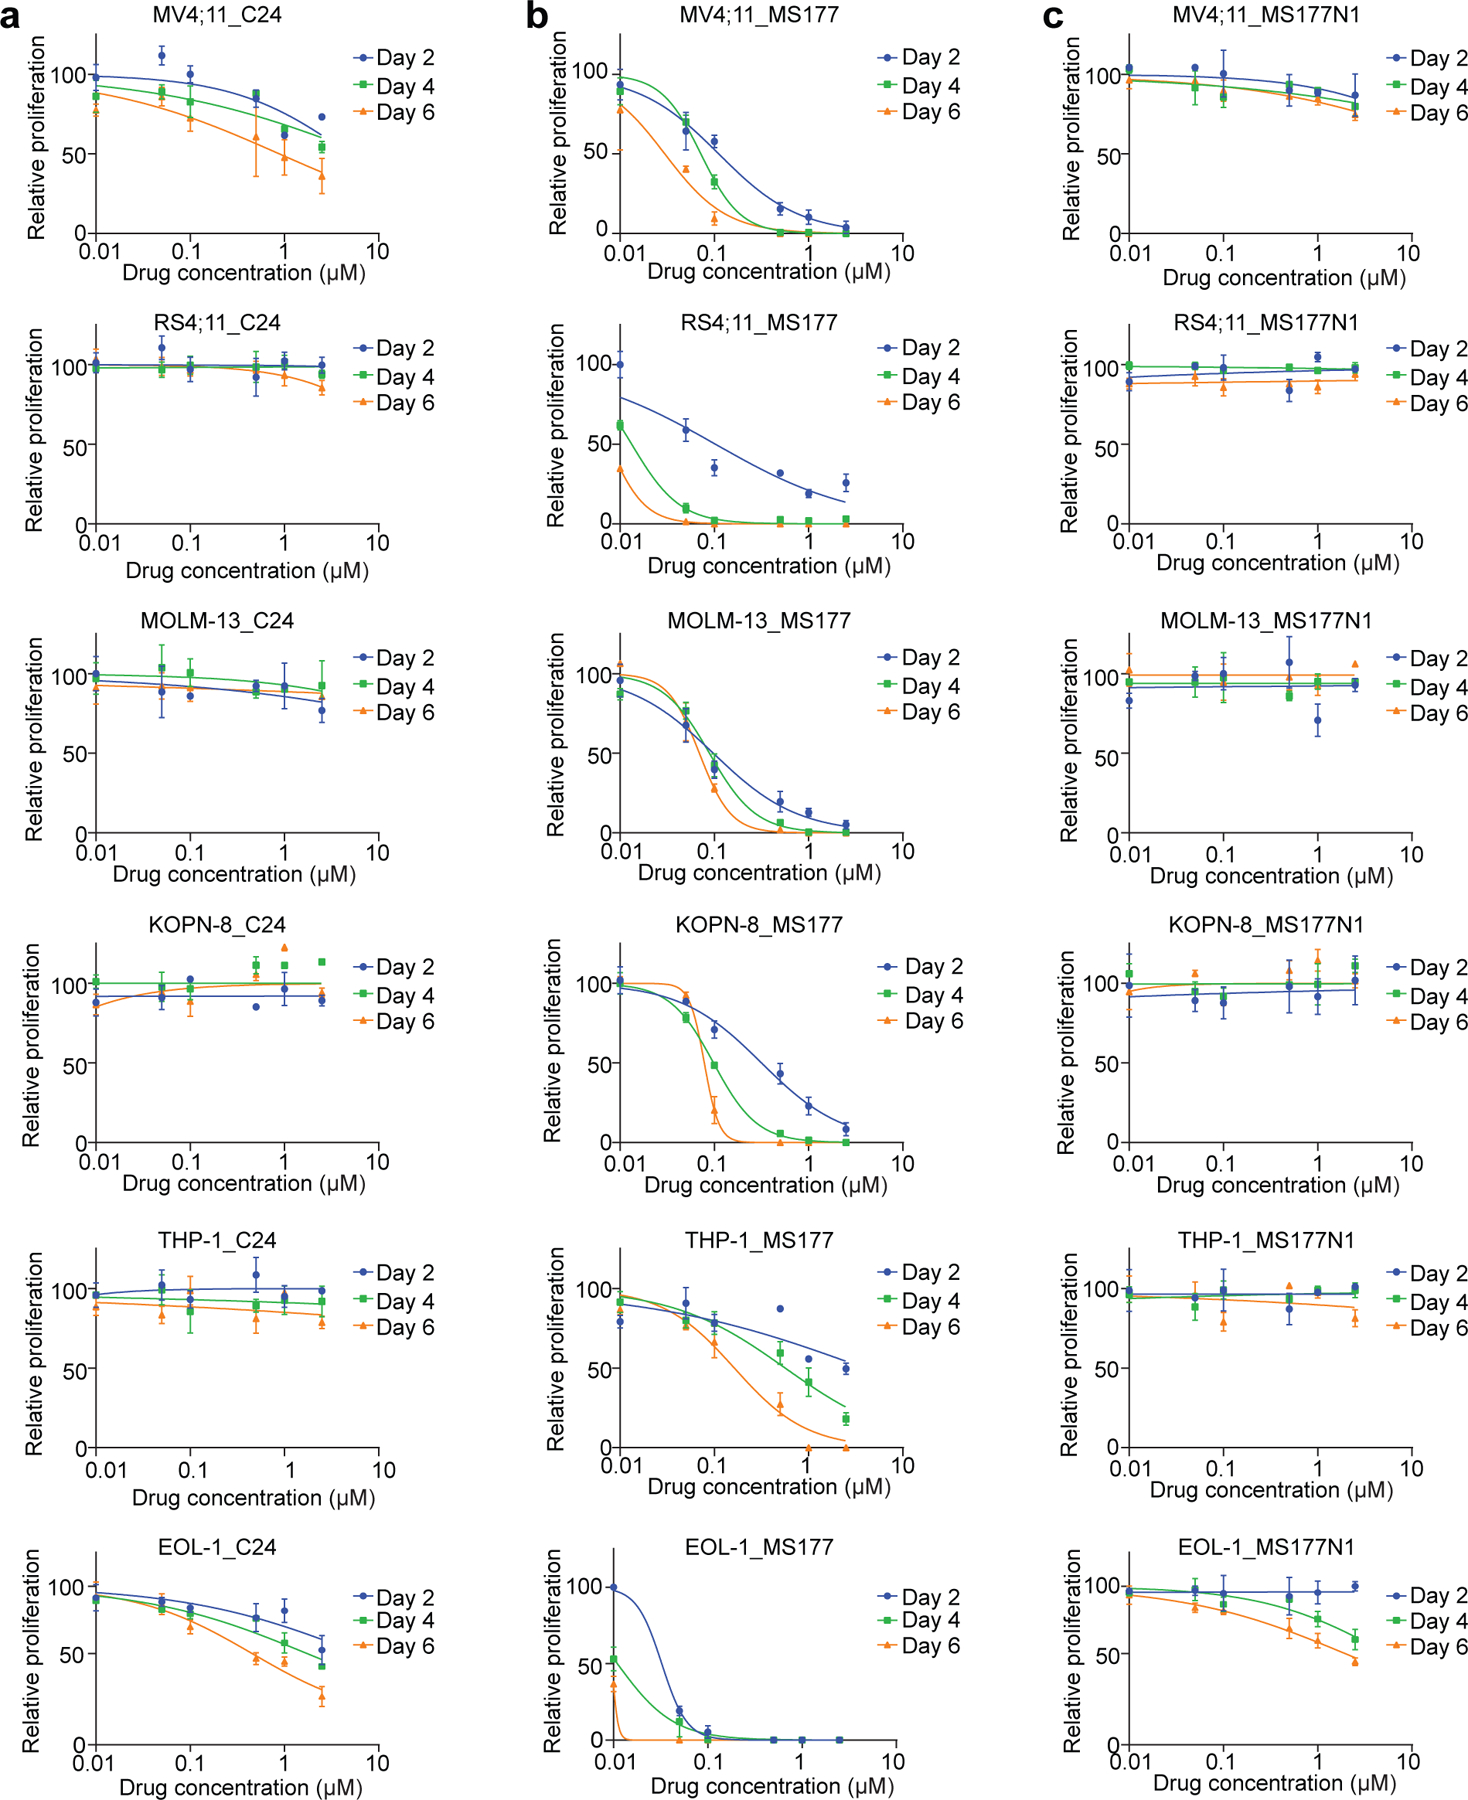
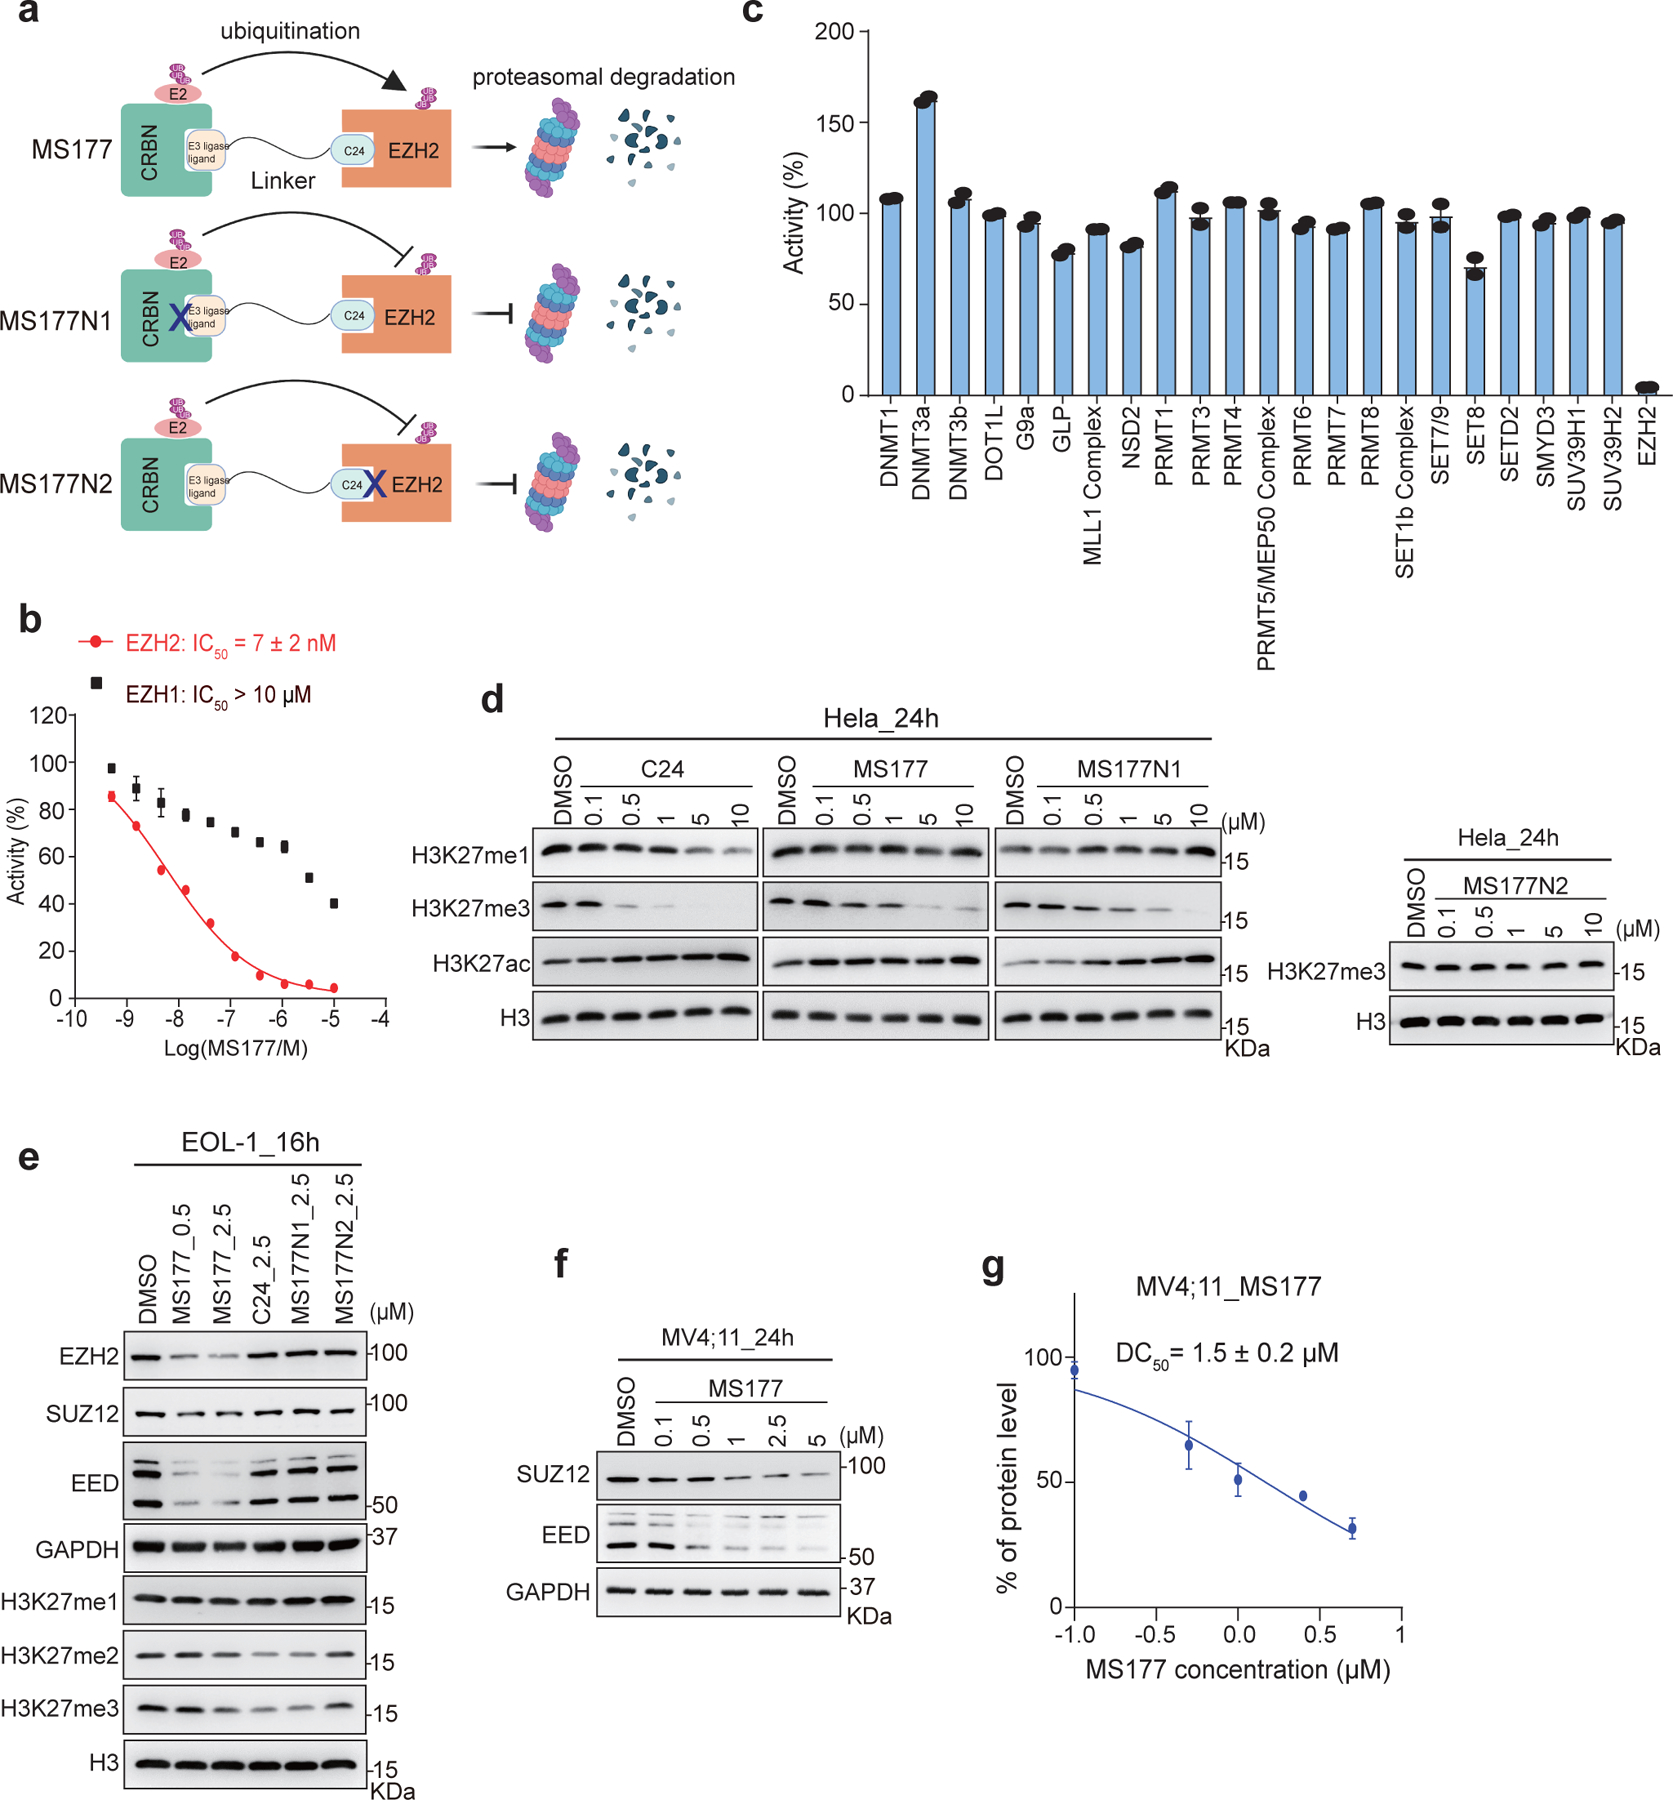
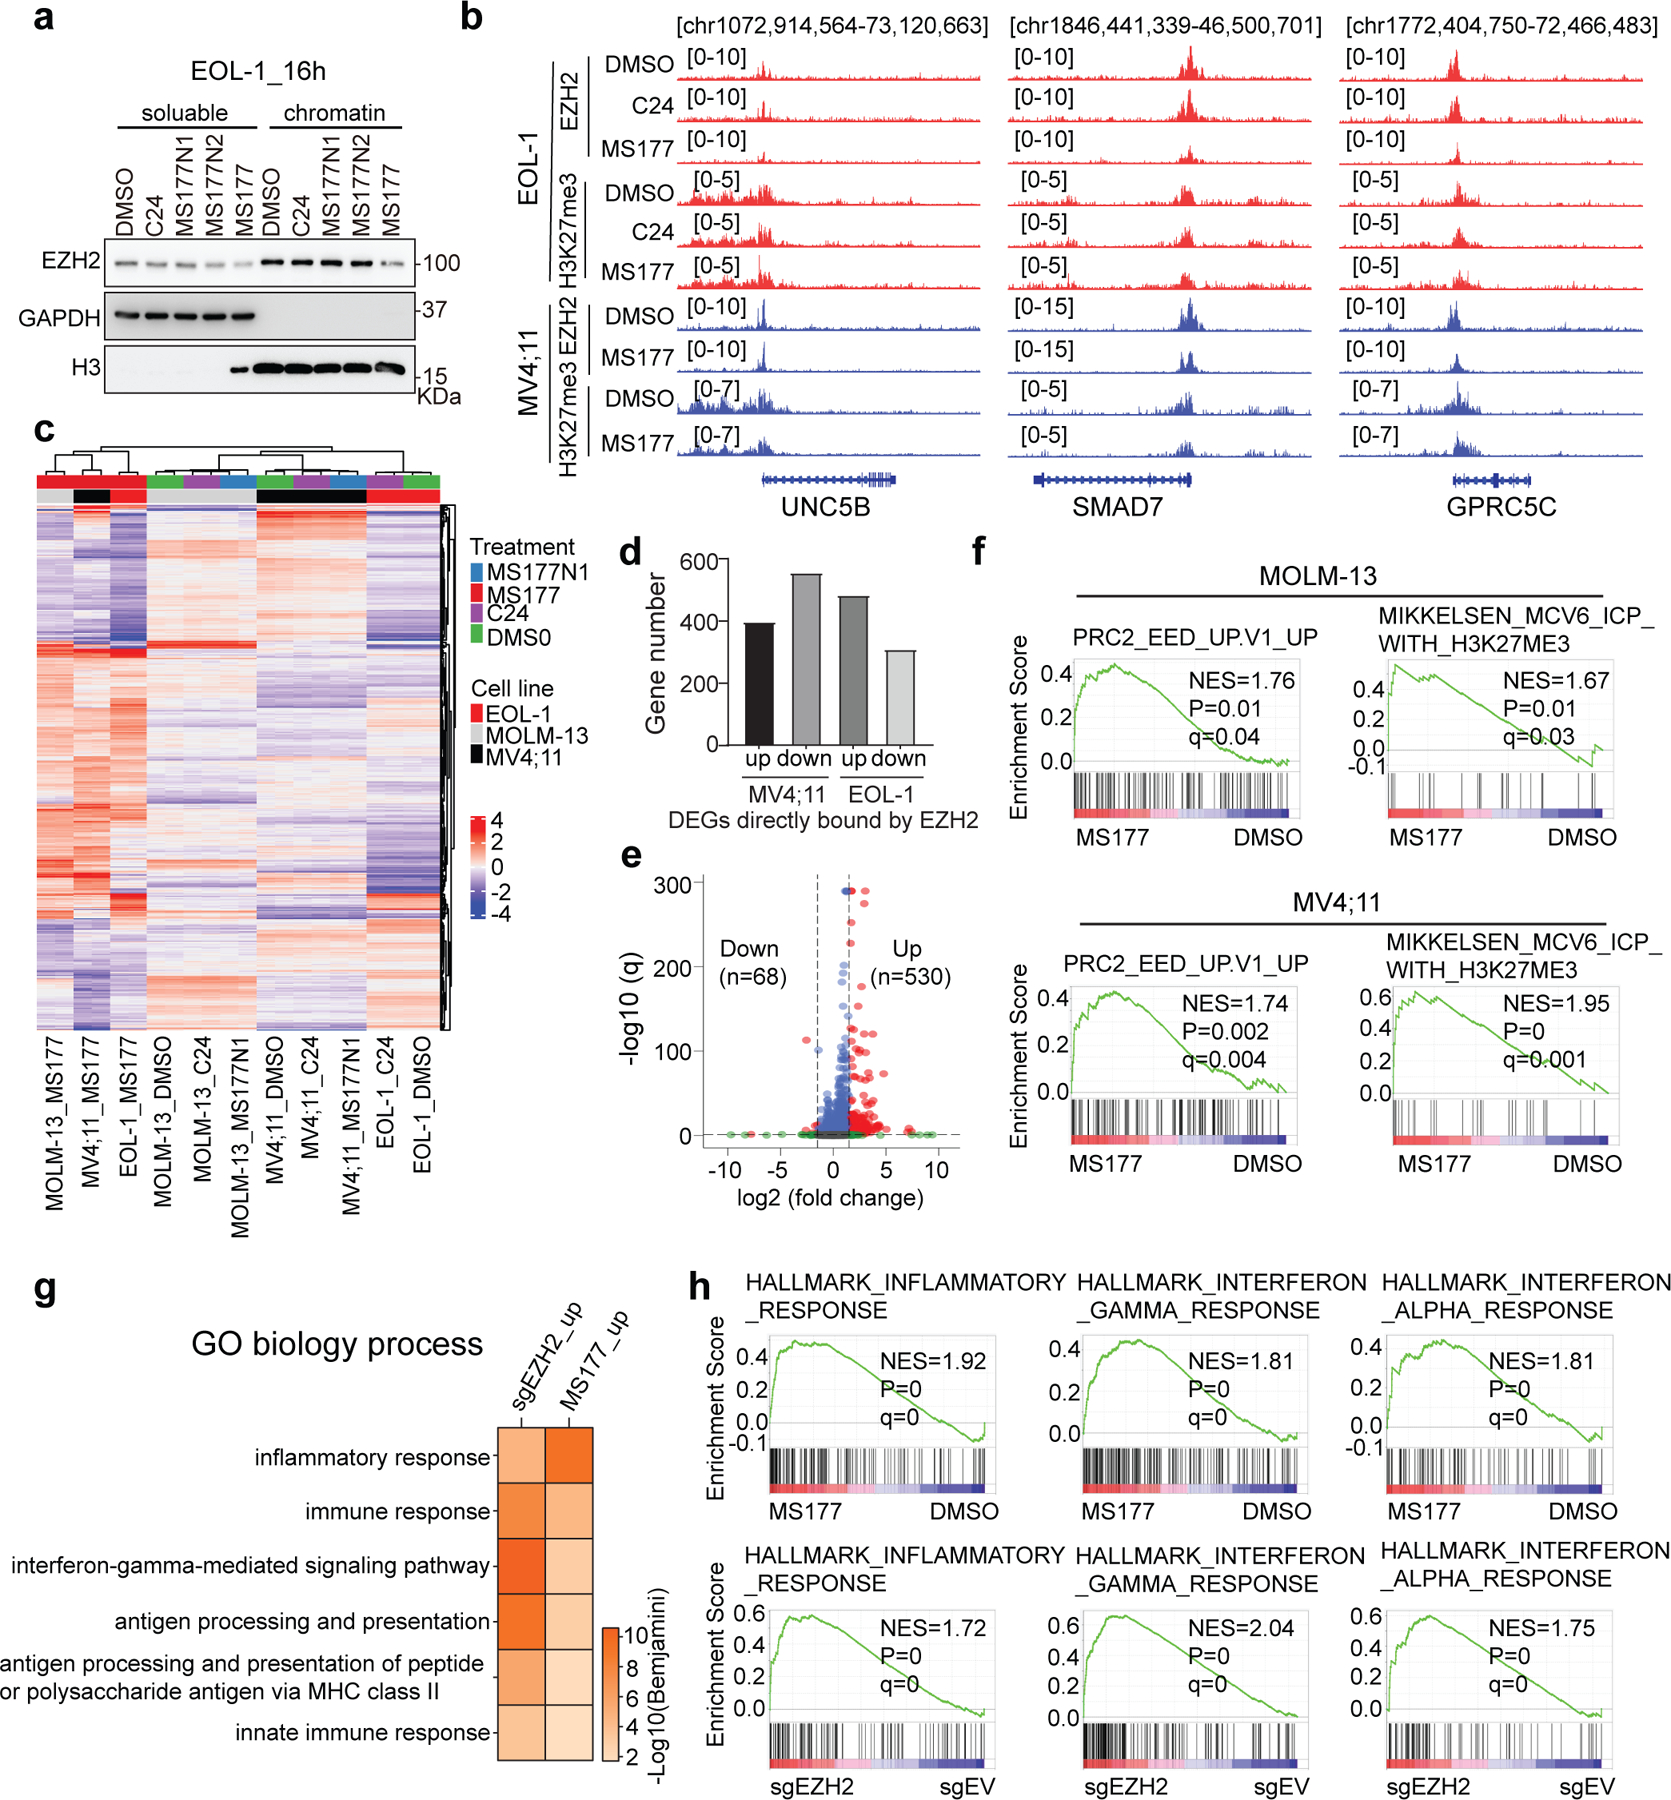
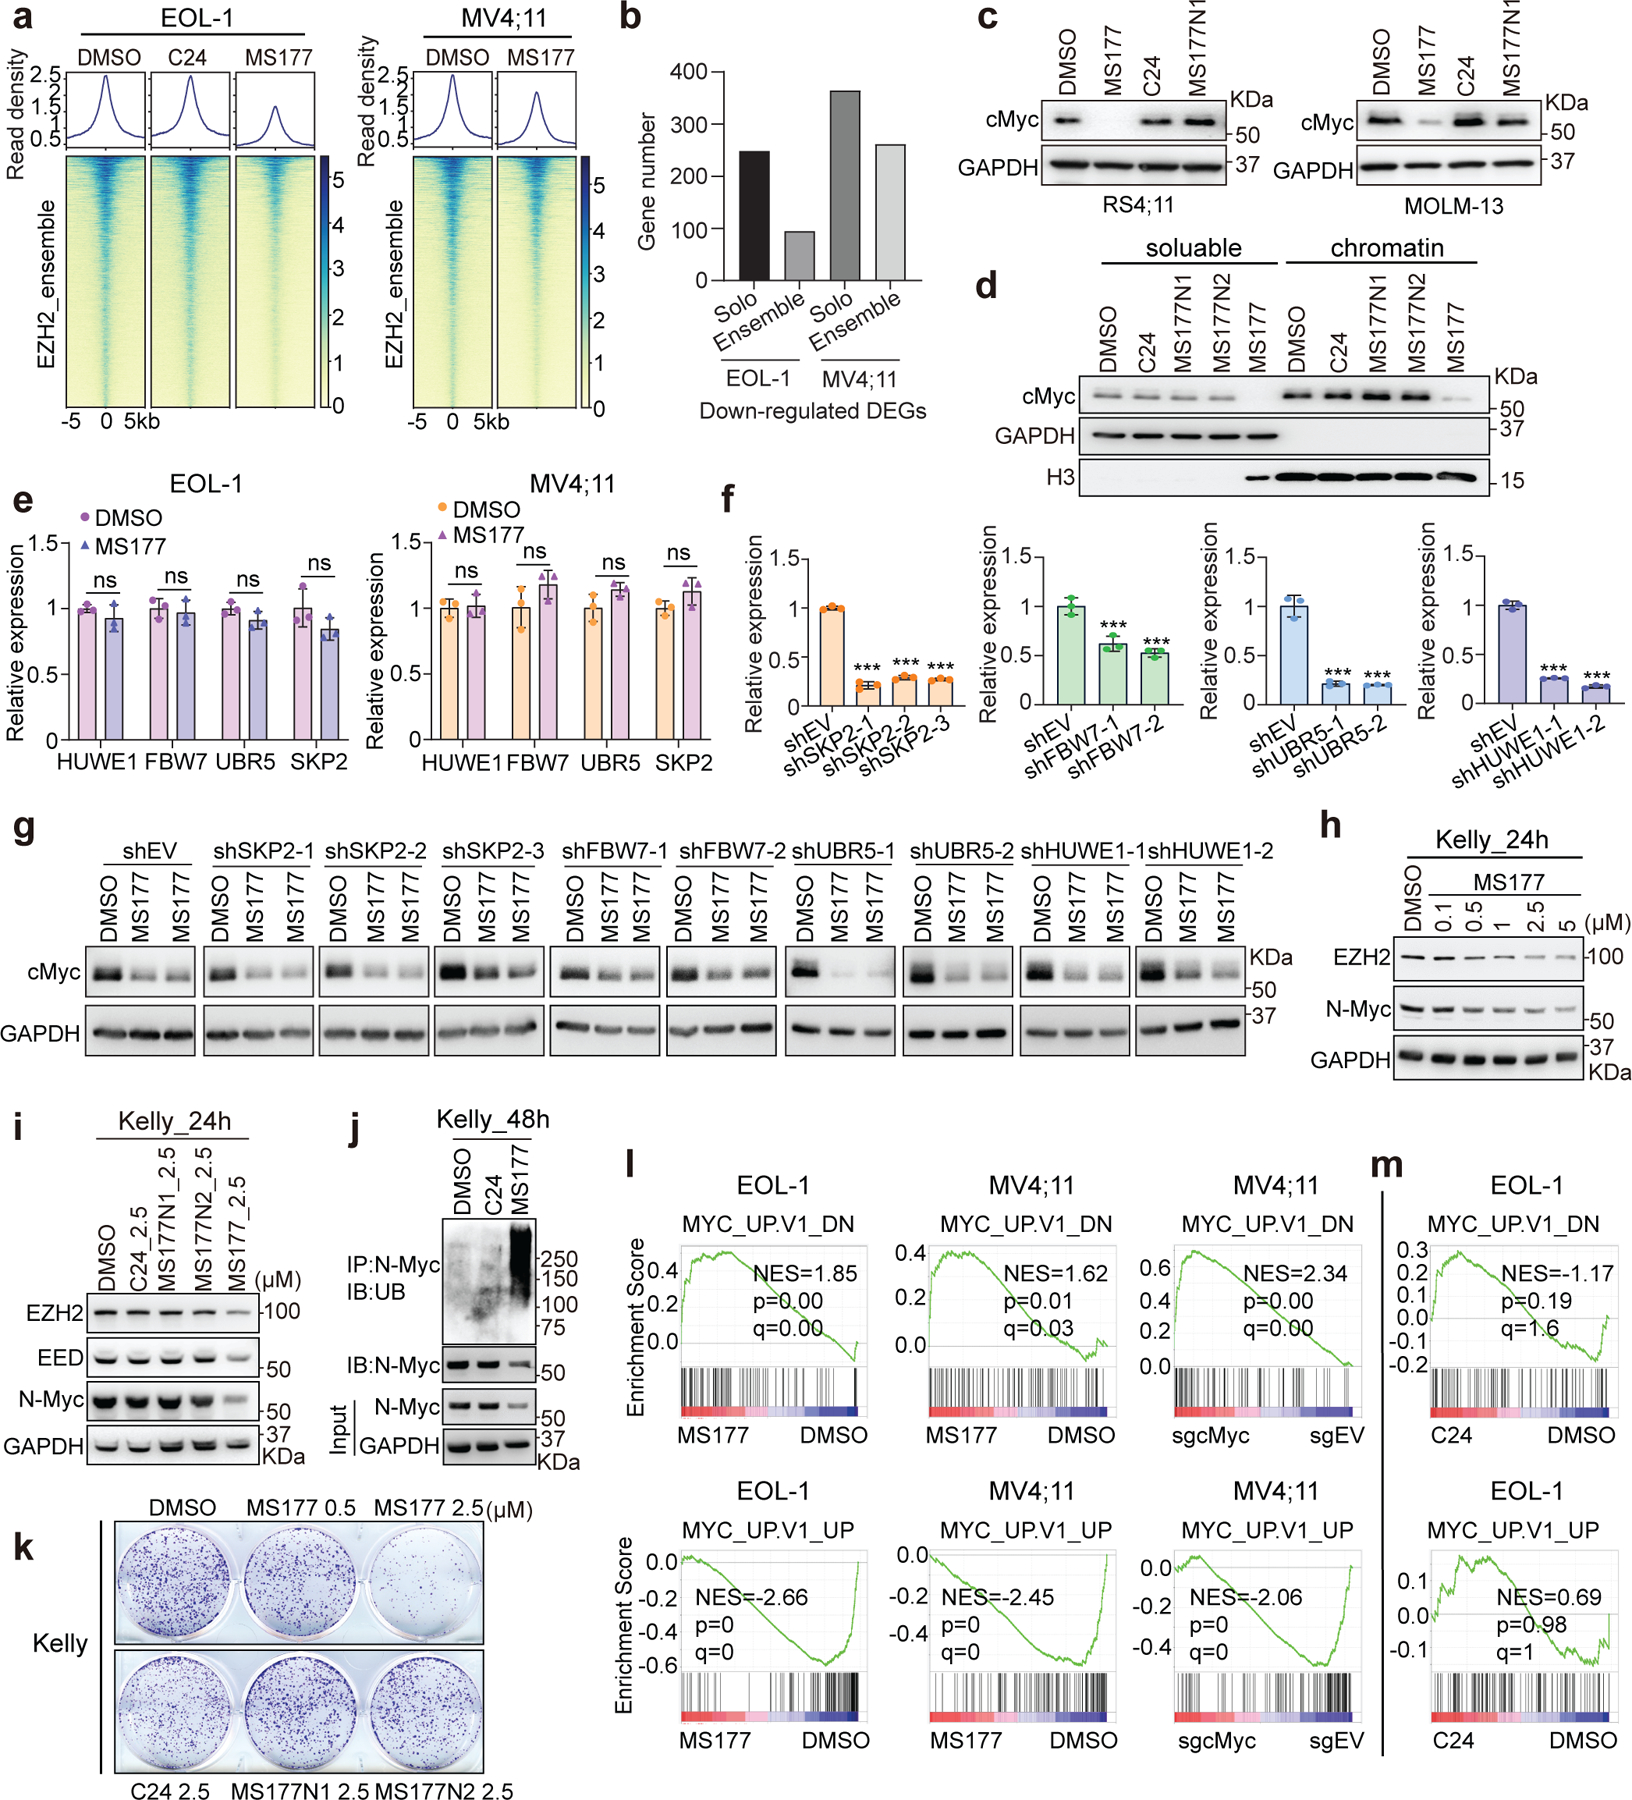
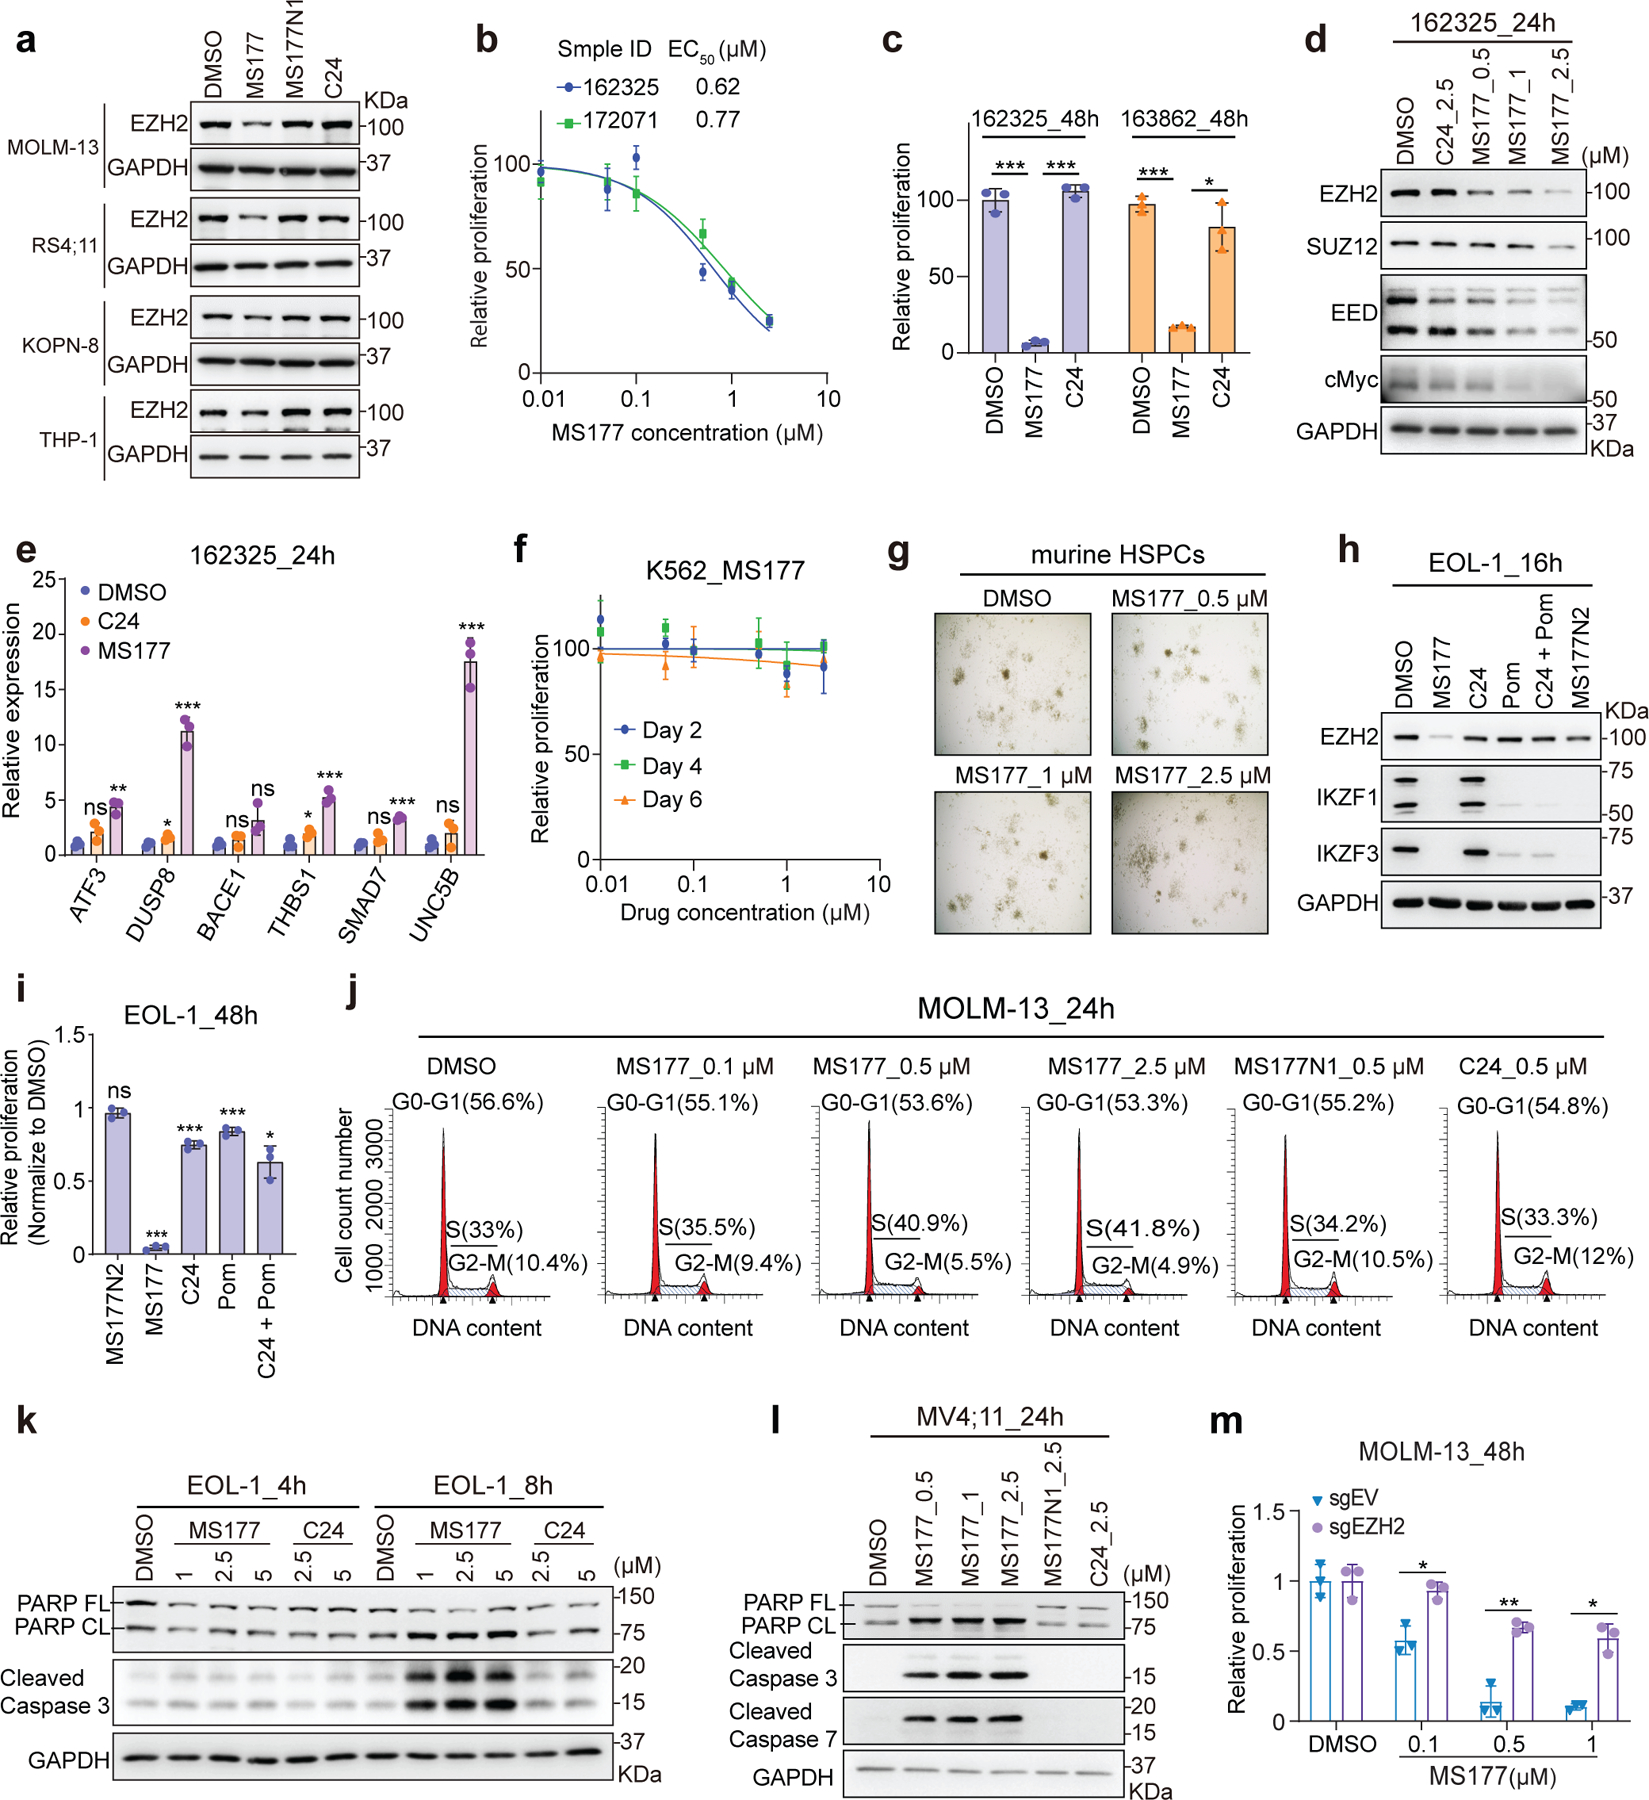
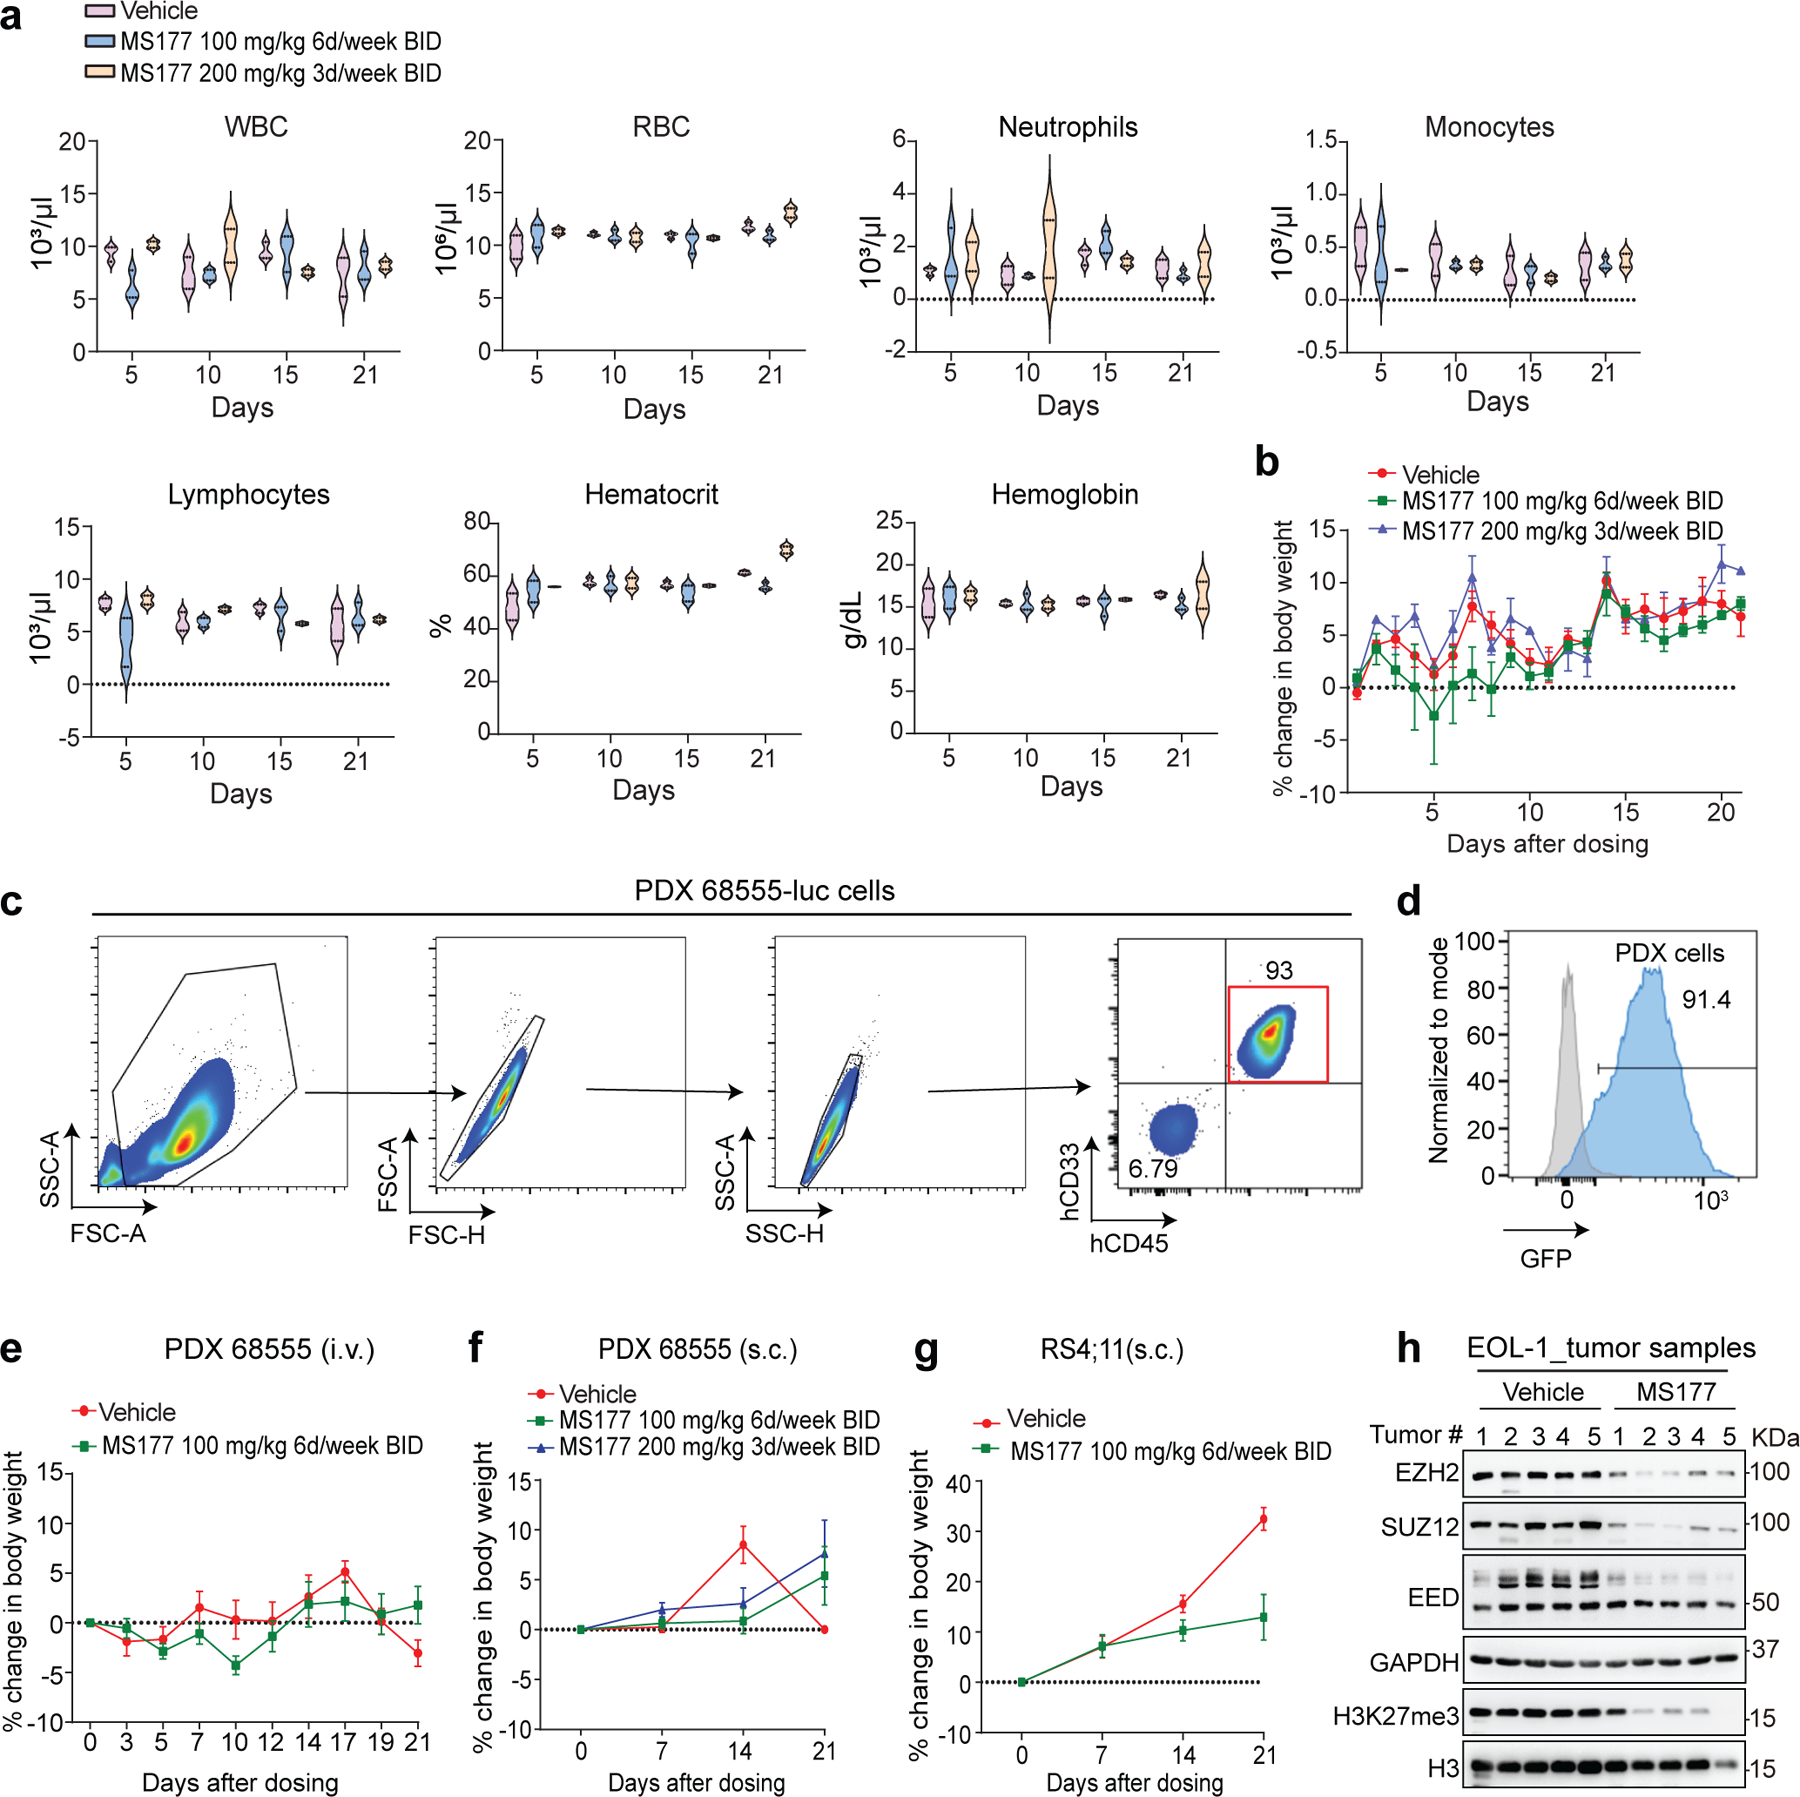
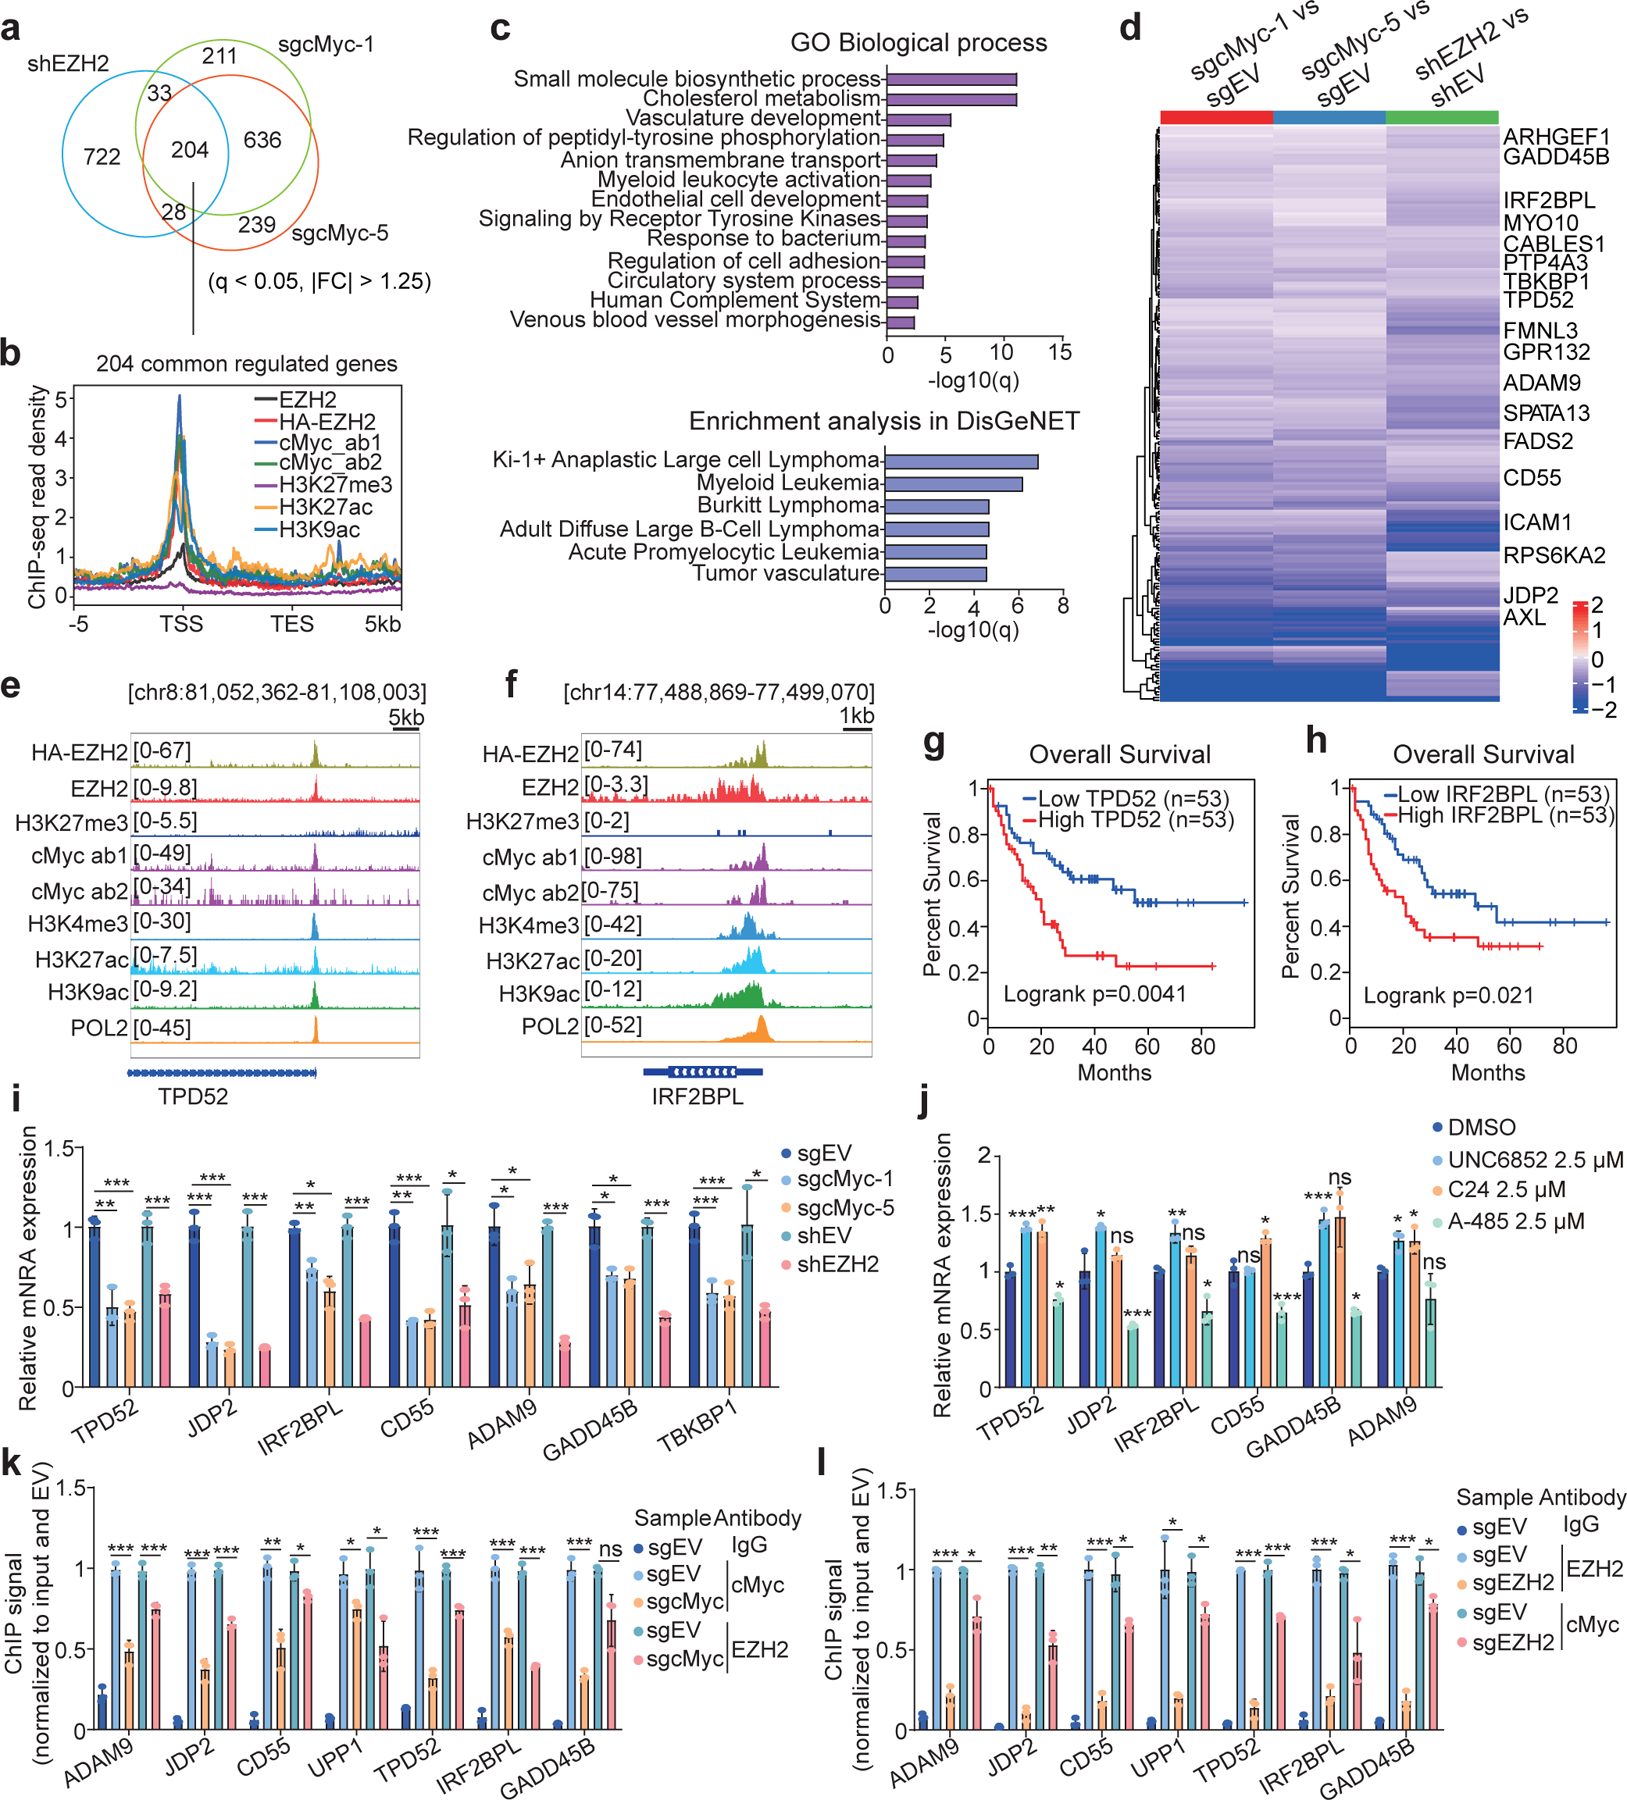
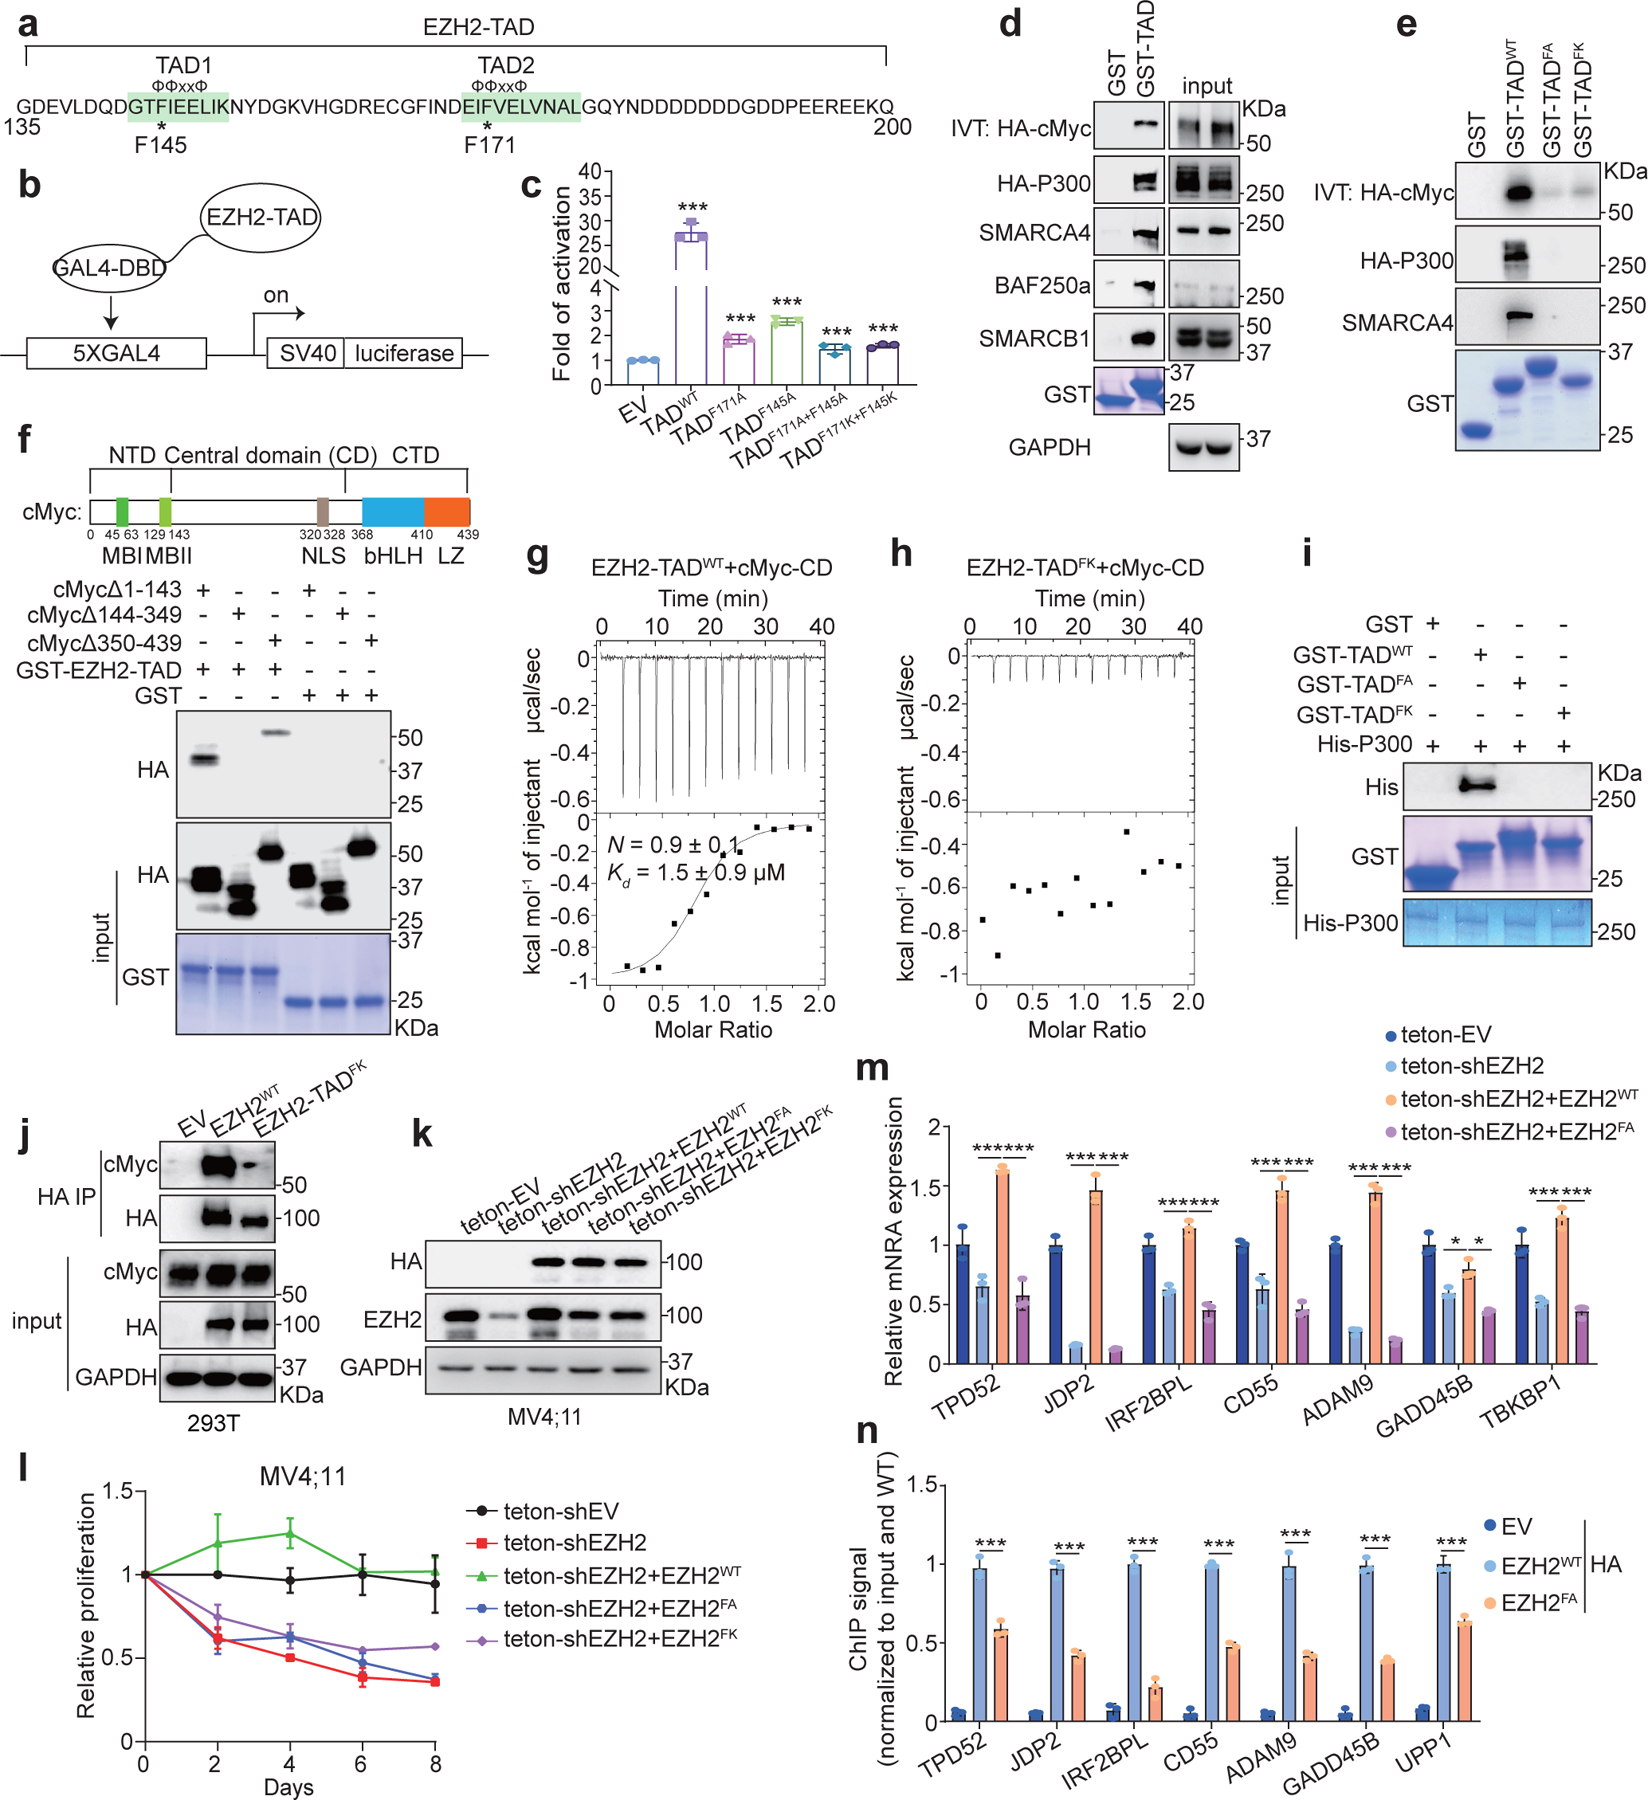
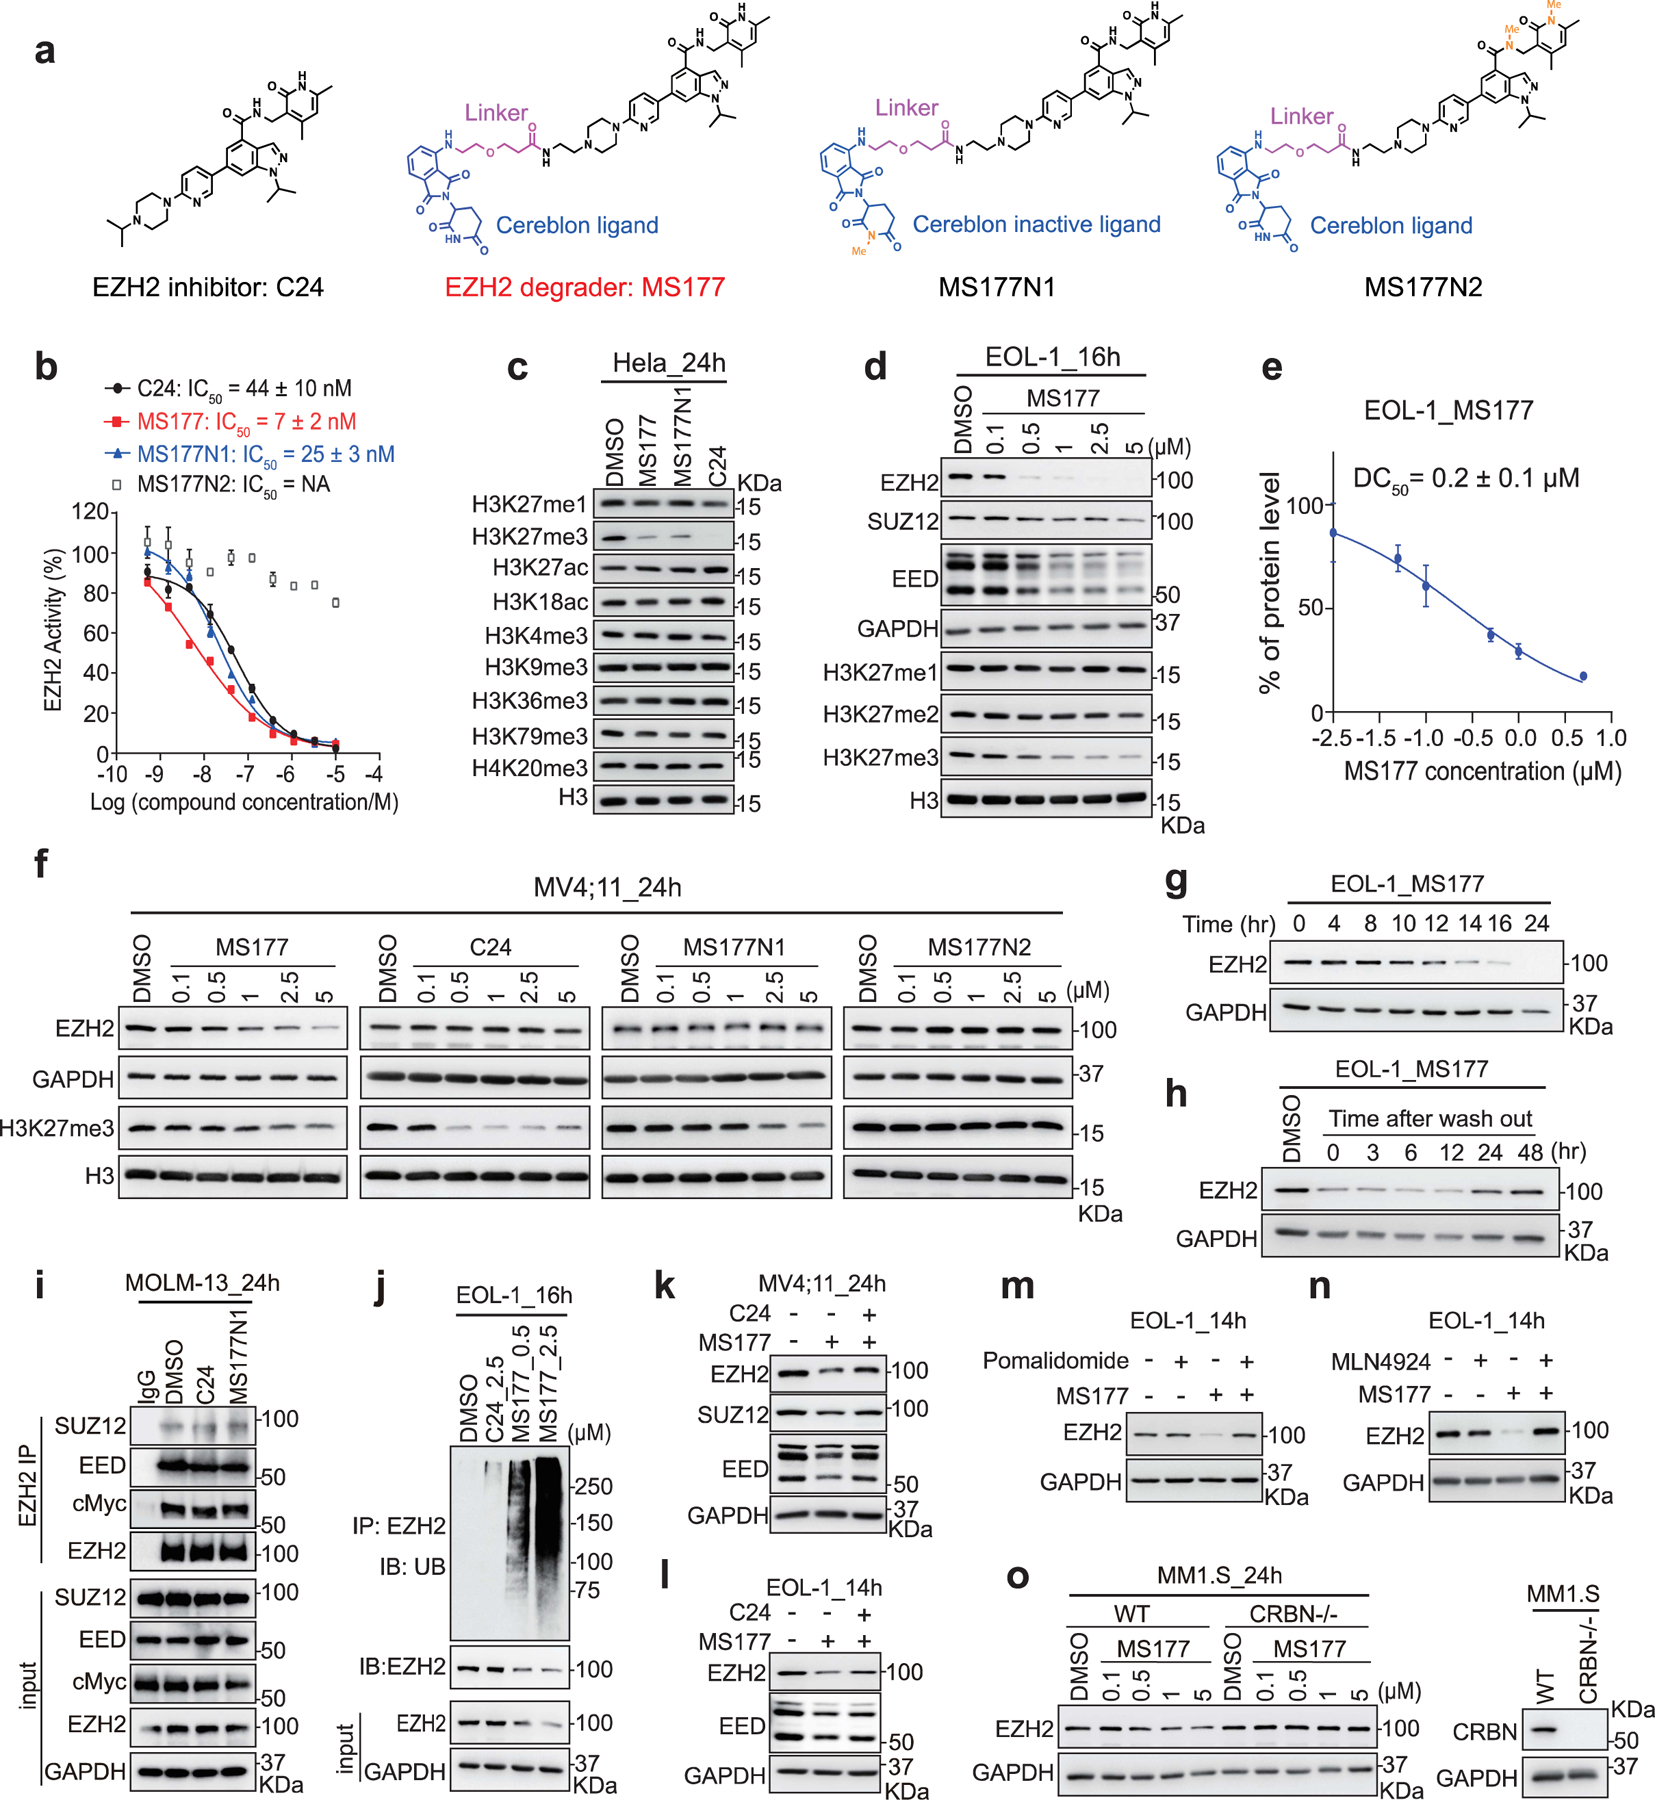
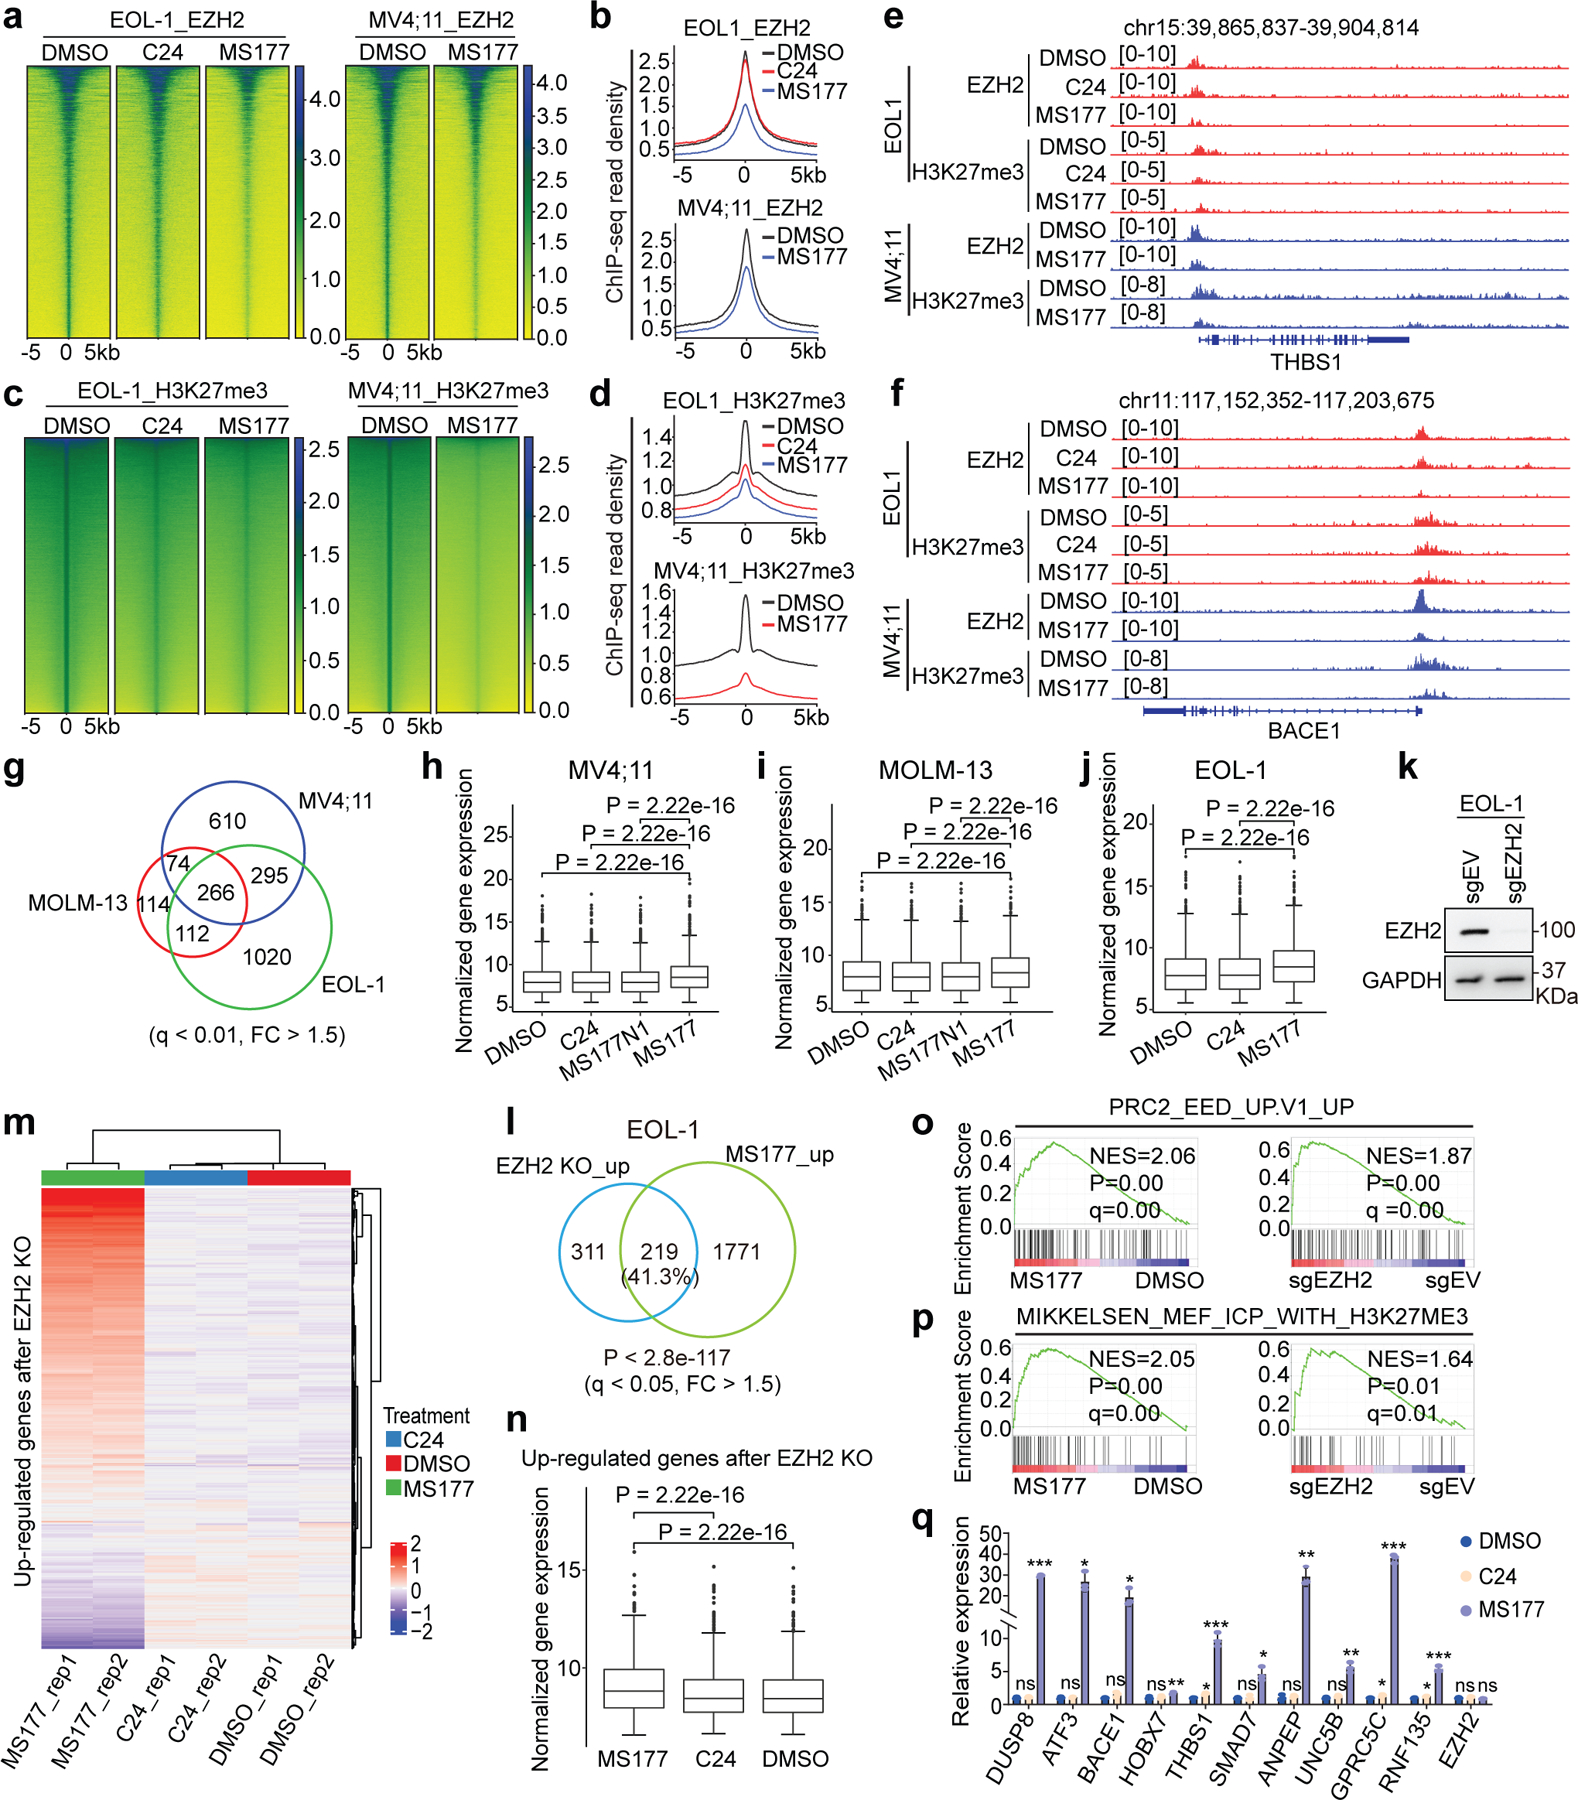
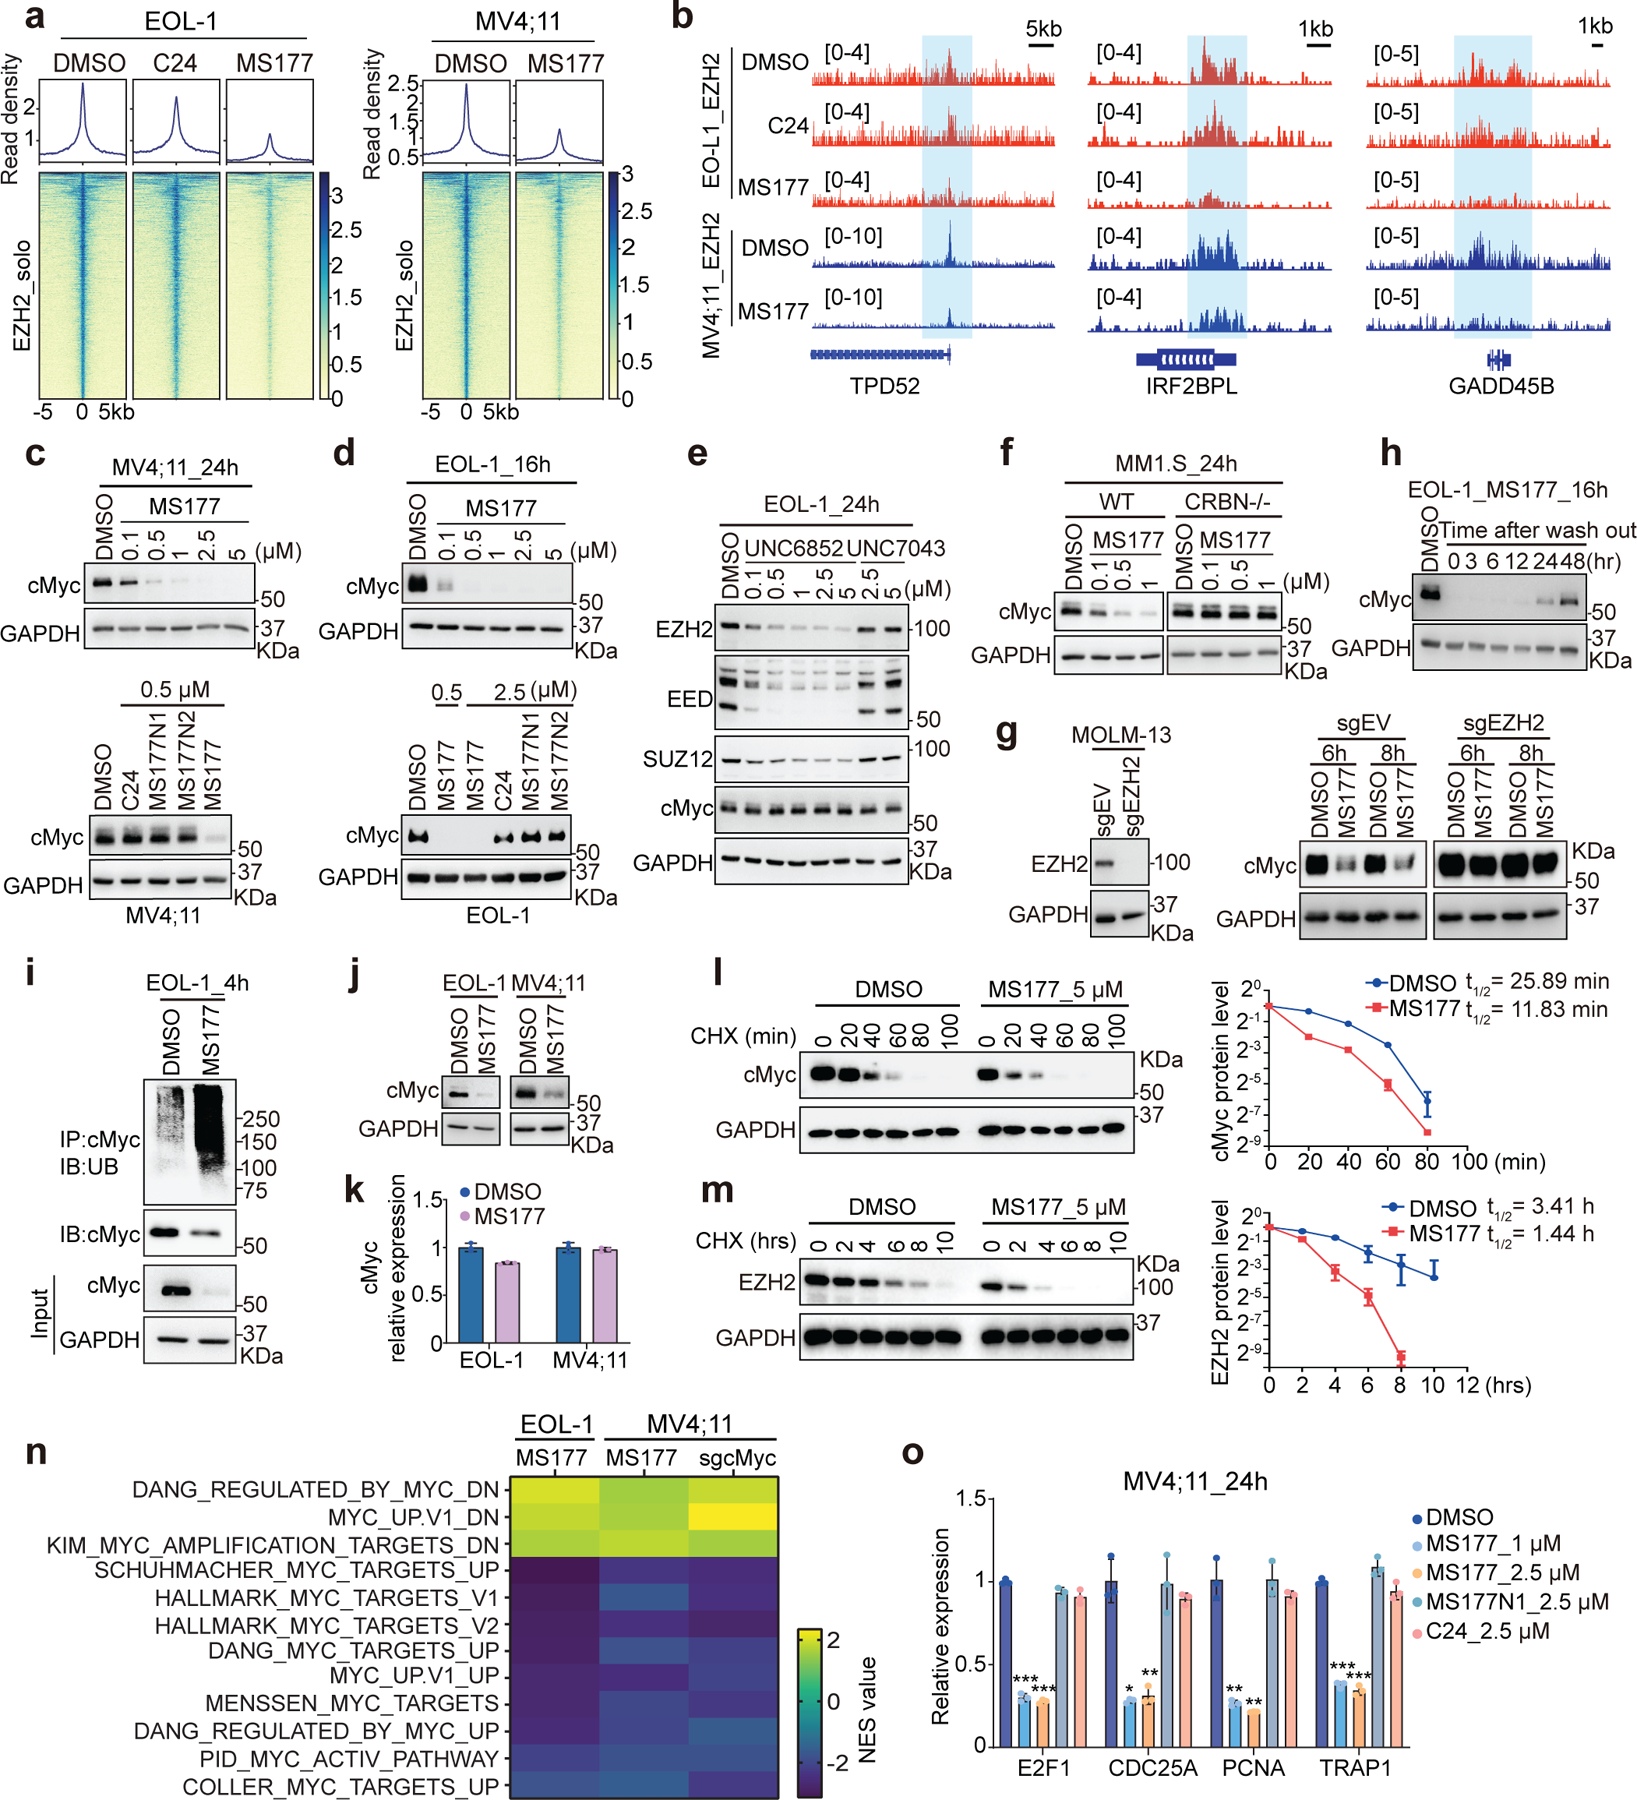
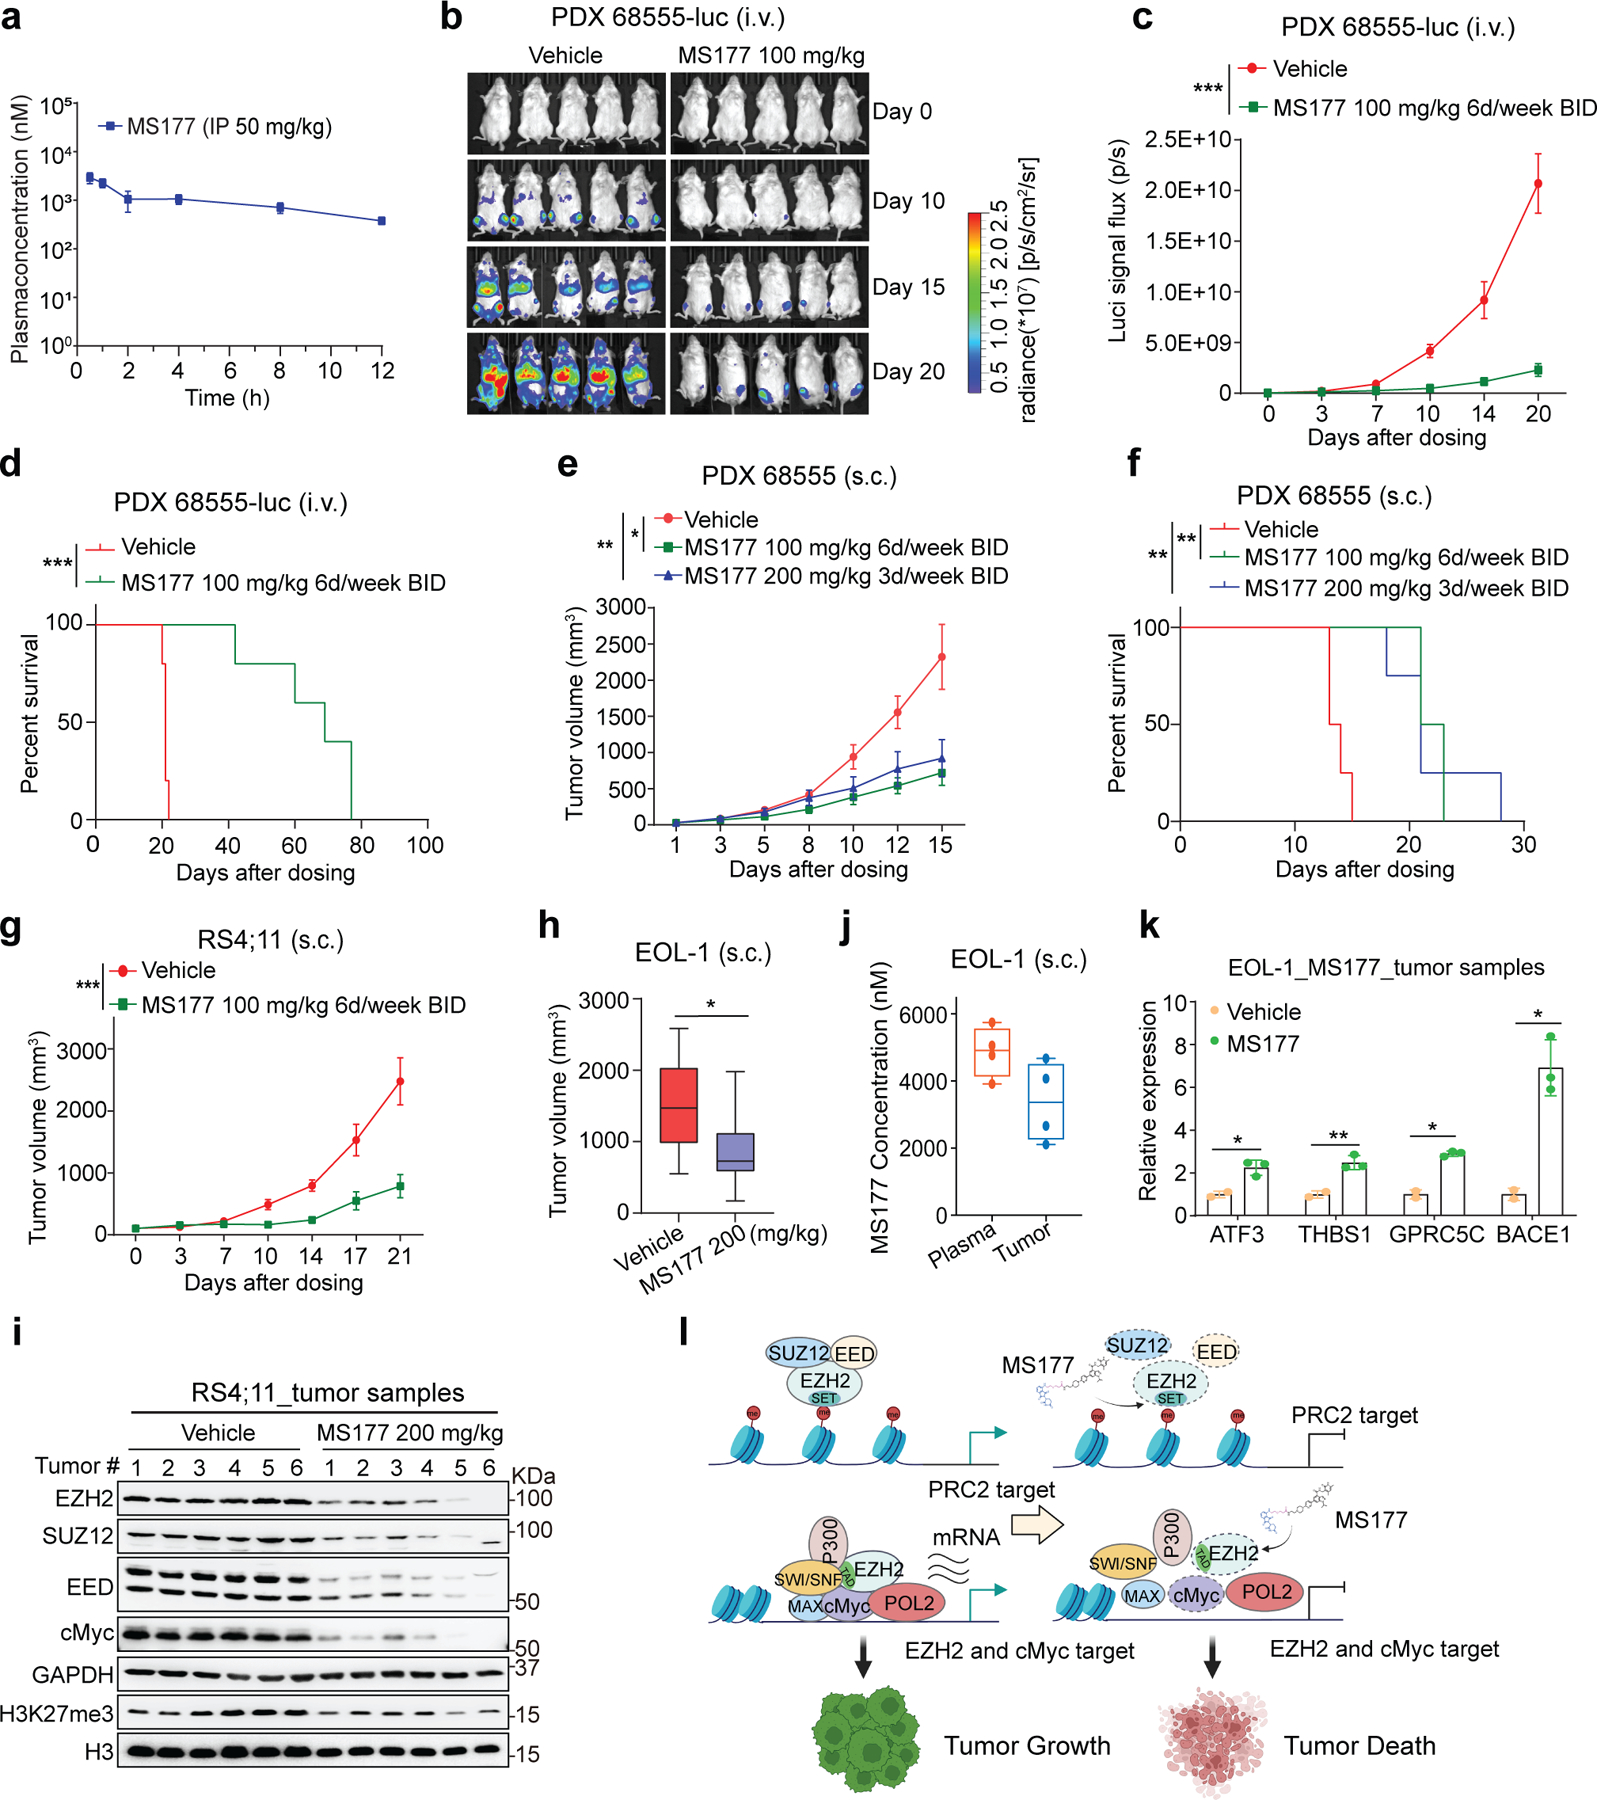
Canonically, EZH2 serves as the catalytic subunit of PRC2, which mediates H3K27me3 deposition and transcriptional repression. Here, we report that in acute leukaemias, EZH2 has additional noncanonical functions by binding cMyc at non-PRC2 targets and uses a hidden transactivation domain (TAD) for (co)activator recruitment and gene activation. Both canonical (EZH2-PRC2) and noncanonical (EZH2-TAD-cMyc-coactivators) activities of EZH2 promote oncogenesis, which explains the slow and ineffective antitumour effect of inhibitors of the catalytic function of EZH2. To suppress the multifaceted activities of EZH2, we used proteolysis-targeting chimera (PROTAC) to develop a degrader, MS177, which achieved effective, on-target depletion of EZH2 and interacting partners (that is, both canonical EZH2-PRC2 and noncanonical EZH2-cMyc complexes). Compared with inhibitors of the enzymatic function of EZH2, MS177 is fast-acting and more potent in suppressing cancer growth. This study reveals noncanonical oncogenic roles of EZH2, reports a PROTAC for targeting the multifaceted tumorigenic functions of EZH2 and presents an attractive strategy for treating EZH2-dependent cancers.


Conflict of interest statement

Competing interests

Icahn School of Medicine at Mount Sinai filed a patent application (WO 2018/081530 A1) covering EZH2 degraders that lists J.J. and A.M. as inventors. The Jin laboratory received research funds from Celgene Corporation, Levo Therapeutics, Cullgen, Inc. and Cullinan Oncology. J.J. is a cofounder, scientific advisory board member and equity shareholder in Cullgen Inc. and a consultant for Cullgen Inc., EpiCypher Inc., and Accent Therapeutics Inc. The remaining authors declare no competing interests.

Figures

Extended Data Fig. 1|
Extended Data Fig. 1|. In MLL-rearranged (MLL-r) acute leukemia, EZH2 exhibits the noncanonical ‘solo’-binding pattern at sites enriched for the gene-activation-related histone marks and co-binding of RNA polymerase II (POL2), (co)activators and cMyc, in addition to its canonical EZH2:PRC2 sites showing H3K27me3 co-binding.
(a-b) Heatmaps showing the K-means clustered EZH2 and H3K27me3 ChIP-seq signal intensities ± 3 kb around peak centers in MV4;11 (a) and EOL-1 (b) cells. EZH2-’solo’ and EZH2-’ensemble’ refer to noncanonical EZH2+/H3K27me3- peaks (cluster 9 in MV4;11 and cluster 8 in EOL-1 cells) and canonical EZH2+/H3K27me3+ ones (clusters 1–8 in MV4;11 and clusters 1–7 in EOL-1 cells), respectively. (c) Averaged EZH2 and H3K27me3 ChIP-seq signals around ± 3 kb from the centers of the EZH2-’solo’-binding peaks in MV4;11 (top) and EOL-1 (bottom) cells. (d) Venn diagram showing the overlap between the called EZH2 and H3K27me3 peaks in MV4;11 (top) and EOL-1 (bottom) cells. (e) Motif search analysis of the EZH2-’solo’-binding peaks in MV4;11 cells by using the SeqPos tool in Cistrome. (f) Co-immunoprecipitation (co-IP) using anti-HA antibodies for assaying interaction between Flag-EZH2 and HA-p300 in 293T cells. (g) Co-IP for endogenous EZH2 and MAX using anti-cMyc antibody in EOL-1 or MOLM-13 cells after the treatment of benzonase and ethidium bromide. (h) Co-IP for interaction between endogenous cMyc and EZH2 in 293T cells by using either anti-cMyc (upper) or anti-EZH2 (bottom) antibodies. (i) Co-IP using anti-HA antibodies for interaction between endogenous EZH2 and the transiently expressed HA-cMyc in 293T cells. (j) Co-IP using anti-cMyc antibodies for interaction between the transiently expressed Flag-EZH2 and endogenous cMyc in 293T cells. (k) Pearson correlation analysis of cMyc ChIP-seq profiles generated by using two independent anti-cMyc antibodies in MV4;11 and EOL-1 cells. (l) Pie-chart plot showing the genomic distribution of peaks with both EZH2-’solo’-binding and cMyc-binding in MV4;11 (top) or EOL-1 (bottom) cells. (m) Heatmaps of EZH2, SUZ12, H3K27me3 and cMyc ChIP-seq signal intensities ± 5 kb from the centers of the called EZH2 peaks in the GM12878 lymphoblast cells (left), human umbilical vein endothelial cells (HUVEC; middle) and K562 chronic myeloid leukemia (CML) cells (right).
Extended Data Fig. 2|
Extended Data Fig. 2|. Cooperative recruitment of EZH2 and cMyc to common targets leads to gene activation in leukemia.
(a-d) Immunoblotting for EZH2 (a) or cMyc (c) and growth of MV4;11 cells following the doxycycline (Dox)-induced EZH2 knockdown (KD; shEZH2, b) or cMyc knockout (KO; by either sgcMyc-1 or sgcMyc-5, d), relative to respective empty vector (EV) controls. Y-axis shows growth after normalization to controls (n=3; mean ± SD; unpaired two-tailed Student’s t-test). iCas9, Dox-inducible Cas9. (e) Venn diagram using downregulated DEGs, identified by RNA-seq with (blue) or without (red) the spike-in control normalization, in MV4;11 cells following EZH2 KD or cMyc KO. (f) Venn diagram using downregulated DEGs, identified by RNA-seq with spike-in control normalization, in MV4;11 cells post-depletion of EZH2 or cMyc. (g) Venn diagram using the EZH2/cMyc co-upregulated genes, identified by RNA-seq with (blue) or without (red) spike-in control normalization, in MV4;11 cells. (h) Averaged signals of the indicated protein at the EZH2/cMyc co-upregulated genes (n=129; shown in f). TSS, transcriptional start site; TES, transcriptional end site. (i) Gene Ontology (GO) analysis (top) and enrichment of the DisGeNet category (bottom) using the EZH2/cMyc co-upregulated genes in f. (j-k) Box plot showing overall expression of all genes (left) and those associated with EZH2-’solo’ (middle) or -’ensemble’ (right) peaks in EOL-1 (j) or MV4;11 (k) cells. The boundaries of box plots indicate the 25th and 75th percentiles, the center line indicates the median, and the whiskers (dashed) indicate 1.5× the interquartile range. Paired two-sided t-test. (l) Box plots showing log2-converted ratios for the indicated sample comparisons by using the 204 genes identified in main Fig 2a. Box plot was defined the same as above. (m) IGV views of the indicated factor at GADD45B, CD55 and ADAM9 in MV4;11 cells. (n-p) Immunoblotting of the indicated protein in MV4;11 cells post-treatment with C24 (n), UNC6852 (o) or A-485 (p) for 24 hours. (q) EZH2 immunoblot following EZH2 KO. *, **, and *** denote P < 0.05, 0.01 and 0.005, respectively. NS denotes not significant. Numerical source data, statistics, exact P values and unprocessed blots are available as source data.
Extended Data Fig. 3|
Extended Data Fig. 3|. A cryptic transactivation domain (TAD) of EZH2 (EZH2-TAD) directly associates with cMyc and coactivator (p300), promoting malignant growth of leukemia cells.
(a) Analysis with a prediction software, 9aaTAD, showing two putative TAD sequences (TAD1 and TAD2) within EZH2. Algorithm for the 9aaTAD amino acid pattern was applied in the search, and region clustering conformity was assessed by percentage. (b) Hydrophobicity profile of EZH2-TAD. (c) Luciferase reporter assay using the Gal4 DNA-binding domain (DBD) fusion of EZH2-TAD or VP16-TAD (a potent TAD as a positive control), compared to EV. Y-axis shows relative reporter activation after normalization of signals from an internal control (Renilla luciferase) and then to those of EV-transduced mock (n=3; mean ± SD; unpaired two-tailed Student’s t-test). *, **, and *** denote the P value of < 0.05, 0.01 and 0.005, respectively. NS denotes not significant. Numerical source data, statistics and exact P values are available as source data.
Extended Data Fig. 4|
Extended Data Fig. 4|. Compared to C24 or MS177N1, MS177 is much more potent in inhibiting tumor cell growth.
(a-c) Plots showing the growth inhibitory effect of various used concentrations (x-axis; in the log10 converted values) of either C24 (a), MS177 (b) or MS177N1 (c) using a panel of six MLL-r acute leukemia cell lines (i.e., MV4;11, RS4;11, MOLM-13, KOPN-8, THP-1 and EOL-1 cells), treated for 2, 4 or 6 days. Y-axis shows relative cell growth after normalization to DMSO-treated controls (n=3; mean ± SD).
Extended Data Fig. 5|
Extended Data Fig. 5|. Biochemical characterization of the EZH2-targeting PROTAC degrader, MS177.
(a) Scheme showing the expected effect by MS177, MS177N1 (which contains a moiety that does not bind CRBN; indicated by a cross-mark) and MS177N2 (which contains a moiety that does not bind EZH2). (b) A radioactive methyltransferase assay (3H-labeled S-Adenosyl methionine [SAM] as methyl donor) showing that MS177 exhibits a high inhibition potency for EZH2 and a high selectivity for EZH2 over EZH1. X-axis and y-axis show the used concentration of MS177 (in Log scale) and the rate of inhibition (treatment versus mock), respectively (n=3; mean ± SD). IC50, half maximal inhibitory concentration. (c) Selectivity of MS177 (10 μM, relative to mock) against a panel of 23 different lysine, arginine or DNA methyltransferases in radioactive methyltransferase assays (n=3; mean ± SD). (d) Immunoblotting of the indicated histone modification in Hela cells after a 24-hour treatment with different concentrations of C24, MS177, MS177N1 or MS177N2, in comparison to mock (DMSO). (e) Immunoblotting of PRC2 subunits (GAPDH as a loading control) and global H3K27 methylation levels (H3 as a loading control) in EOL-1 cells post-treatment with DMSO, the indicated concentrations of MS177, or 2.5 μM of C24, MS177N1 or MS177N2 for 16 hours. (f) Immunoblotting of PRC2 subunits (GAPDH as a loading control) in MV4;11 cells after a 24-hour treatment with the increasing concentration of MS177, relative to mock (DMSO). (g) Measurement of half-maximal degradation concentration (DC50) value of MS177 in MV4;11 cells, based on EZH2 immunoblotting signals in the MS177-treated and mock-treated cells (n=2 independent experiments; mean ± SD; quantified with ImageJ).
Extended Data Fig. 6|
Extended Data Fig. 6|. Integrated ChIP-seq and RNA-seq analysis showing the EZH2:PRC2 on-target effect of MS177.
(a) Immunoblotting of EZH2, either nucleoplasmic (left) or chromatin-bound (right), in EOL-1 cells after a 16-hour treatment with DMSO or 2.5 µM of C24, MS177N1, MS177N2 or MS177. GAPDH and histone H3 serve as the cell fractionation controls. (b) IGV views of EZH2 and H3K27me3 ChIP-seq peaks at the indicated EZH2:PRC2 target gene post-treatment of EOL-1 (upper; for 16 hours) and MV4;11 cells (bottom; for 24 hours) with either DMSO or 0.5 μM of C24 or MS177. (c) Unsupervised clustering analysis using the RNA-seq-based transcriptome profiles of the three independent MLL-r acute leukemia cell lines after the treatment with DMSO or 0.5 μM of MS177, C24 or MS177N1. MV4;11 and MOLM13 cells were treated for 24 hours, and EOL-1 cells for 16 hours (n=2 replicated samples). (d) Bar plot showing the number of DEGs associated with the direct EZH2 binding in MV4;11 (left) or EOL-1 (right) cells. Up and down refer to those up- and down-regulated DEGs, respectively, based on RNA-seq analysis. (e) Volcano plot showing differential expression analysis of genes based on RNA-seq profiles of EOL-1 cells with EZH2 KO versus mock control (n=2 replicated samples). The x-axis shows the log2 value of fold-change in gene expression (in KO versus vector-treated cells) and the y-axis shows the -log10 value of adjusted P (q) value, with the dashed lines indicating the cut-off of significance. (f) GSEA revealing that, relative to DMSO, MS177 treatment is positively correlated with upregulation of the indicated genes repressed by PRC2:EED (left) or bound by H3K27me3 (right) in MOLM-13 (top) or MV4;11 (bottom) cells. (g) DAVID functional annotation reveals that the DEGs up-regulated after EZH2 KO (sgEZH2_up) or MS177 treatment (MS177_up) in EOL-1 cells have similar enrichment for the immunity-related genes. (h) GSEA shows that, relative to their respective controls, both MS177 treatment (top) and EZH2 KO (bottom) in EOL-1 cells are positively correlated with upregulation of the indicated immunity-related genesets.
Extended Data Fig. 7|
Extended Data Fig. 7|. MS177 represses Myc-related oncogenic nodes by inducing Myc protein ubiquitination and degradation.
(a) Heatmaps showing the EZH2 ChIP-seq signal intensities (normalized against spike-in control and sequencing depth) ± 5 kb around the centers of EZH2/H3K27me3-cobound ‘ensemble’ peaks in EOL-1 (left) and MV4;11 cells (right), treated for 16 and 24 hours respectively with DMSO (left), C24 (middle) or MS177 (right). (b) Bar plot showing the number of DEGs, down-regulated in EOL-1 (left) or MV4;11 (right) cells following the MS177 versus DMSO treatment, that displayed either the EZH2-’solo’ or EZH2:PRC2 (‘ensemble’) binding. (c) Immunoblotting for cMyc in MLL-r leukemia cells treated with the indicated compound. (d) cMyc immunoblotting using the nucleoplasmic (left) and chromatin-bound (right) fractions of EOL-1 cells, treated with indicated compound for 16 hours. (e) RT-PCR for the indicated E3 ligase in EOL-1 and MV4;11 cells post-treatment with DMSO or 5 µM of MS177 for 4 hours (n=3; mean ± SD; unpaired two-tailed Student’s t-test). (f) RT-PCR for the indicated E3 ligase in MOLM-13 cells, stably expressed with an E3 ligase-targeting shRNAs or EV (n=3; mean ± SD; unpaired two-tailed Student’s t-test). (g) Immunoblotting for cMyc in MOLM-13 cells, stably expressed with an E3 ligase-targeting shRNA or EV, after the treatment with DMSO or 0.5 µM of MS177 for 24 hours. (h-i) Immunoblotting of EZH2, EED and N-Myc using lysate of Kelly cells after a 24-hour treatment with the increasing concentration of MS177 (h), in comparison to C24 and MS177’s non-PROTAC analogs (i). (j) N-Myc ubiquitination immunoblotting in Kelly cells, treated for 48 hours with 2.5 µM of DMSO, C24 or MS177. (k) Colony formation of Kelly cells treated with the indicated compound. (l) GSEA revealing significant enrichments of the indicated cMyc-upregulated (up) or cMyc-repressed (down) genesets in the MS177-treated (left/middle) or cMyc-depleted (sgcMyc; right) cells. (m) GSEA revealing a lack of significant correlation between cMyc-regulated genes and C24 treatment in EOL-1 cells. *, **, and *** denote P < 0.05, 0.01 and 0.005, respectively. NS denotes not significant. Numerical source data, statistics, exact P values and unprocessed blots are available as source data.
Extended Data Fig. 8|
Extended Data Fig. 8|. MS177 exhibits potent effect on inducing leukemia cell growth inhibition, apoptosis, and cell cycle progression arrest.
(a) Immunoblotting for EZH2 and GAPDH in four MLL-r leukemia cell lines, treated with the indicated compound (0.5 µM) for 24 hours. (b) Effect of a 24-hour treatment with different concentrations of MS177 on proliferation of the two indicated primary samples from de-identified AML patients. Y-axis shows mean ± SD after normalization to DMSO-treated (n=3). (c) Proliferation of primary AML cells treated with 1 µM of C24 or MS177, relative to DMSO, for 48 hours (n=3; mean ± SD; unpaired two-tailed Student’s t-test). (d-e) Immunoblotting for EZH2, PRC2 subunits and cMyc (d) and RT-qPCR for EZH2:H3K27me3-cobound genes (e) in primary AML cells, treated with the indicated compound (0.5 µM) for 24 hours. For e, y-axis shows RT-qPCR signals after normalization to those of GAPDH and to DMSO-treated cells (n=3; mean ± SD; unpaired two-tailed Student’s t-test). (f) Growth of K562 cells treated with MS177, relative to DMSO, for the indicated time. Y-axis shows mean ± SD after normalization to DMSO-treated (n=3). (g) Representative view of colonies formed by murine HSPCs in the presence of DMSO or MS177. (h-i) Immunoblotting for EZH2 and IKZF1/3 (h) and growth (i) of EOL-1 cells after the indicated treatment of compound (0.5 µM for all). Pom, pomalidomide. For i, y-axis shows relative growth after normalization to DMSO-treated (n=3; mean ± SD; unpaired two-tailed Student’s t-test). (j) Representative flow cytometry-based histograms showing the DNA content in MOLM-13 cells, treated with indicated compound for 24 hours. (k-l) Immunoblotting for apoptotic markers in EOL-1 (k) or MV4;11 (l) cells after the indicated compound treatment. (m) Proliferation of the EZH2-depleted (sgEZH2) or control (sgEV) MOLM-13 cells, treated with DMSO or MS177 (0.1, 0.5 or 1 µM) for 48 hours (n=3; mean ± SD; unpaired two-tailed Student’s t-test). *, **, and *** denote the P value of < 0.05, 0.01 and 0.005, respectively. NS denotes not significant. Numerical source data, statistics, exact P values and unprocessed blots are available as source data.
Extended Data Fig. 9|
Extended Data Fig. 9|. MS177 represses MLL-r leukemia growth in multiple animal models established by human cell line xenograft or PDX.
(a) Violin plots showing complete blood counting (CBC) of white blood cells (WBC), red blood cells (RBC), neutrophils and lymphocytes, as well as hematocrit or hemoglobin, in C57BL/6 mice treated with either vehicle (n=3) or MS177 (with a dose of 100 mg/kg, BID, 6 days/week, i.p. [n=3]; or 200 mg/kg, BID, 3 days/week, i.p. [n=2]) on day 5, 10, 15 and 21. The boundaries of the violin plots indicate the 25th and 75th percentiles. (b) The body weight change of C57BL/6 mice treated with either vehicle (n=3; mean ± SD) or MS177 (100 mg/kg, BID, 6 days/week, i.p. [n=3; mean ± SD]; or 200 mg/kg, BID, 3 days/week, i.p. [n=2; mean ± SD]) over a course of 21 days. (c-d) Flow cytometry-based analysis for the expression of human-specific cell surface antigens (~93% as hCD45+/hCD33+, c) and GFP (from a cell-labeling construct, d) among the splenic cells harvested from leukemic mice, established by intravenous (i.v.) injection of an MLL-r AML PDX line carrying the stably expressed luciferase/GFP reporter (PDX # 68555-Luc). (e-f) Body weight change of NSG-SGM3 mice bearing the MLL-r AML PDX tumors, xenografted either intravenously (e) or subcutaneously (s.c.; f), as measured from the starting time point of treatment with the indicated dose of vehicle or MS177 over a course of 21 days. Mean ± SD. (g) Body weight change of NSG mice bearing the subcutaneous RS4;11 cell xenografts, as measured from the starting point of treatment with the indicated dose of vehicle or MS177 over a course of 21 days. Mean ± SD. (h) Immunoblotting for the indicated proteins using a collection of the s.c. xenografted EOL-1 tumors, which were freshly isolated from NSG mice treated with vehicle or 200 mg/kg of MS177 (BID per day) for a total of 5 days. Numerical source data and unprocessed blots are available as source data.
Fig. 1|
Fig. 1|. EZH2 exhibits noncanonical PRC2-indepedent solo-binding in leukaemias.
Besides its canonical H3K27me3 cobound pattern, EZH2 exhibits additional noncanonical solo-binding at sites enriched for gene-activation-related histone marks, Pol II, (co)activators and cMyc in MLL-r leukaemia cells. a-d, Averaged signal intensities (a-b) and heatmaps (c-d) for EZH2 (either endogenous EZH2 or exogenously expressed HA-tagged EZH2), H3K27me3, histone acetylation (H3K27ac or H3K9ac) and H3K4me3 ± 5 kb from the centers of noncanonical EZH2+/H3K27me3- peaks (i.e., EZH2-”solo”; top panels) or canonical EZH2+/H3K27me3+ peaks (i.e., EZH2 ensemble; bottom panels) in either MV4;11 (a, c) or EOL-1 (b, d) cells. Except HA-EZH2, which was mapped via CUT&RUN, all the others were mapped via ChIP-seq. e, Venn diagram showing a significant overlap between EZH2-”solo”-binding sites identified in the two independent MLL-r leukaemia lines, MV4;11 and EOL-1. f-i, Heatmap for ChIP-seq signals of EZH2, POL II (f), MLL (MLLn and MLLc, g), BRD4 (h) and SWI/SNF (SMARCA4 and SMARCC1, i) ± 5 kb from the centers of EZH2-”solo”-binding sites in MV4;11 or EOL-1 cells. j, Significant enrichment of the Myc:MAX motif (CACGTG) at the EZH2-”solo” peaks in MV4;11 cells. k-l, Co-IP for EZH2 (k) or cMyc (l) interaction with endogenous POL II, SMARCA4 and SMARCB1 in EOL-1 cells using anti-EZH2 or anti-cMyc antibodies. m-n, Co-IP for endogenous EZH2 and cMyc interaction in EOL-1 cells using anti-EZH2 (m) or anti-cMyc antibodies (n). Classic PRC2 subunits, SUZ12 and EED, and MAX, the cMyc cofactor, were probed in IP samples. o-p, GST pulldown for assaying interaction of the in vitro translated HA-cMyc protein with recombinant GST-EZH2 (o) or GST-EED (p) protein. GST alone (lane 1) serves as control. Red arrows indicate GST and GST-fusion protein. q-r, Averaged ChIP-seq signal intensities (q) and heatmaps (r) for EZH2 and cMyc (using two independent antibodies, ab1 and ab2) ± 5 kb from the centers of noncanonical EZH2-”solo” peaks (left) or canonical EZH2 ensemble peaks (right) in MV4;11 (top) or EOL-1 (bottom) cells. s, Heatmaps for EZH2, H3K27me3, cMyc and H3K27ac signal intensities, detected by CUT&RUN in the MLL-AF9+ AML PDX cells, ± 5 kb from the centers of either EZH2-”solo” (top) or EZH2 ensemble (bottom) sites identified in MLL-AF4+ MV4;11 cells.
Fig. 2|
Fig. 2|. Cooperative EZH2 and cMyc recruitment to common targets leads to gene activation in leukaemia.
a, Venn diagram using differentially expressed genes (DEGs), down-regulated based on RNA-seq analysis after EZH2 knockdown (KD; shEZH2) or cMyc knockout (KO; by either sgcMyc-1 or sgcMyc-5) in MV4;11 cells (n = 2 biologically independent experiments). Threshold of DEG is set as adjusted DESeq P value (q) < 0.05, fold-change (FC) > 1.25 and mean tag counts > 10. |FC| indicates the absolute value of FC. b, Averaged signal intensities of EZH2 (endogenous EZH2 or exogenously expressed HA-EZH2), cMyc, H3K27ac, H3K9ac and H3K27me3 around the genes co-upregulated by EZH2 and cMyc in MV4;11 cells (n = 204; defined in a). TSS, transcriptional start site; TES, transcriptional end site. c, GO analysis (top) and enrichment of the DisGeNet category (bottom) using genes co-upregulated by EZH2 and cMyc shown in a. d, Heatmap using the indicated RNA-seq sample comparison shows log2-converted ratios of the 204 genes co-upregulated by EZH2 and cMyc in MV4;11 cells (n = 2 biologically independent experiments). Genes with the EZH2-”solo”:cMyc co-binding are labeled. EV, empty vector. e-f, IGV view of enrichment for the indicated factor at TPD52 (e) and IRF2BPL (f) in MV4;11 cells. g-h, Kaplan-Meier survival analysis based on the TPD52 (g) or IRF2BPL (h) expression in patient samples of the TCGA AML cohort. Statistical significance was determined by log-rank test. i-j, RT-qPCR for the indicated EZH2:cMyc-cotargeted gene following EZH2 KD or cMyc KO (i), or after a 24-hour treatment with 2.5 μM of UNC6852, C24 or A-485 (j), in MV4;11 cells. Y-axis shows averaged signals after normalization to GAPDH and to mock-treated (n = 3; mean ± SD; unpaired two-tailed Student’s t-test). k-l, ChIP-qPCR for cMyc and EZH2 at the indicated EZH2:cMyc-cotargeted gene promoter in MV4;11 cells post-depletion of cMyc (k) or EZH2 (l). Y-axis shows averaged signals after normalization to input and then to EV controls (n = 3; mean ± SD; unpaired two-tailed Student’s t-test). *, **, and *** denote the P value of < 0.05, 0.01 and 0.005, respectively. NS denotes not significant. Numerical source data, statistics and exact P values are available as source data.
Fig. 3|
Fig. 3|. EZH2 directly interacts with cMyc and coactivators via EZH2-TAD, promoting malignant growth of leukaemia cells.
a, EZH2-TAD, highlighted in green, contains typical Φ-Φ-x-x-Φ motifs, with asterisks indicating aromatic residues important for transactivation. b-c, Schematic of GAL4-based luciferase reporter assays (b) and summary (c) of reporter activities of EZH2-TAD, either WT or mutant, compared to EV. Y-axis shows relative activation after normalization to internal control (Renilla luciferase) and then to EV-transduced mock (n = 3; mean ± SD; unpaired two-tailed Student’s t-test). DBD, DNA-binding domain. d-e, Pull-down using GST alone or GST-EZH2-TAD, either WT (d) or TAD-dead-mutant (e), and the in vitro translated (IVT) protein of HA-cMyc or 293T cell lysate containing the transiently expressed HA-p300. FA, F145A+F171A; FK, F145K+F171K. f, Domain organization of cMyc (top) and pull-down (bottom) using GST alone or GST-EZH2-TAD and 293T cell lysate containing the transiently expressed HA-cMyc with serial truncation. NTD, CD and CTD indicate the N-terminal, central and C-terminal domain, respectively. g-h, ITC binding curve using recombinant EZH2-TAD, either WT (g) or TAD-dead-mutant (h), and purified cMyc-CD (n=3; means ± SD). i, Pull-down using GST-EZH2-TAD, WT or mutant, and recombinant His6x-p300 protein. j, Co-IP for endogenous cMyc and the stably expressed full-length HA-EZH2, either WT or TAD-dead-mutant, in 293T cells. k-m, Immunoblotting of the indicated protein (k), cell proliferation (l) and RT-qPCR of EZH2:cMyc-coactivated genes (m) after doxycycline-induced depletion of endogenous EZH2 in MV4;11 cells, pre-rescued with exogenous shEZH2-resistant HA-EZH2, either WT or TAD-dead-mutant (FA or FK). Teton, doxycycline (dox)-inducible Tet-On vector. For l and m, n = 3, mean ± SD; for m, unpaired two-tailed Student’s t-test was used. n, ChIP-qPCR of HA-EZH2, either WT or TAD-dead-mutant, at the indicated EZH2:cMyc-cotargeted gene using the same MV4;11 cells shown in k-m. Y-axis shows signals after normalization to those from input and then to WT HA-EZH2-transduced cells (n = 3; mean ± SD; unpaired two-tailed Student’s t-test). EV-transduced cells serve as a negative control. *, **, and *** denote the P value of < 0.05, 0.01 and 0.005, respectively. NS denotes not significant. Numerical source data, statistics, exact P values and unprocessed blots are available as source data.
Fig. 4|
Fig. 4|. Characterization of the EZH2-targeting PROTAC, MS177.
a, Structure of C24, MS177, MS177N1 and MS177N2. b, EZH2-inhibitory effect of the indicated compound in the in vitro methyltrasferase assay (n= 2; mean ± SD). c, Immunoblotting of various histone modifications in HeLa cells after a 24-hour treatment with the indicated compound (5 µM). d, Immunoblotting of PRC2 subunits and H3K27 methylation in EOL-1 cells, treated with the indicated concentration of MS177, versus DMSO, for 16 hours. e, Measurement of DC50 value of MS177, based on EZH2 immunoblotting signals in EOL-1 cells after treatment (n=2; mean ± SD). f, Immunoblotting of EZH2 and H3K27me3 in MV4;11 cells after the indicated compound treatment for 24 hours. g, Time-dependent EZH2 depletion by MS177 (5 µM) in EOL-1 cells. h, EZH2 immunoblotting in EOL-1 cells first treated with 0.5 µM of MS177 for 16 hours, followed by MS177 washout for the indicated time. i, Co-IP for EZH2 interaction with endogenous PRC2 and cMyc in MOLM-13 cells, treated with 2.5 µM of DMSO, C24 and MS177N1 for 24 hours. IgG (lane 1) serves as IP control. j, Upper: Ubiquitin (UB) immunoblotting (IB) after IP with anti-EZH2 antibodies using EOL-1 cells after the indicated compound treatment for 16 hours. Bottom: immunoblotting using input. k-l, Immunoblotting of PRC2 subunits in MV4;11 (k) and EOL-1 (l) cells pre-treated with DMSO (lanes 1–2) or C24 (0.5 µM; lane 3) for 2 hours, and then subjected to an additional treatment with DMSO or 2.5 µM of MS177 for 24 (k) or 14 hours (l). m-n, EZH2 immunoblotting using EOL-1 cells pre-treated with DMSO (lanes 1 and 3), pomalidomide (2.5 µM, m; lanes 2 and 4) or MLN4924 (0.4 µM, n; lanes 2 and 4) for 2 hours, and then subjected to an additional 14-hour treatment with DMSO (lanes 1–2) or MS177 (0.5 µM, lanes 3–4). o, Left: EZH2 immunoblotting using MM1.S cells, either wild-type (left) or with CRBN KO (CRBN-/-; right), after a 24-hour treatment with the indicated concentration of MS177. Right: Immunoblot showing CRBN KO. Numerical source data and unprocessed blots are available as source data.
Fig. 5|
Fig. 5|. MS177 exhibits the on-target inhibition effect on EZH2:PRC2.
a-d Heatmaps (a,c) and averaged plotting (b,d) of EZH2 (a-b) and H3K27me3 (c-d) ChIP-seq signal intensities (normalized against spike-in control and sequencing depth) around peak centers in EOL-1 and MV4;11 cells, treated for 16 and 24 hours, respectively, with 0.5 µM of DMSO, C24 or MS177. e-f, IGV view of EZH2 and H3K27me3 at THBS1 (e) and BACE1 (f) in the indicated cells. g, Venn diagram using DEGs de-repressed after MS177 versus DMSO treatment, as identified by RNA-seq in the three MLL-r leukaemia lines. Threshold of DEG is set as q < 0.01, FC > 1.5 and mean tag counts > 10. h-j, Overall expression of transcripts upregulated after MS177 versus DMSO treatment across the indicated samples of MV4;11 (h), MOLM-13 (i) and EOL-1 (j) cells. Y-axis represents Log10-converted RNA-seq signals. Paired two-sided t-test was used. k, Immunoblotting showing EZH2 KO. l, Venn diagram using DEGs upregulated in EOL-1 cells post-treatment of MS177 and those after EZH2 KO, relative to mock. DEG is defined as above. m-n, Heatmap (m) and boxplot (n) showing expression of the EZH2-repressed transcripts in EOL-1 cells, treated with 0.5 µM of DMSO, C24 or MS177 for 16 hours (n = 2). EZH2-repressed genes are defined in l after EZH2 KO versus mock. Paired two-sided t-test was used. Rep, replicate. o-p, GSEA revealing MS177 treatment (left) and EZH2 KO (right) in EOL-1 cells positively correlated with upregulation of the PRC2:EED-repressed (o) or H3K27me3-bound (p) genes. q, RT-qPCR of the EZH2-repressed targets in EOL-1 cells post-treatment with 0.5 µM of DMSO, C24 or MS177 for 16 hours. Y-axis shows signals after normalization to GAPDH and to DMSO-treated (n = 3; mean ± SD; unpaired two-tailed Student’s t-test). For h-j and n, the boundaries of boxplots indicate the 25th and 75th percentiles, the center line indicates the median, and the whiskers (dashed) indicate 1.5× the interquartile range. *, **, and *** denote P < 0.05, 0.01 and 0.005, respectively. NS denotes not significant. Numerical source data, statistics, exact P values and unprocessed blots are available as source data.
Fig. 6|
Fig. 6|. MS177 represses the cMyc-related oncogenic node.
a, Heatmaps showing EZH2 ChIP-seq signals around the centers of EZH2-’solo’-binding peaks in EOL-1 and MV4;11 cells, treated for 16 and 24 hours, respectively, with 0.5 µM of DMSO, C24 or MS177. b, EZH2 binding at TPD52, IRF2BPL and GADD45B in the indicated cells. c-d, cMyc immunoblotting using MV4;11 (c) and EOL-1 (d) cells after the indicated compound treatment. e, Immunoblotting for the indicated protein in EOL-1 cells, treated with EED-targeting PROTAC (UNC6852) or its non-PROTAC analog (UNC7043) for 24 hours. f, cMyc immunoblotting using wildtype or CRBN-deficient (CRBN-/-) MM1.S cells, treated with MS177 versus DMSO for 24 hours. g, Left: immunoblotting showing EZH2 KO. Right: cMyc immunoblotting using EZH2-depleted or mock-treated MOLM-13 cells, treated with 5 µM of MS177 for 6 or 8 hours, versus DMSO. h, cMyc immunoblotting in EOL-1 cells first treated with 0.5 µM of MS177 for 16 hours and then subjected to MS177 washout for the indicated time, compared to DMSO-treated mock. i, cMyc ubiquitination immunoblotting using EOL-1 cells treated with 5 µM of MS177 versus DMSO for 4 hours. j-k, Immunoblotting (j) and RT-PCR for cMyc (k; n = 3; mean ± SD) in EOL-1 and MV4;11 cells, treated with 5 µM of MS177 versus DMSO for 4 hours. l-m, Immunoblotting (left) and degradation curve (right) of cMyc (l) or EZH2 (m) in DMSO- or MS177-treated EOL-1 cells in the presence of cycloheximide (CHX; n=2 independent experiments; mean ± SD). n, Summary of GSEA results showing correlation of the indicated MYC-related genesets with MS177 treatment or cMyc KO (sgcMyc), relative to mock. Green and red in heatmap indicate positive and negative correlations, respectively, NES, normalized enrichment score. o, RT-qPCR for cMyc-upregulated targets in MV4;11 cells after the indicated compound treatment for 24 hours. Y-axis shows signals after normalization to GAPDH and to DMSO-treated cells (n = 3; mean ± SD; unpaired two-tailed Student’s t-test). *, **, and *** denote P < 0.05, 0.01 and 0.005, respectively. NS denotes not significant. Numerical source data, statistics, exact P values and unprocessed blots are available as source data.
Fig. 7|
Fig. 7|. MS177 efficiently induces leukaemia cell growth inhibition, apoptosis, and cell cycle progression arrest.
a, EC50 values of MS177 in the indicated AML cell lines (left) and patient samples (right) after a 4-day treatment (n=3). b, MOLM-13 cell growth after a 48-hour treatment with different concentration of C24, MS177, MS177N1 or MS177N2, relative to DMSO. Y-axis shows mean ± SD after normalization to DMSO-treated (n = 3). c-e, Effect of a 48-hour treatment with various concentration of MS177, relative to DMSO, on proliferation of four primary AML samples (c) or paired cells from de-identified patients, either in remission or with diagnosed AML (d-e). Y-axis shows mean ± SD after normalization to mock (n = 3) . f-g, Immunoblotting for the indicated protein in two primary AML samples, treated with DMSO, MS177 or C24 for 24 (f) and 36 (g) hours. h-j, H3K27me3 immunoblotting (h) and growth (i-j) of EOL-1 cells, treated with the indicated concentration of various EZH2 catalytic inhibitors (h-i), MS177 (i) or UNC6852 (j) for 48 hours (n=3; mean ± SD; unpaired two-tailed Student’s t-test). k, Colony formation by murine hematopoietic stem/progenitor cells (HSPCs) in the presence of DMSO or MS177 (n=2; mean ± SD). l-m, Immunoblotting of the indicated protein (l) and growth (m) of MV4;11 cells, treated with 2.5 µM of DMSO, MS177, MS177N2, C24, pomalidomide (Pom), or C24 plus Pom. Y-axis in k shows mean ± SD after normalization to DMSO-treated (n = 3; unpaired two-tailed Student’s t-test). n-o, Representative image (n) and quantification of colony formation (o; mean ± SD of two experiments) using MV4;11 cells treated with the indicated compound. p, MOLM-13 cell cycle analysis after a 24-hour treatment with the indicated compound. q-r, Immunoblotting for various apoptotic markers post-treatment of AML patient cells (q), or the mock-treated (sgEV) or EZH2-depleted (sgEZH2) MOLM-13 cells (r), with the indicated compound for 24 hours. *, **, and *** denote the P value of < 0.05, 0.01 and 0.005, respectively. NS denotes not significant. Numerical source data, statistics, exact P values and unprocessed blots are available as source data.
Fig. 8|
Fig. 8|. MS177 represses AML growth in vivo.
a, Intra-plasma concentrations of MS177 over a 12-hour period after a single indicated intraperitoneal (i.p.) injection into male Swiss Albino mice (n = 6; mean ± SEM from three mice per time point). b-d, Bioluminescent imaging (b) and signal levels (c) and Kaplan-Meier curve (d) of NSG-SGM3 mice transplanted intravenously (i.v.) with the luciferase (luc)-labeled MLL-r AML PDX cells, which were then treated with vehicle or the indicated MS177 dosing (n = 5 mice per group; mean ± SD). Statistical significance was determined by two-way ANOVA (c) or log-rank (Mantel-cox, d) test. e-f, Averaged tumor volume (e, g-h) and Kaplan-Meier curve (f) of mice subcutaneously (s.c.) transplanted with MLL-r AML PDX (e-f), RS4;11 (g) or EOL-1 cells (h), which were then treated with vehicle or the indicated MS177 dosing (n = 5 per group; mean ± SD). Statistical significance was determined by two-way ANOVA (e), log-rank test (f) or unpaired two tailed student’s t-test (h; boxplot shows mean and interquartile range). i, Immunoblotting for the indicated protein using the collected RS4;11 s.c. xenografted tumors, freshly isolated from NSG mice that were treated with vehicle or the indicated MS177 dosing for 5 days. j, Intra-plasma and intra-tumor concentration of MS177 in NSG mice in h, treated with vehicle or the indicated MS177 dosing (n = 4 per group). Dots represent individual tumors. k, RT-qPCR for the EZH2-repressed target in the EOL-1 s.c. xenografted tumors as isolated in i. Y-axis shows mean ± SD after normalization to GAPDH and then to vehicle-treated (n = 3; unpaired two-tailed Student’s t-test). l, A model that, in MLL-r leukaemias, EZH2 forms canonical (EZH2:PRC2) and noncanonical (EZH2:cMyc:coactivators) interactions for promoting target gene repression and activation, respectively, both of which mediate oncogenesis (top). These oncogenic actions of EZH2 can be suppressed by the EZH2 PROTAC degrader, MS177 (bottom). *, **, and *** denote the P value of < 0.05, 0.01 and 0.005, respectively. NS denotes not significant. Numerical source data, statistics, exact P values and unprocessed blots are available as source data.

Similar articles

Cited by

References

    1. Yu JR, Lee CH, Oksuz O, Stafford JM & Reinberg D PRC2 is high maintenance. Genes & development 33, 903–935 (2019). - PMC - PubMed
    1. Guo Y, Zhao S & Wang GG Polycomb Gene Silencing Mechanisms: PRC2 Chromatin Targeting, H3K27me3 ‘Readout’, and Phase Separation-Based Compaction. Trends Genet 37, 547–565 (2021). - PMC - PubMed
    1. Kim KH & Roberts CW Targeting EZH2 in cancer. Nature medicine 22, 128–134 (2016). - PMC - PubMed
    1. Xu B, Konze KD, Jin J & Wang GG Targeting EZH2 and PRC2 dependence as novel anticancer therapy. Exp Hematol 43, 698–712 (2015). - PMC - PubMed
    1. Wang X et al. Clinical and prognostic relevance of EZH2 in breast cancer: A meta-analysis. Biomed Pharmacother 75, 218–225 (2015). - PubMed

References used for supplementary materials:

    1. Wan L et al. ENL links histone acetylation to oncogenic gene expression in acute myeloid leukaemia. Nature 543, 265–269 (2017). - PMC - PubMed
    1. Wang GG, Pasillas MP & Kamps MP Persistent transactivation by meis1 replaces hox function in myeloid leukemogenesis models: evidence for co-occupancy of meis1-pbx and hox-pbx complexes on promoters of leukaemia-associated genes. Molecular and cellular biology 26, 3902–3916 (2006). - PMC - PubMed
    1. Cai L et al. ZFX Mediates Non-canonical Oncogenic Functions of the Androgen Receptor Splice Variant 7 in Castrate-Resistant Prostate Cancer. Molecular cell 72, 341–354 e346 (2018). - PMC - PubMed
    1. Yu X et al. A selective WDR5 degrader inhibits acute myeloid leukaemia in patient-derived mouse models. Sci Transl Med 13, eabj1578 (2021). - PMC - PubMed
    1. Li J et al. ZMYND11-MBTD1 induces leukemogenesis through hijacking NuA4/TIP60 acetyltransferase complex and a PWWP-mediated chromatin association mechanism. Nat Commun 12, 1045 (2021). - PMC - PubMed

Publication types

MeSH terms

Substances