. 2022 Apr;6(4):375-382.
doi: 10.1038/s41559-022-01663-9. Epub 2022 Feb 24.

Alternative stable states of the forest mycobiome are maintained through positive feedbacks

Affiliations

Alternative stable states of the forest mycobiome are maintained through positive feedbacks

Colin Averill et al. Nat Ecol Evol. 2022 Apr.

Abstract

Most trees on Earth form a symbiosis with either arbuscular mycorrhizal or ectomycorrhizal fungi. By forming common mycorrhizal networks, actively modifying the soil environment and other ecological mechanisms, these contrasting symbioses may generate positive feedbacks that favour their own mycorrhizal strategy (that is, the con-mycorrhizal strategy) at the expense of the alternative strategy. Positive con-mycorrhizal feedbacks set the stage for alternative stable states of forests and their fungi, where the presence of different forest mycorrhizal strategies is determined not only by external environmental conditions but also mycorrhiza-mediated feedbacks embedded within the forest ecosystem. Here, we test this hypothesis using thousands of US forest inventory sites to show that arbuscular and ectomycorrhizal tree recruitment and survival exhibit positive con-mycorrhizal density dependence. Data-driven simulations show that these positive feedbacks are sufficient in magnitude to generate and maintain alternative stable states of the forest mycobiome. Given the links between forest mycorrhizal strategy and carbon sequestration potential, the presence of mycorrhizal-mediated alternative stable states affects how we forecast forest composition, carbon sequestration and terrestrial climate feedbacks.


Conflict of interest statement

Competing Interests Statement: Authors declare no competing interests.

Figures

Extended Data Fig 1
Extended Data Fig 1
Extended Data Fig 2
Extended Data Fig 2
Extended Data Fig 3
Extended Data Fig 3
Extended Data Fig 4
Extended Data Fig 4
Extended Data Fig 5
Extended Data Fig 5
Extended Data Fig 6
Extended Data Fig 6
Extended Data Fig 7
Extended Data Fig 7
Extended Data Fig 8
Extended Data Fig 8
Fig 1
Fig 1. Bi-modality of mycorrhizal forests across the Eastern U.S.
(A) the spatial distribution of 6,965 forest inventory sites used in this analysis. Colors represent the relative abundance of ectomycorrhizal trees within a plot (purple = 100% ectomycorrhizal; green = 100% arbuscular mycorrhizal). (B) Histogram of the relative abundance of ectomycorrhizal trees by basal area across North America. Values of 1 reflect forests with 100% ectomycorrhizal dominance and no arbuscular mycorrhizal trees, while values of 0 reflect forests with 100% arbuscular mycorrhizal dominance and no ectomycorrhizal trees. (C) The same data as presented in panel B, after removing environmental signals using statistical models.
Fig 2
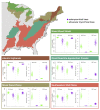
Fig 2. Positive con-mycorrhizal feedbacks observed in tree recruitment and survival.
(A) survival probability of an individual arbuscular mycorrhizal (AM) tree (green) or ectomycorrhizal (EM) tree (purple) within a forest stand where all other trees are either arbuscular or ectomycorrhizal. Plotted values are estimates based on the full model, holding environmental conditions and stand structure constant, and drawn from the model 95% confidence interval. (B) Difference in survival probability of individual tree species under EM relative to AM conditions. Differences are calculated on the logit-linear scale of the model. Positive values indicate an individual of a given tree species is more likely to survive within an EM dominated forest, and negative values indicate an individual is more likely to survive within an AM forest. Error bars represent the 95% confidence interval of the difference in means. (C) Recruitment rate of new arbuscular and ectomycorrhizal trees into a forest already dominated by arbuscular or ectomycorrhizal trees. Plotted values are estimates based on the full model, holding environmental conditions and stand structure constant, and drawn from the model 95% confidence interval. (D) Difference in recruitment rates of individual tree species under EM relative to AM conditions. Differences are calculated on the log-linear scale of the model. Positive values indicate an individual of a given tree species is more likely to recruit within an EM dominated forest, and negative values indicate an individual is more likely to recruit within an AM forest. Error bars represent the 95% confidence interval of the difference in means.
Fig 3
Fig 3. Simulating forest feedbacks.
Histogram represents the relative abundance of EM trees within 1,000 simulated forests plots after 100 years. Colors represent the relative abundance of ectomycorrhizal trees within a plot (purple = 100% ectomycorrhizal; green = 100% arbuscular mycorrhizal). (A) Outcome of null demographic simulations, driven by growth, recruitment and mortality models fit without con-mycorrhizal density predictors. Very few plots are dominated by all AM or all EM trees. (B) Outcome of demographic simulations driven by growth, recruitment and mortality models fit with con-mycorrhizal density predictors. Plots dominated by AM or EM trees are the most common frequency categories.
Fig 4
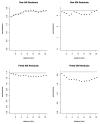
Fig 4. Hysteresis in mycorrhizal strategies across a nitrogen deposition gradient.
(A) Environmental filtering predicts the relative abundance of AM vs. EM trees across a landscape as a function of nitrogen deposition should be driven by environmental filtering, and independent of the initial distribution of AM vs. EM forests. (B) If alternative stable states are present then the relative abundance of AM vs. EM trees should exhibit hysteresis in response to N deposition. The relative abundance depends not only on environmental conditions but also the initial community state of the forest (initially AM or EM dominated). (C) Results of two sets of demographic simulations where 80% regenerating forests started in an EM dominated state (purple line) or an AM dominated state (green line). Shaded regions represent the 95% bootstrap confidence interval of the mean relative abundance of EM trees across each set of forest simulations.

References

    1. van der Heijden MGA, Martin FM, Selosse M-A, Sanders IR. Mycorrhizal ecology and evolution: the past, the present, and the future. New Phytologist. 2015;205:1406–1423. - PubMed
    1. McGuire KL. Common ectomycorrhizal networks may maintain monodominance in a tropical rain forest. Ecology. 2007;88:567–574. - PubMed
    1. Selosse M-A, Richard F, He X, Simard SW. Mycorrhizal networks: des liaisons dangereuses? Trends in Ecology & Evolution. 2006;21:621–628. - PubMed
    1. Simard SW, et al. Net transfer of carbon between ectomycorrhizal tree species in the field. Nature. 1997;388:579–582.
    1. Klein T, Siegwolf RTW, Korner C. Belowground carbon trade among tall trees in a temperate forest. Science. 2016;352:342–344. - PubMed

Publication types