. 2022 May;28(5):934-938.
doi: 10.1038/s41591-022-01736-z. Epub 2022 Feb 24.

Modeling comparative cost-effectiveness of SARS-CoV-2 vaccine dose fractionation in India

Affiliations

Modeling comparative cost-effectiveness of SARS-CoV-2 vaccine dose fractionation in India

Zhanwei Du et al. Nat Med. 2022 May.

Abstract

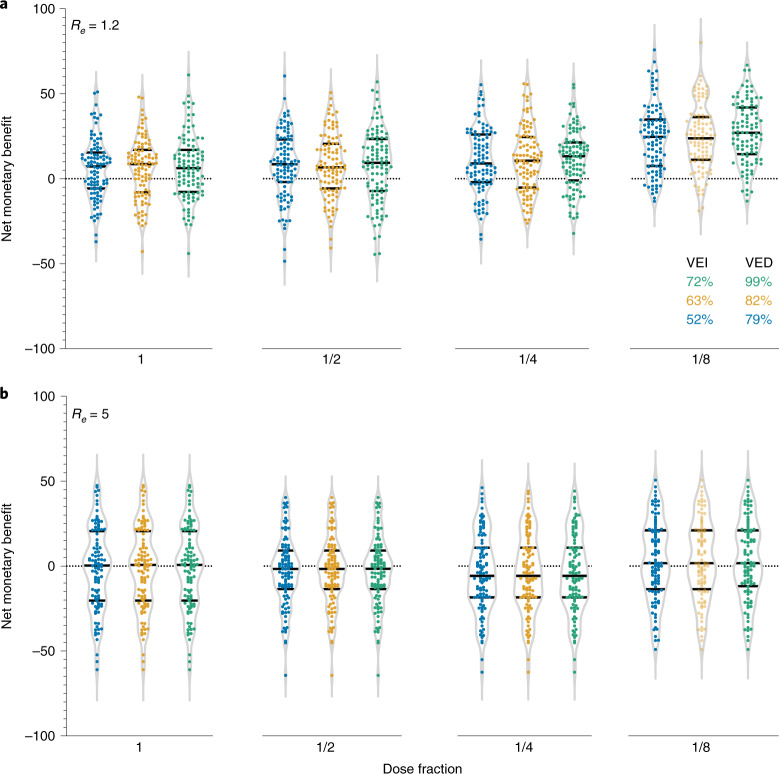
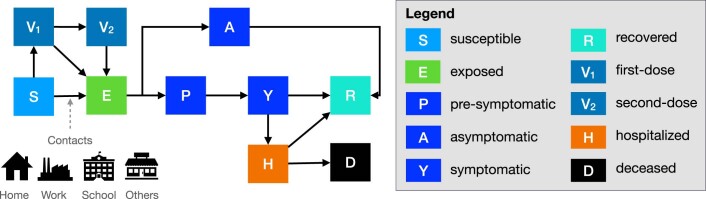
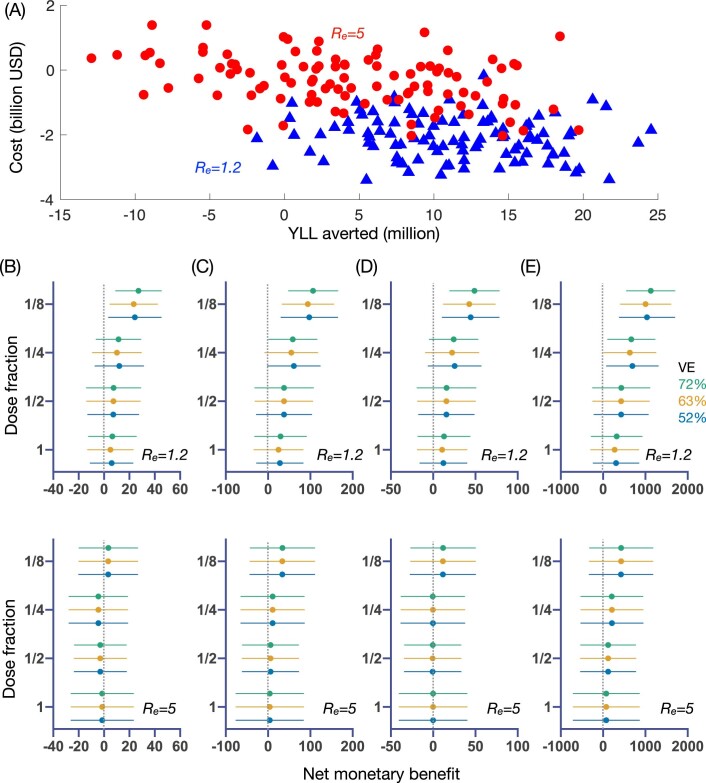
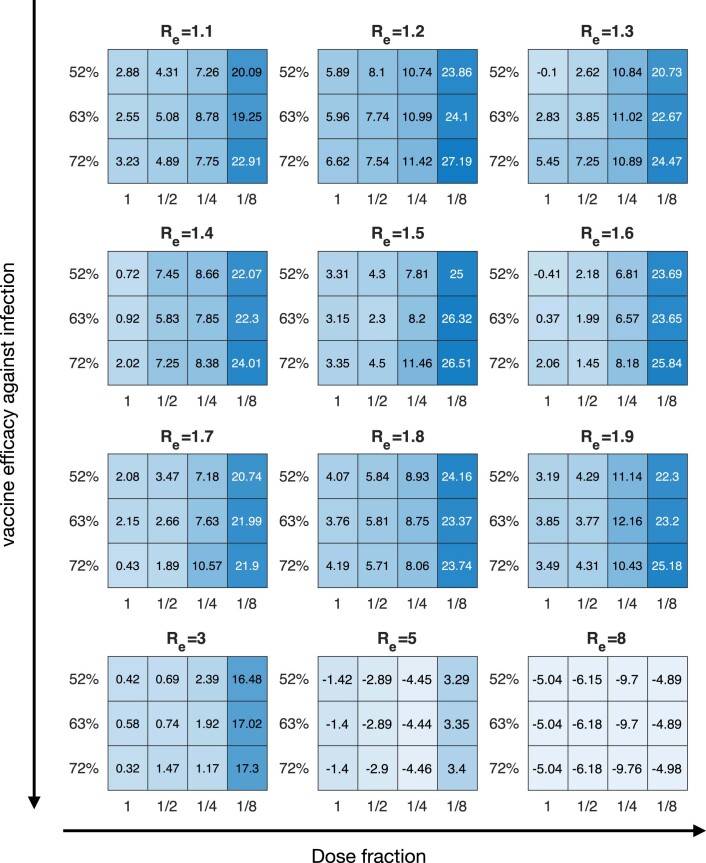
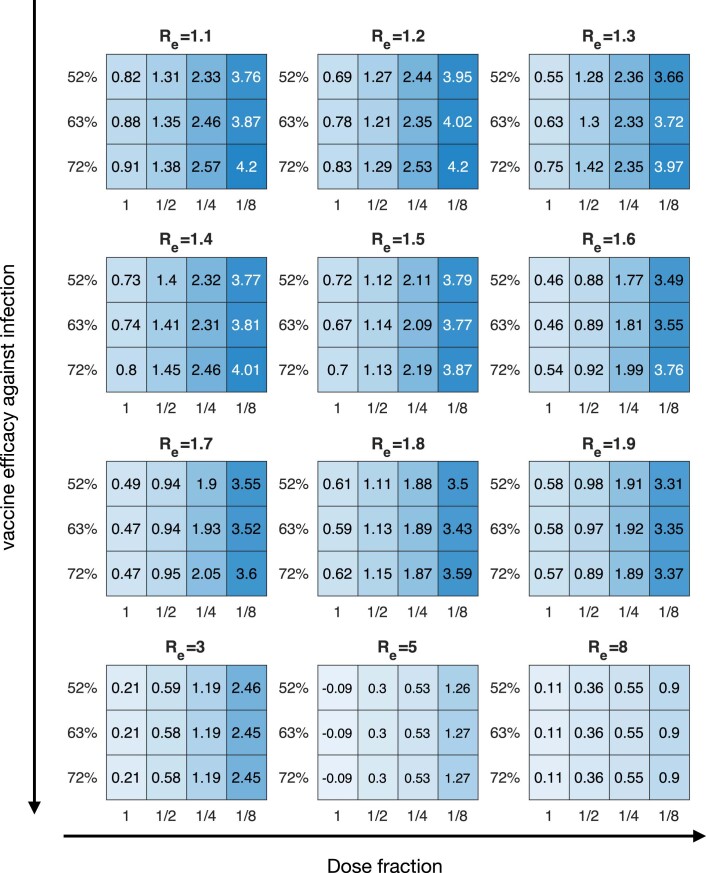
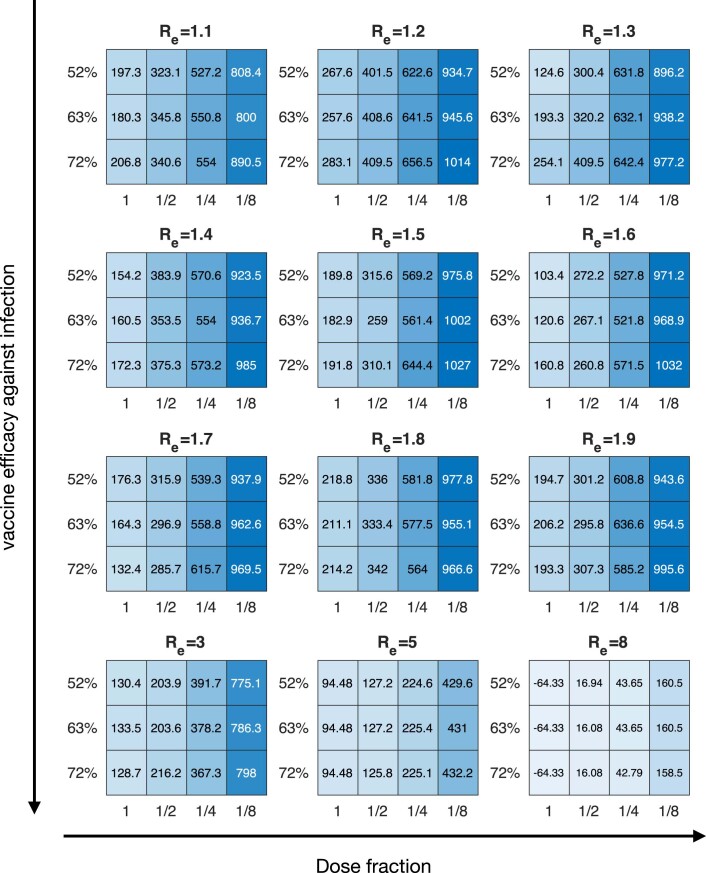
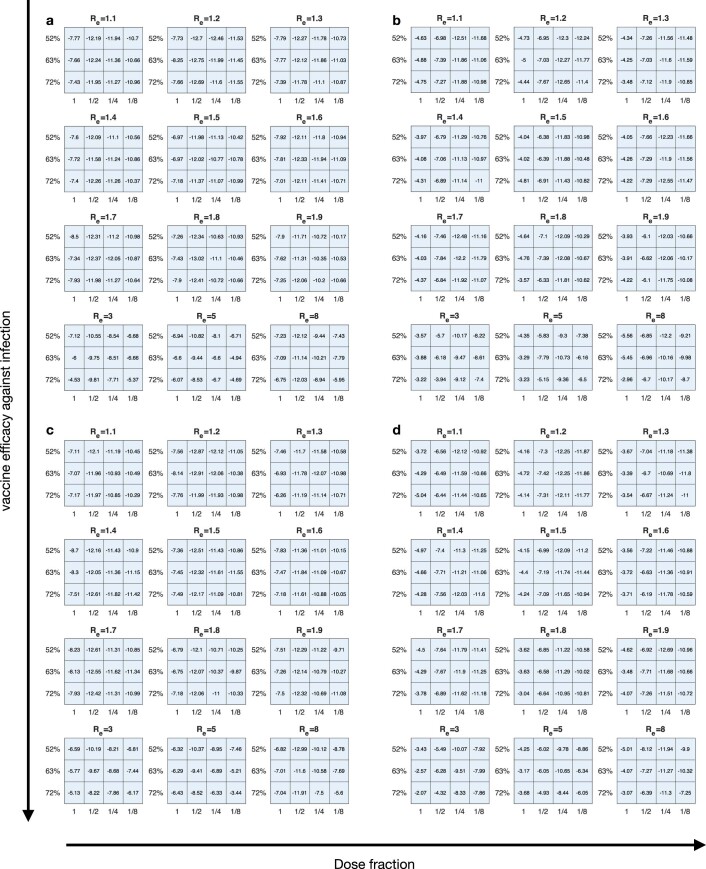
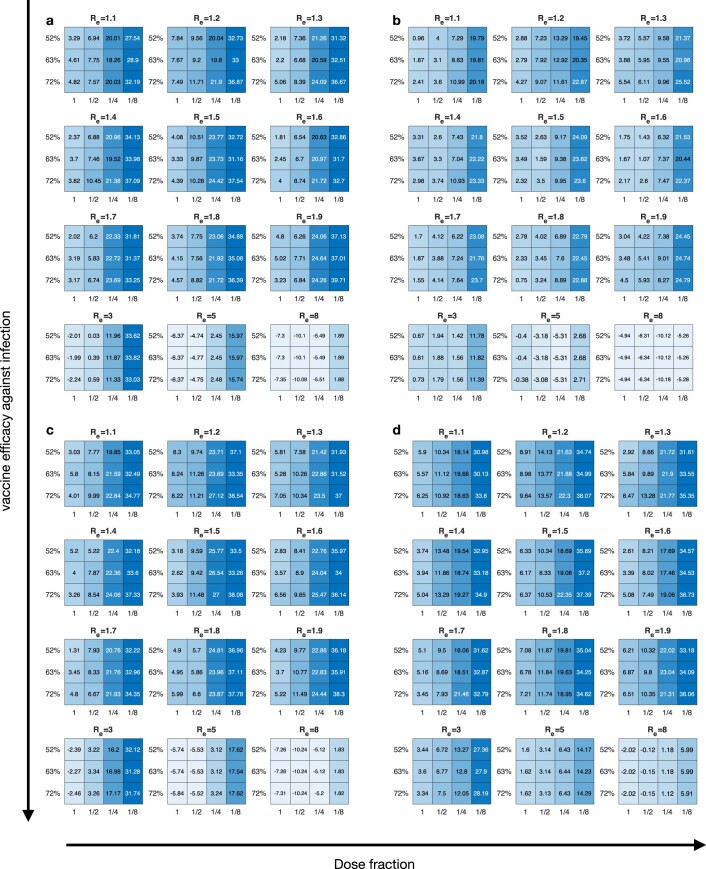
Given global Coronavirus Disease 2019 (COVID-19) vaccine shortages and inequity of vaccine distributions, fractionation of vaccine doses might be an effective strategy for reducing public health and economic burden, notwithstanding the emergence of new variants of concern. In this study, we developed a multi-scale model incorporating population-level transmission and individual-level vaccination to estimate the costs of hospitalization and vaccination and the economic benefits of reducing COVID-19 deaths due to dose-fractionation strategies in India. We used large-scale survey data of the willingness to pay together with data of vaccine and hospital admission costs to build the model. We found that fractional doses of vaccines could be an economically viable vaccination strategy compared to alternatives of either full-dose vaccination or no vaccination. Dose-sparing strategies could save a large number of lives, even with the emergence of new variants with higher transmissibility.


Conflict of interest statement

B.J.C. consults for AstraZeneca, GlaxoSmithKline, Moderna, Pfizer, Roche and Sanofi Pasteur. B.J.C. is supported by the AIR@innoHK program of the Innovation and Technology Commission of the Hong Kong Special Administrative Region Government. All other authors declare no competing interests.

Figures

Fig. 1
Fig. 1. Estimation of the expected gain in the NMB for each vaccination strategy as compared to the status quo strategy (that is, no vaccination) in India.
a, Estimation given the effective reproductive number Re = 1.2. b, Estimation given Re = 5. In a and b, each sub-panel from left to right corresponds to the two-dose vaccination using full dosing, 1/2 dosing, 1/4 dosing and 1/8 dosing, respectively. Each dot indicates one realization of the 100 stochastic simulations. Color scheme indicates the vaccine efficacy against infection (VEI) and vaccine efficacy against symptomatic disease (VED). The WTP per averted YLL per age group is based on data from the Centre for Monitoring Indian Economy’s Consumer Pyramids Household Survey (Methods). Extended Data Fig. 2 provides the sensitivity analyses using other possible WTP per averted YLL.
Extended Data Fig. 1
Extended Data Fig. 1. Schematic of the individual-based model of SARS-CoV-2 transmission and vaccination.
Following infection from age-specific contacts in home, work, school or others, susceptible individuals (S) become exposed (E), during which they are infected but not yet infectious or symptomatic. After the incubation period, each infected case becomes asymptomatic (A), in which the asymptomatic case has a reduced infectiousness before recovery (R). The remaining infected cases progress to be pre-symptomatic (P), during which they have a moderate infectiousness with no symptoms. The pre-symptomatic cases progress to symptomatic infectious (Y), with a subset becoming hospitalized (H) or deceased (D). Recovered individuals remain permanently protected from future infection. Vaccinated individuals progress to a one dose (V1) followed by a two dose compartment (V2) with different efficacies.
Extended Data Fig. 2
Extended Data Fig. 2. Estimation of the expected gain in the net monetary benefit (NMB) for each fractional-dose strategy as compared to status quo in India.
(A) An example for the estimated costs of fractionated dose strategies versus the averted years of life lost (YLLs) with reference to the no vaccine strategy. Each dot indicates one realization of the 100 stochastic simulations, given the use of 1/8 dose fractionation strategy with 72% vaccine efficacy against infection (VE) (blue triangle and red circle indicate the estimates given effective reproductive number Re = 1.2 and 5, respectively) and willingness to pay (WTP) per YLL averted of US$1,097, US$1,251, US$2,977, US$3,150, and US$3,205 for five age groups (0-5, 6-17, 18-49, 50-64, and > 65), respectively. (B) Estimated distributions for the expected gain in the NMB (2021 $ billion) over various vaccine efficacy against infection and fractional-dose strategy, given vaccine cost of US$12 and willingness to pay (WTP) per YLL averted of US$1,097, US$1,251, US$2,977, US$3,150, and US$3,205 for five age groups (0-5, 6-17, 18-49, 50-64, and > 65), respectively. Dots and error bars indicate the estimated mean and standard deviations, respectively. Colour scheme corresponds to the vaccine efficacy against infection. (C) Same as (B) but setting the WTP per averted YLL as US$10,517. (D) Same as (B) but setting the WTP per averted YLL as US$5089 (i.e., as in other middle-income countries such as Thailand). (E) Same as (B) but setting the WTP per averted YLL as US$100,000 (i.e., as in high-income countries such as theUS). Each subpanel in (B) to (E) uses 100 stochastic realizations to simulate theCOVID-19 transmission over each possible vaccine efficacy against infection (between 52% and 72%) and transmissibility (with effective reproduction number Re = 1.2 or 5). The optimal strategy given each transmission scenario is always estimated to be strategies with higher-fold fractionations, even if the vaccine efficacy against infection is not high. See Methods for the calculation of the NMB and supplementary materials for detailed values of vaccine costs and efficacy parameters.
Extended Data Fig. 3
Extended Data Fig. 3. Mean estimation (in 2021 US dollars) of the expected gain in the net monetary benefit (NMB) for each fractional-dose strategy as compared to the status quo strategy (i.e., no vaccination) in India.
The estimation examines a wide range of possible transmission (with Re increasing from 1.1 to 8) and vaccine efficacy (Supplementary Table 2) scenarios. Given each Re, the vaccine efficacy (VE) against infection and VE against symptomatic disease are considered as 52% and 79% in the top row, 63% and 82% in the middling row, and 72% and 99% in the bottom row in each subpanel. The vaccine cost in each strategy is considered as in Supplementary Table 4, and the WTP per YLL averted are US$1,097, US$1,251, US$2,977, US$3,150, and US$3,205 for five age groups 0-5, 6-17, 18-49, 50-64, and > 65, respectively. Under various transmission scenarios, the optimal strategy would always be the vaccination with higher-fold fractionations, even if the VE against infection and against symptomatic disease are not high.
Extended Data Fig. 4
Extended Data Fig. 4. Projected number of hospitalizations averted (million) for each fractional-dose strategy as compared to the status quo strategy (i.e., no vaccination) in India.
The estimation examines a wide range of possible transmission (with Re increasing from 1.1 to 8) and vaccine efficacy (Supplementary Table 2) scenarios. Given each Re, the vaccine efficacy (VE) against infection and VE against symptomatic disease are considered as 52% and 79% in the top row, 63% and 82% in the middling row, and 72% and 99% in the bottom row in each subpanel.
Extended Data Fig. 5
Extended Data Fig. 5. Projected number of deaths averted (thousand) for each fractional-dose strategy as compared to the status quo strategy (i.e., no vaccination) in India.
The estimation examines a wide range of possible transmission (with Re increasing from 1.1 to 8) and vaccine efficacy (Supplementary Table 2) scenarios. Given each Re, the vaccine efficacy (VE) against infection and VE against symptomatic disease are considered as 52% and 79% in the top row, 63% and 82% in the middling row, and 72% and 99% in the bottom row in each subpanel.
Extended Data Fig. 6
Extended Data Fig. 6. Sensitivity analysis on the expected gain in the NMB (2021 US dollars) for each fractional-dose strategy as compared to the status quo strategy (i.e., no vaccination) in India.
Each panel from (a) to (d) corresponds to a test scenario from V1 to V4 (Supplementary Table 5), respectively. Vaccine cost is considered as in Supplementary Table 4, and the WTP per YLL averted are considered as US$1,097, US$1,251, US$2,977, US$3,150, and US$3,205 for the five age groups 0-5, 6-17, 18-49, 50-64, and > 65, respectively.
Extended Data Fig. 7
Extended Data Fig. 7. Sensitivity analysis on the expected gain in the NMB (2021 US dollars) for each fractional-dose strategy as compared to the status quo strategy (i.e., no vaccination) in India.
Each panel from (a) to (d) corresponds to a test scenario from V5 to V8 (Supplementary Table 5), respectively. Vaccine cost is considered as in Supplementary Table 4, and the WTP per YLL averted are considered as US$1,097, US$1,251, US$2,977, US$3,150, and US$3,205 for the five age groups 0-5, 6-17, 18-49, 50-64, and > 65, respectively.

Similar articles

Cited by

References

    1. COVID-19 Dashboard by the Center for Systems Science and Engineering (CSSE) at Johns Hopkins University (JHU). https://gisanddata.maps.arcgis.com/apps/opsdashboard/index.html#/bda7594...
    1. Cowling BJ, et al. Impact assessment of non-pharmaceutical interventions against coronavirus disease 2019 and influenza in Hong Kong: an observational study. Lancet Public Health. 2020;5:e279–e288. doi: 10.1016/S2468-2667(20)30090-6. - DOI - PMC - PubMed
    1. Zimmer, C., Corum, J., Wee, S.-L. & Kristoffersen, M. Coronavirus Vaccine Tracker. The New York Timeshttps://www.nytimes.com/interactive/2020/science/coronavirus-vaccine-tra...
    1. Usher AD. A beautiful idea: how COVAX has fallen short. Lancet. 2021;397:2322–2325. doi: 10.1016/S0140-6736(21)01367-2. - DOI - PMC - PubMed
    1. Low & middle income. World Bank Group Development Data Group. https://data.worldbank.org/country/XO

Publication types