. 2022 Apr;18(4):412-421.
doi: 10.1038/s41589-022-00971-2. Epub 2022 Feb 24.

Deubiquitinase-targeting chimeras for targeted protein stabilization

Affiliations

Deubiquitinase-targeting chimeras for targeted protein stabilization

Nathaniel J Henning et al. Nat Chem Biol. 2022 Apr.

Abstract

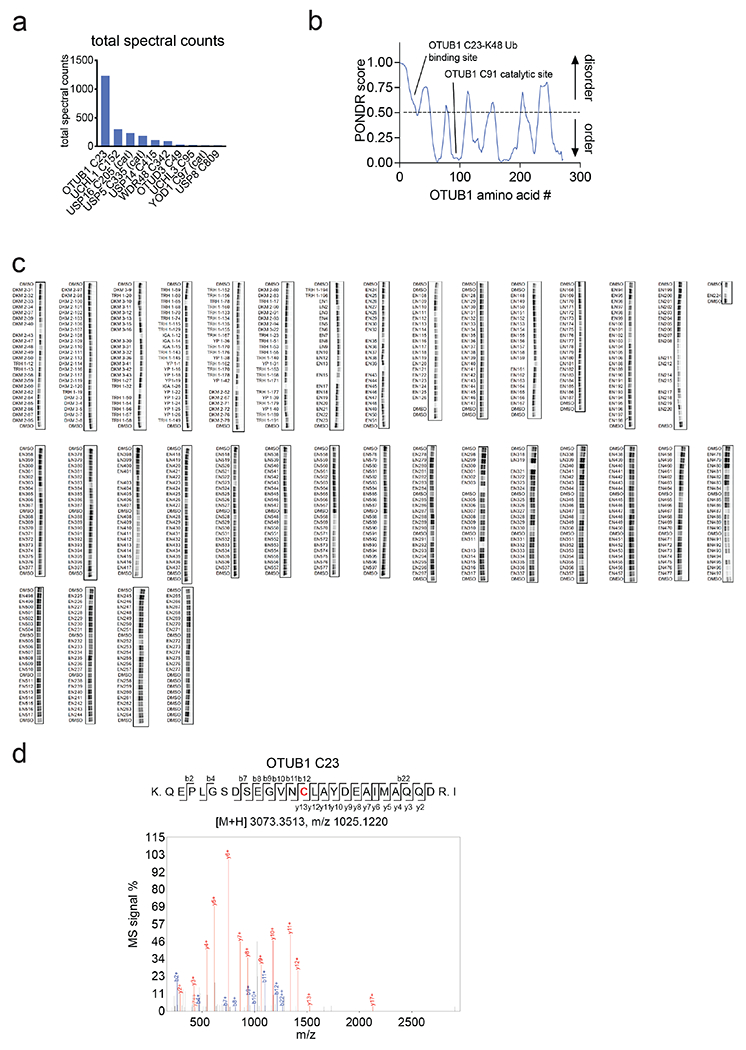
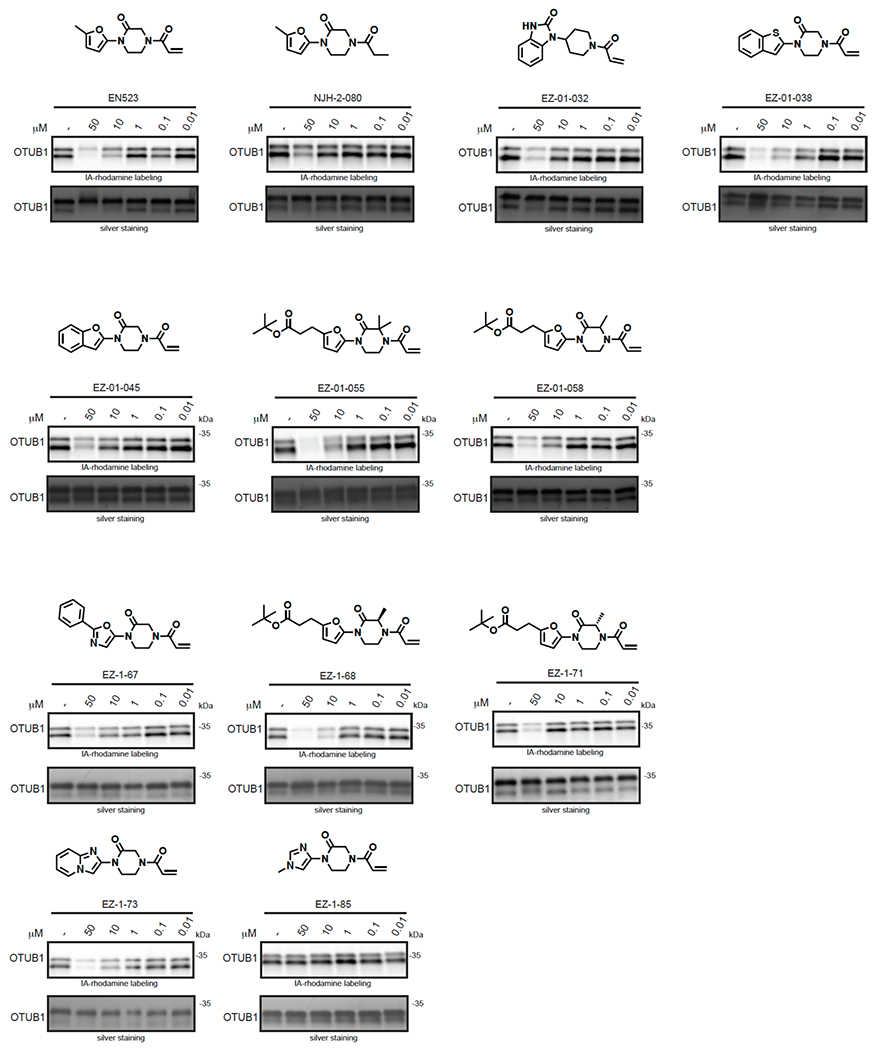
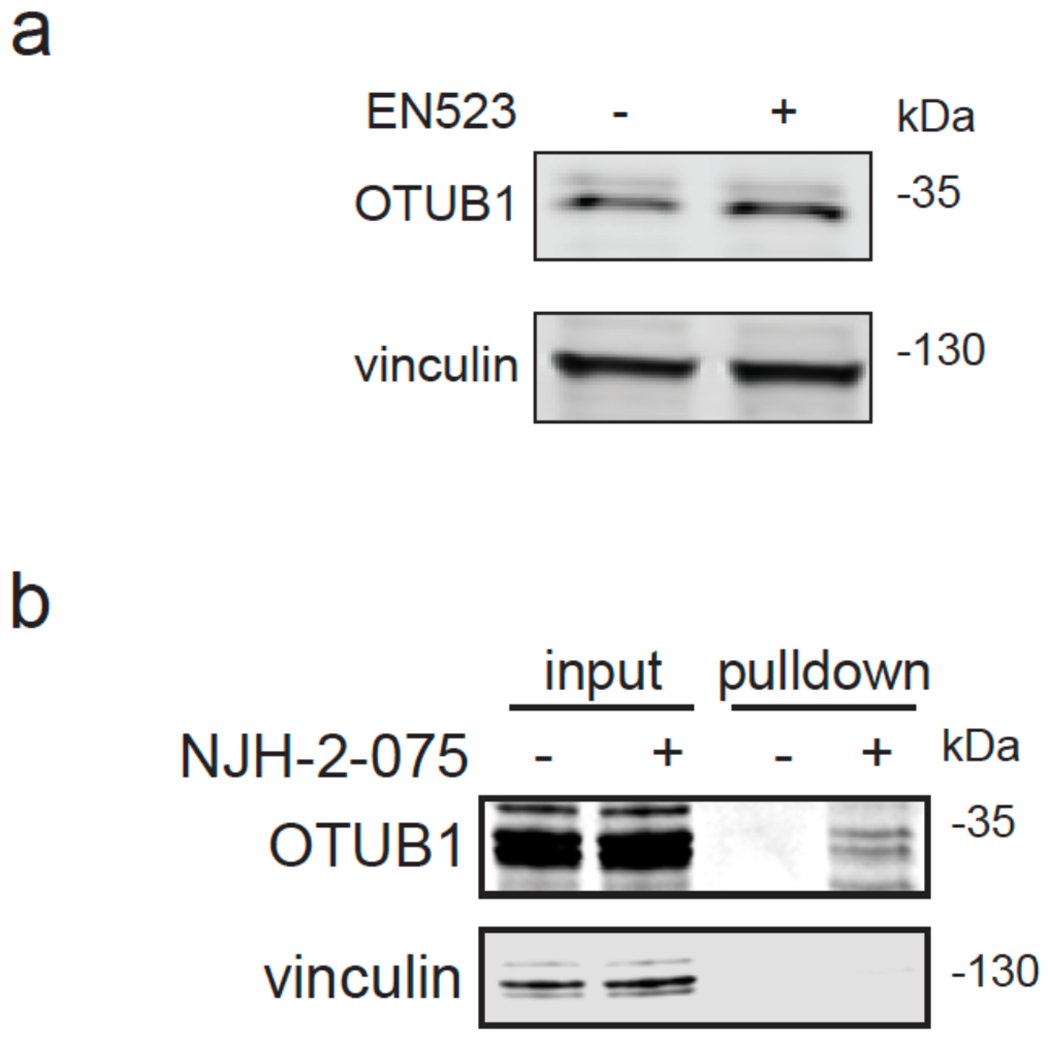
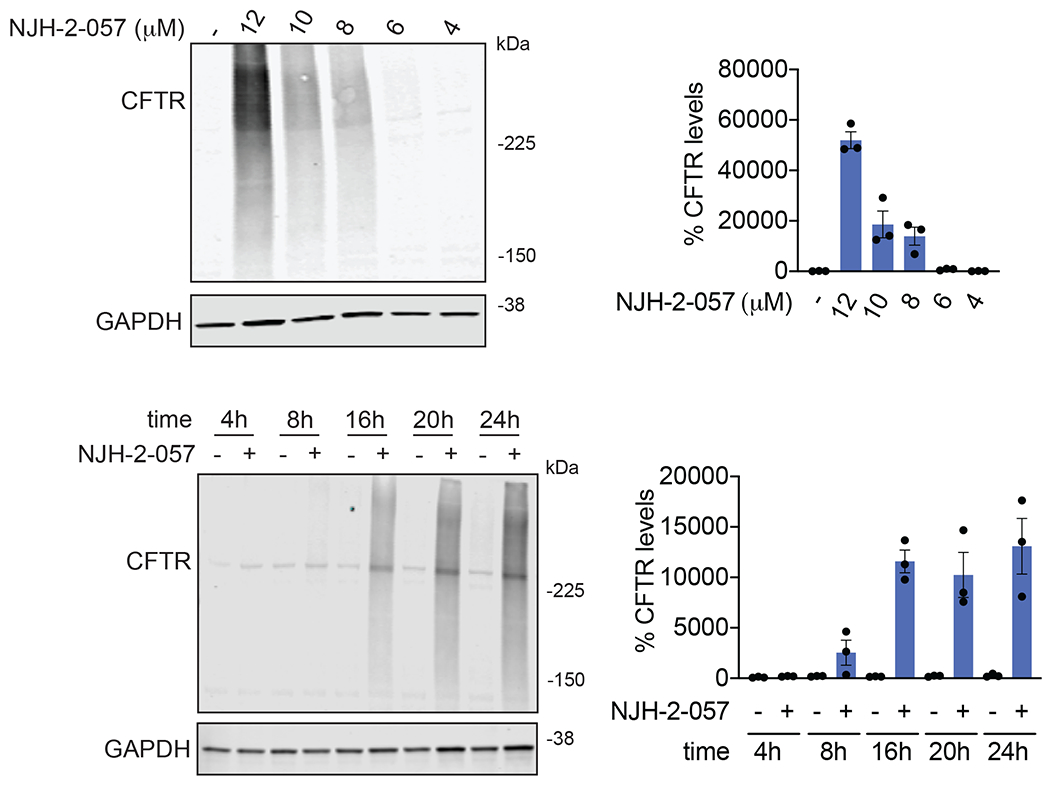
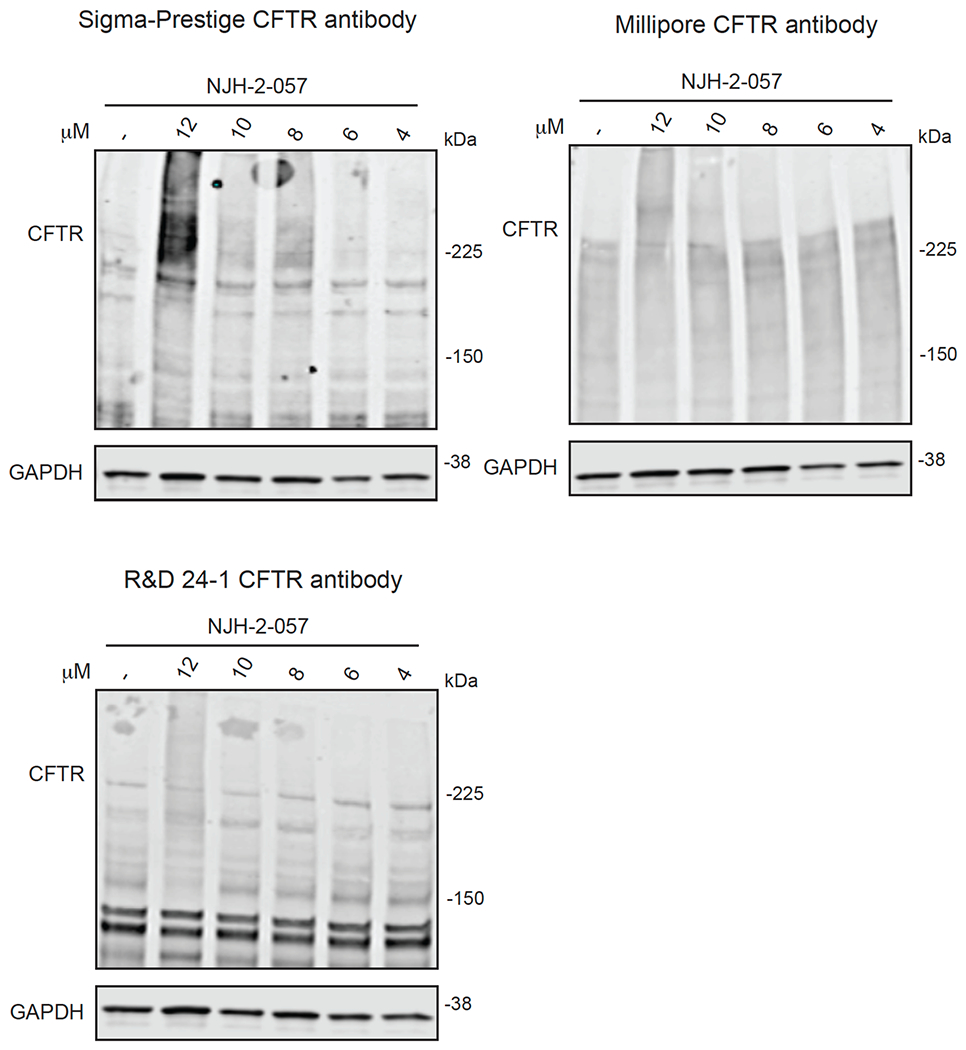
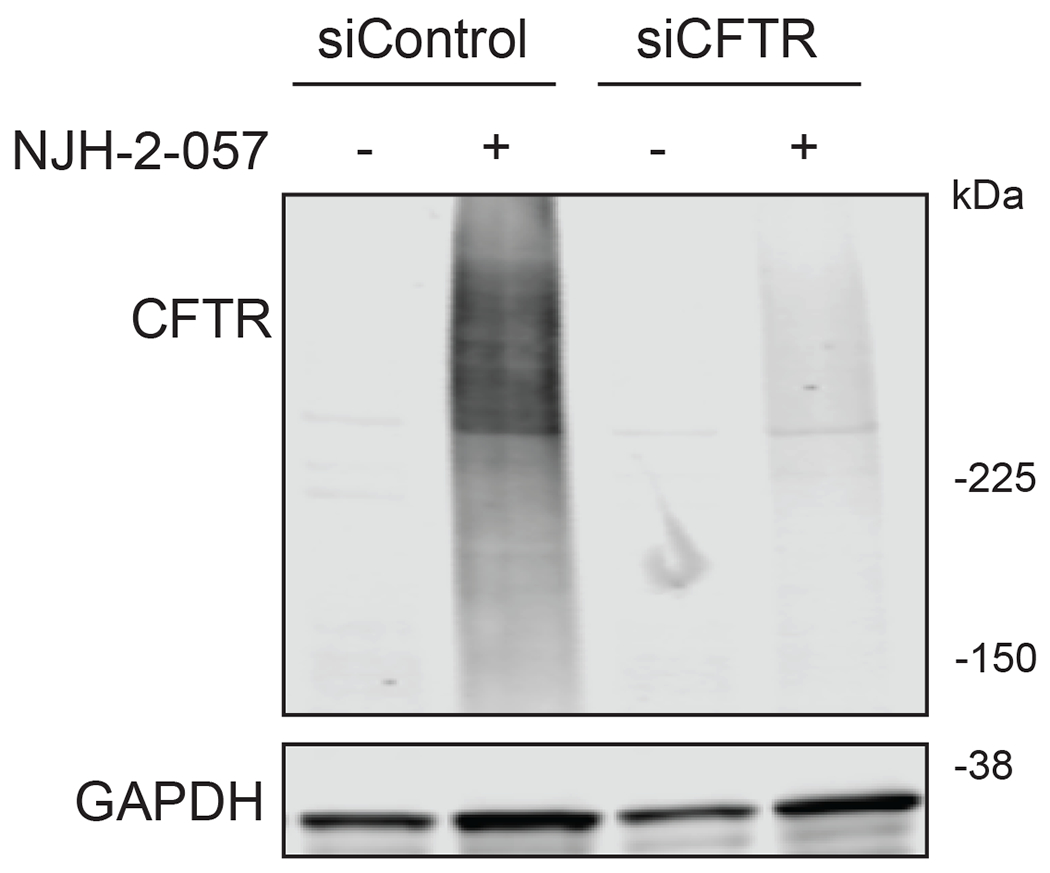
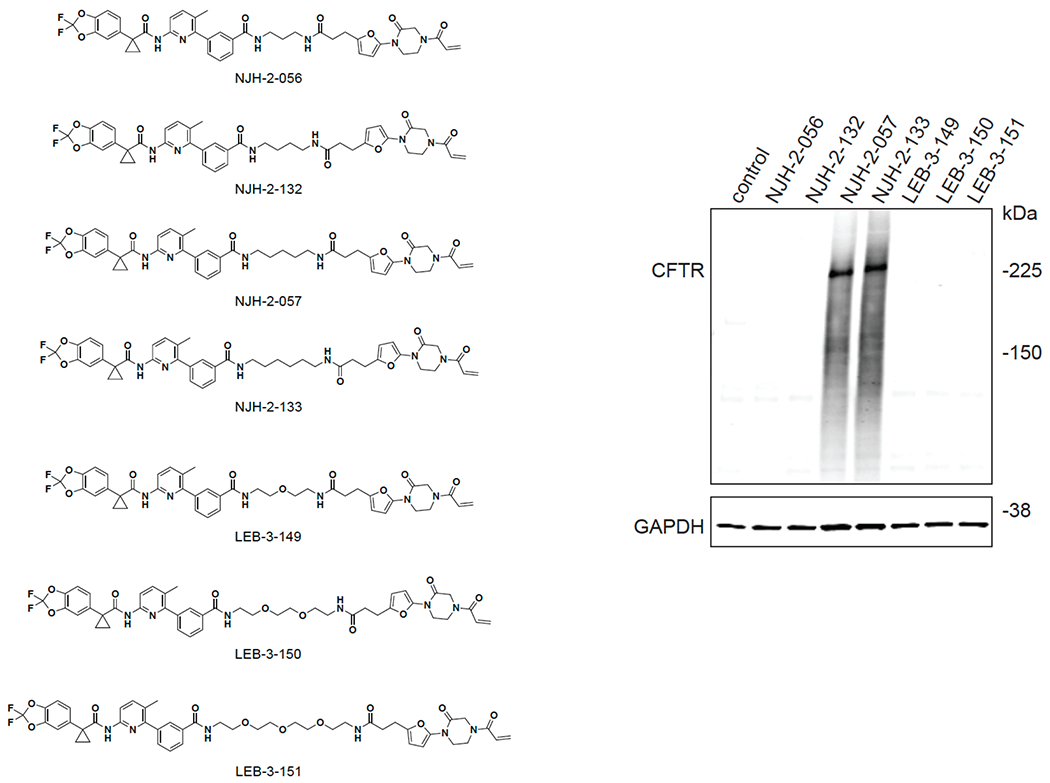
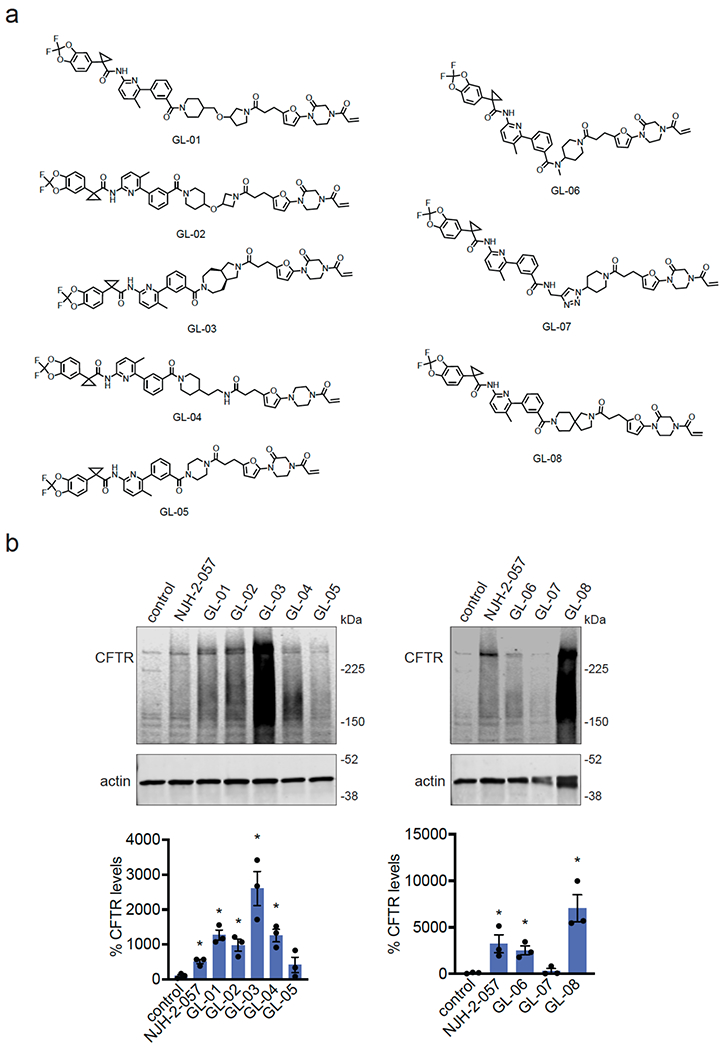
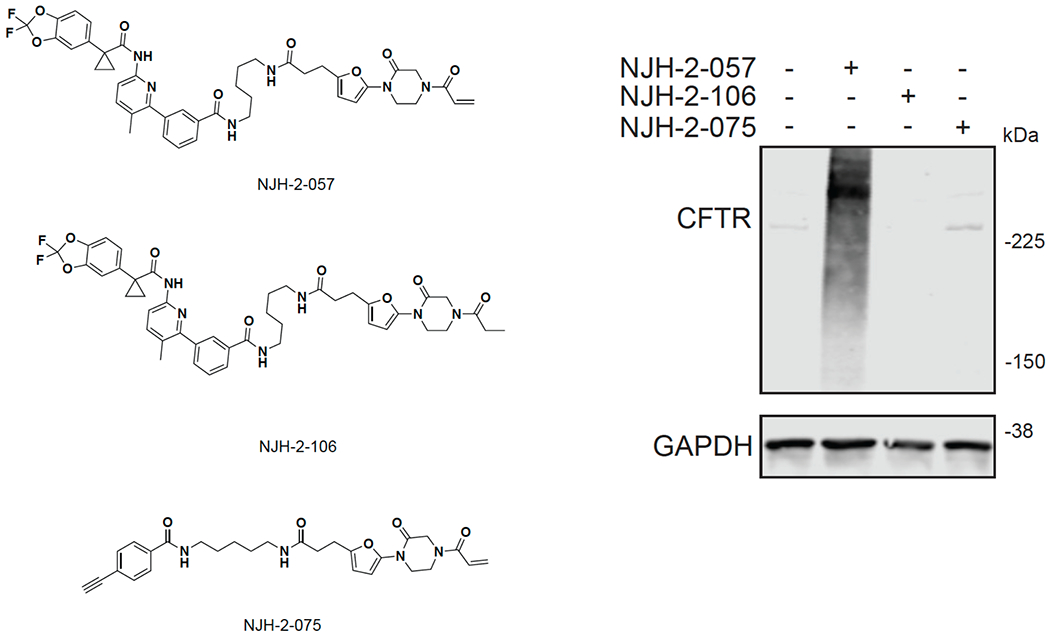
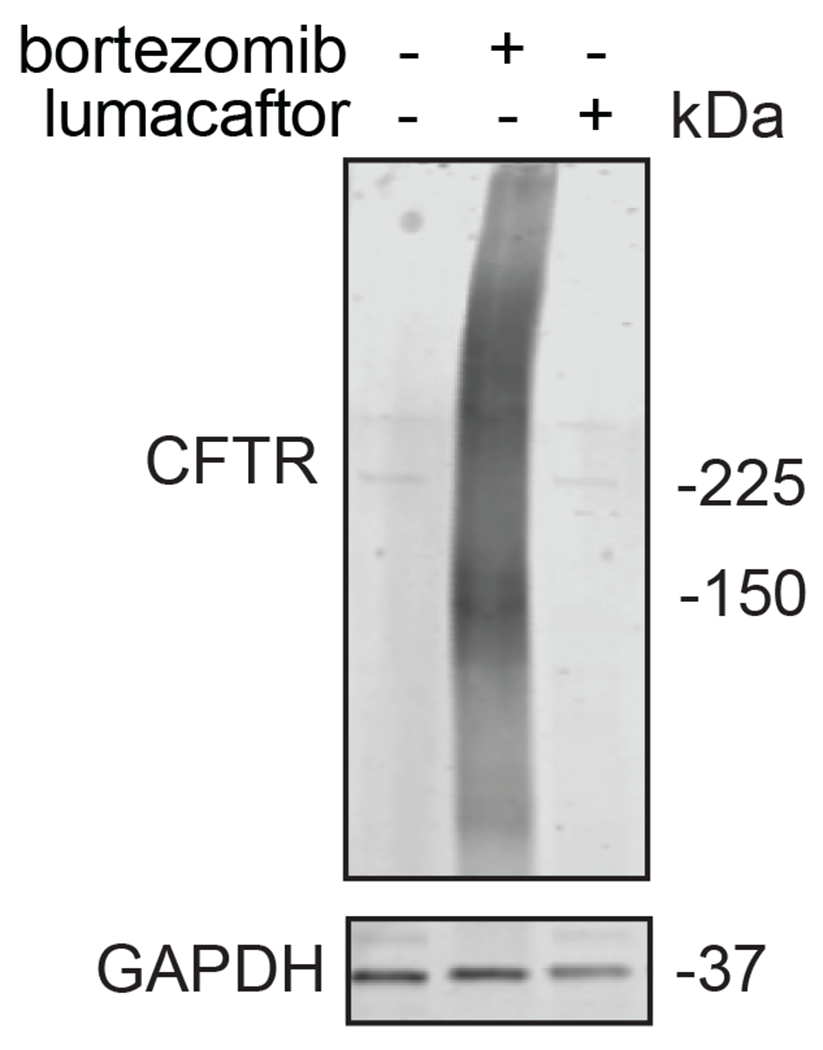
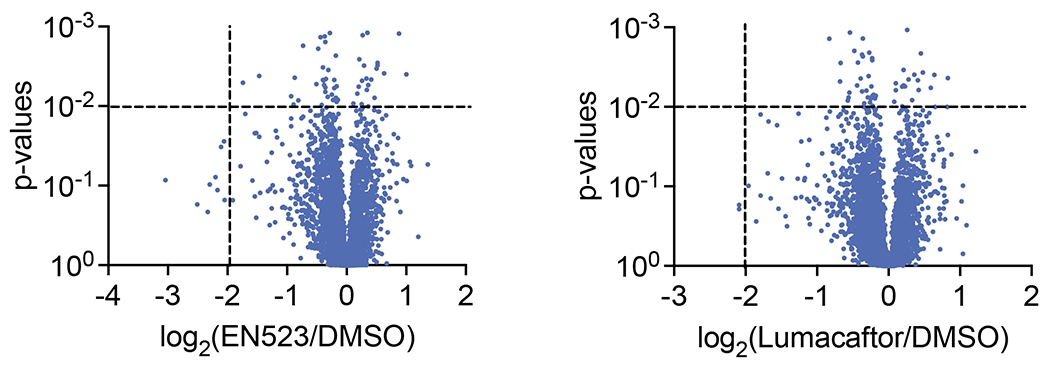
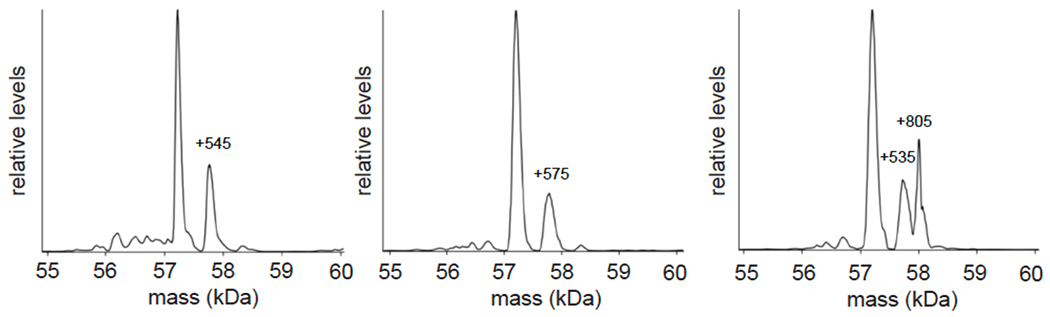
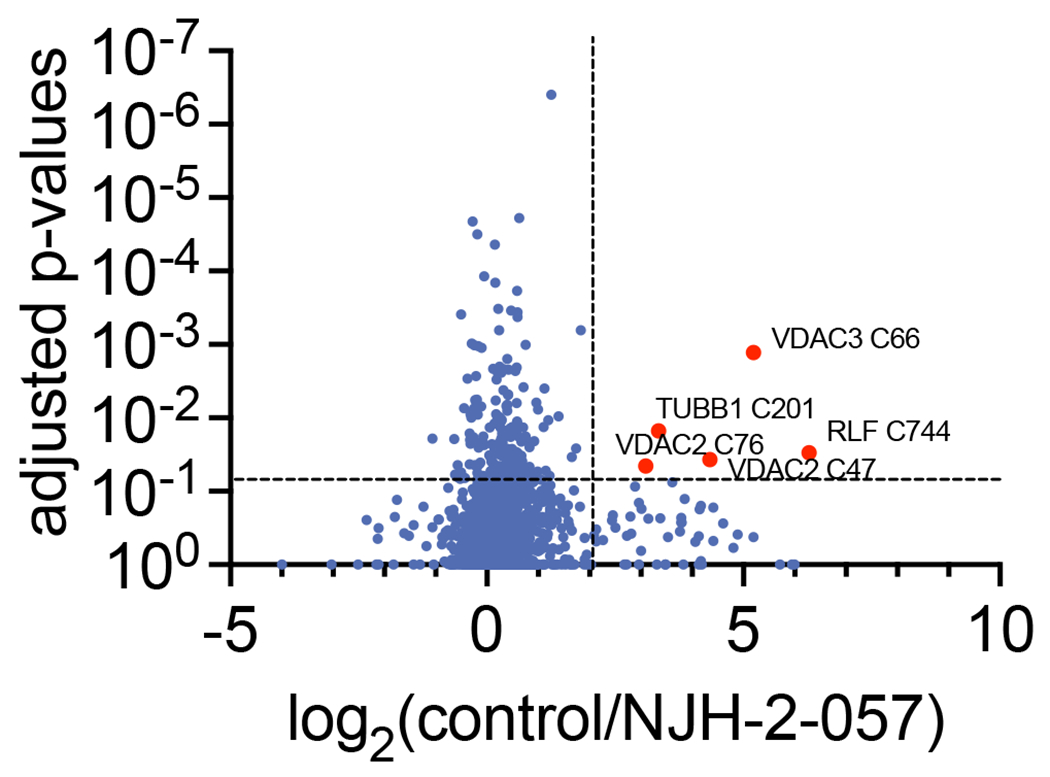
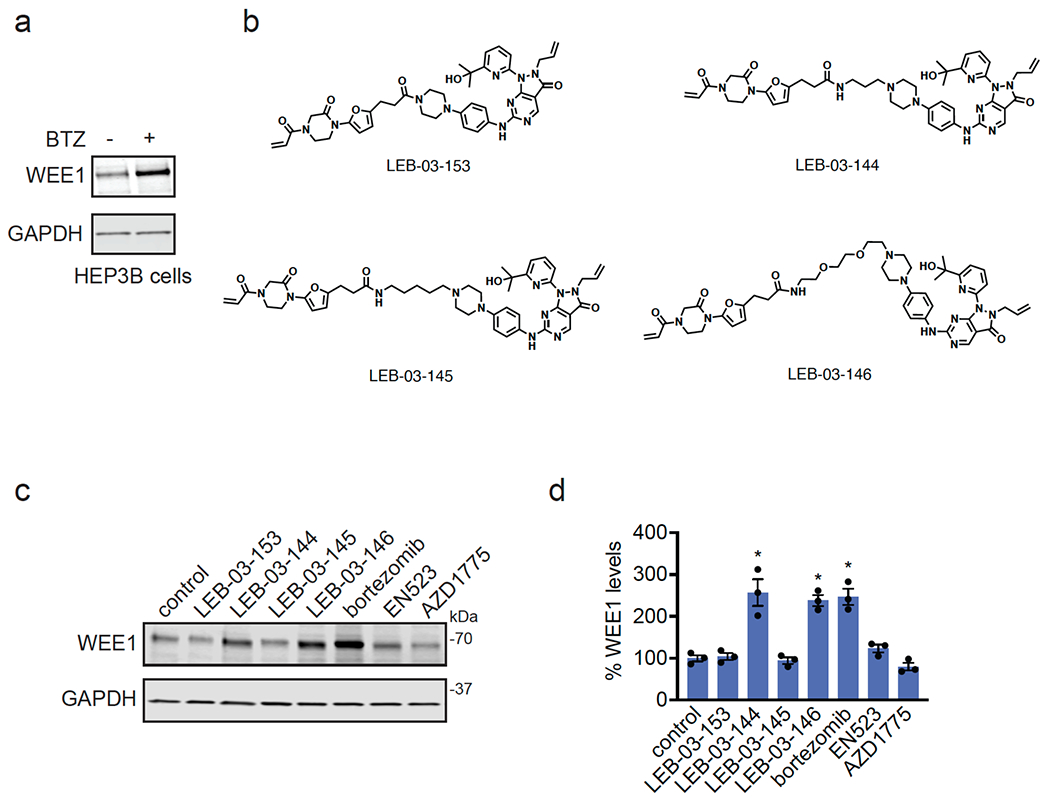
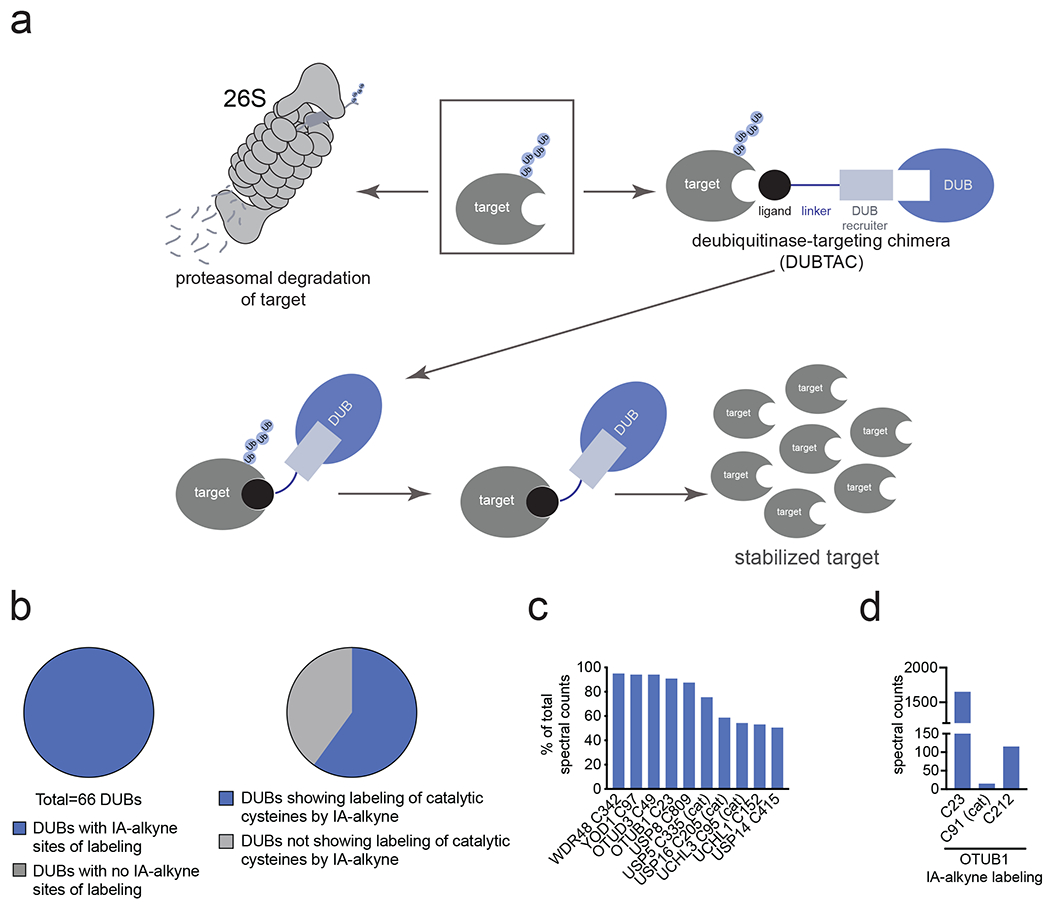
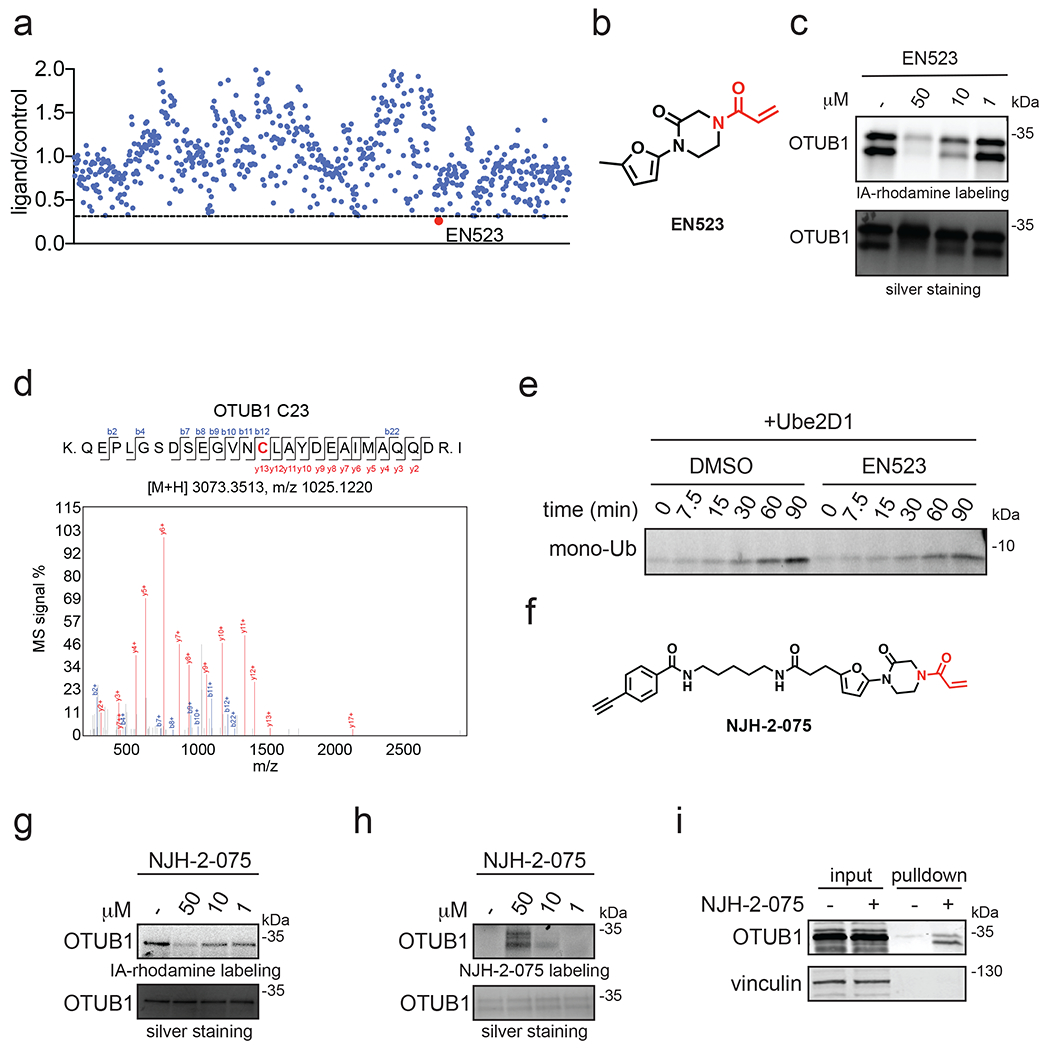
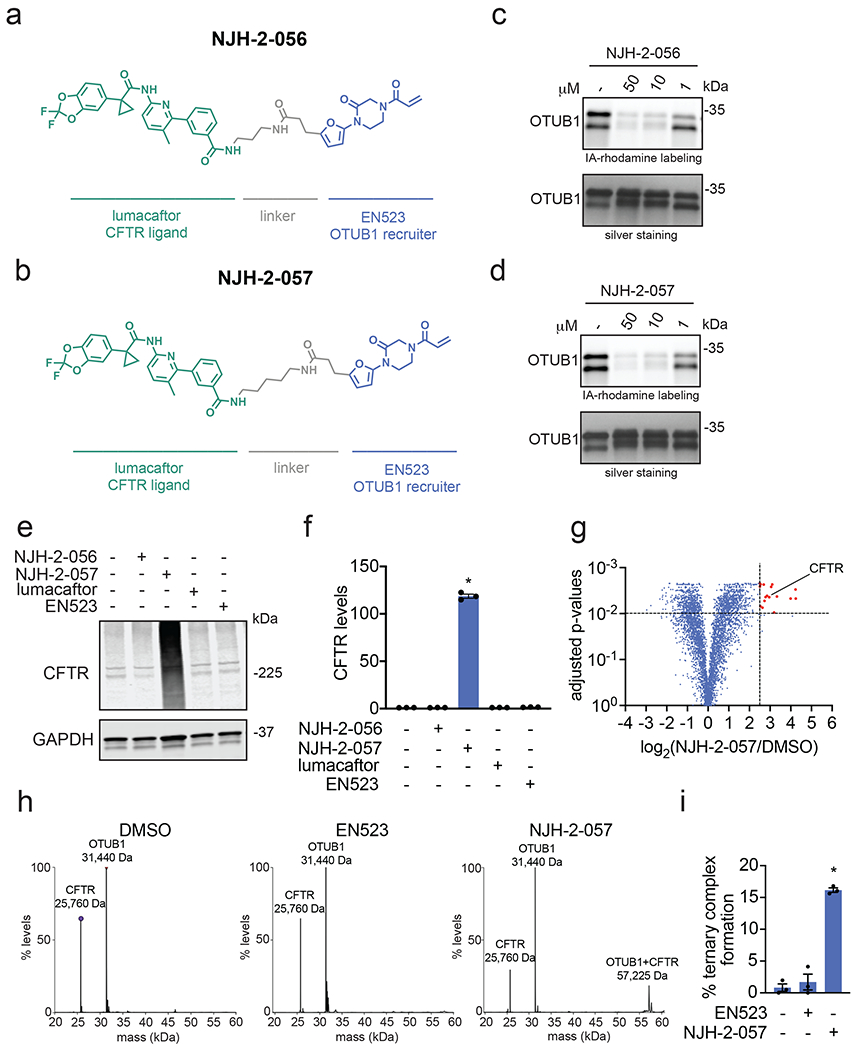
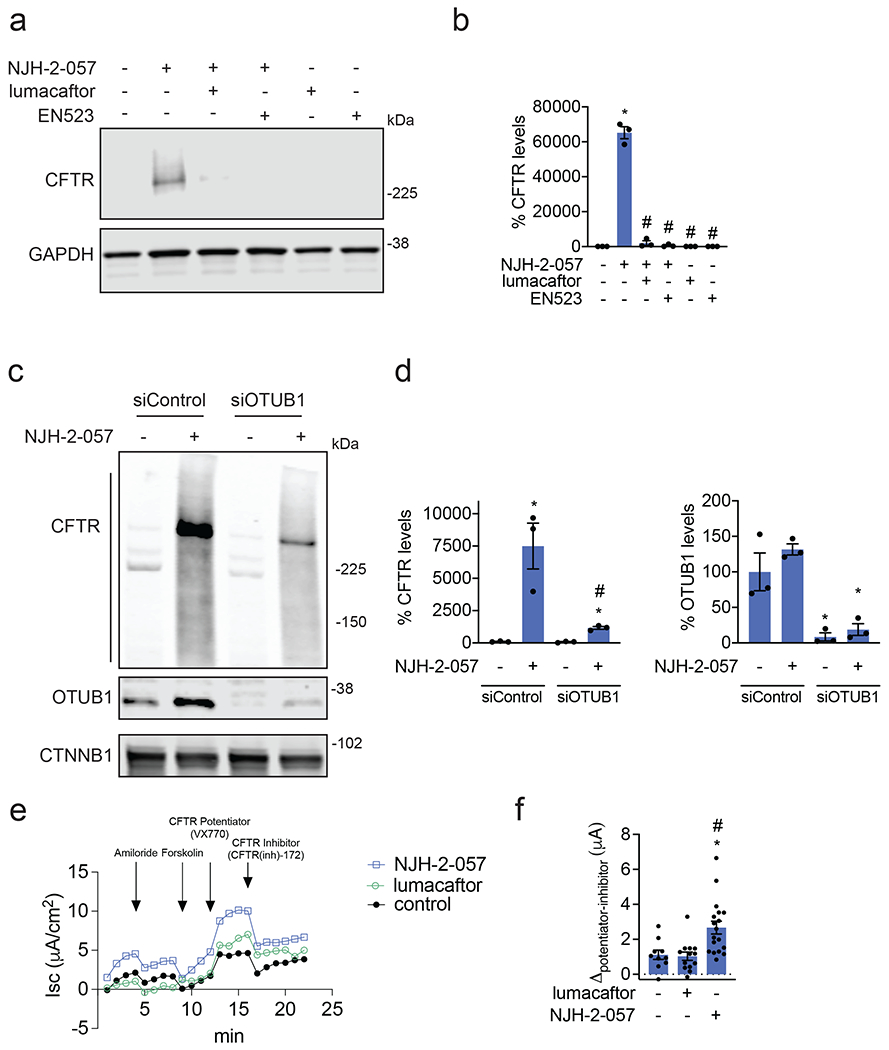
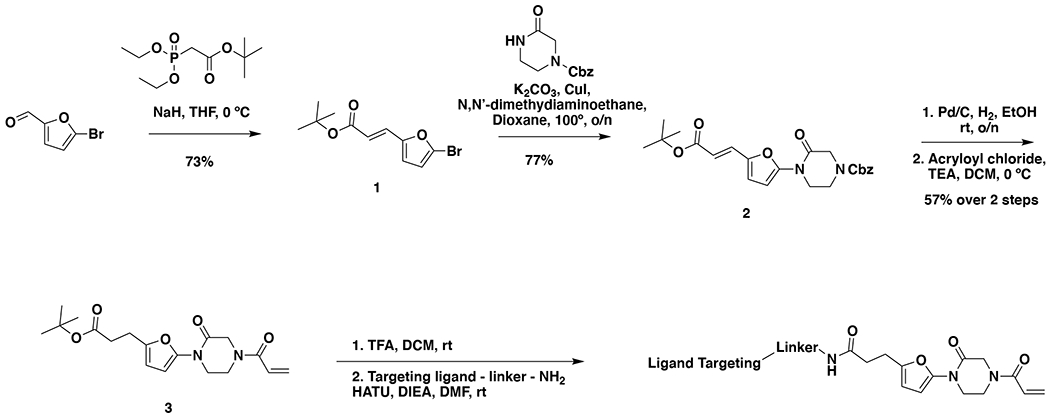
Many diseases are driven by proteins that are aberrantly ubiquitinated and degraded. These diseases would be therapeutically benefited by targeted protein stabilization (TPS). Here we present deubiquitinase-targeting chimeras (DUBTACs), heterobifunctional small molecules consisting of a deubiquitinase recruiter linked to a protein-targeting ligand, to stabilize the levels of specific proteins degraded in a ubiquitin-dependent manner. Using chemoproteomic approaches, we discovered the covalent ligand EN523 that targets a non-catalytic allosteric cysteine C23 in the K48-ubiquitin-specific deubiquitinase OTUB1. We showed that a DUBTAC consisting of our EN523 OTUB1 recruiter linked to lumacaftor, a drug used to treat cystic fibrosis that binds ΔF508-cystic fibrosis transmembrane conductance regulator (CFTR), robustly stabilized ΔF508-CFTR protein levels, leading to improved chloride channel conductance in human cystic fibrosis bronchial epithelial cells. We also demonstrated stabilization of the tumor suppressor kinase WEE1 in hepatoma cells. Our study showcases covalent chemoproteomic approaches to develop new induced proximity-based therapeutic modalities and introduces the DUBTAC platform for TPS.


Figures

Extended Data Figure 1.
Extended Data Figure 1.. Primary covalent ligand screen against OTUB1.
(a) Analysis of aggregate chemoproteomic data for DUBs. Top 10 candidate DUBs described in Figure 1c for total aggregate spectral counts of the particular probe-modified cysteine found in our aggregate chemoproteomic data showing OTUB1 C23 appears far more frequently in chemoproteomic datasets compared to the other DUBs. (b) C23 belongs to an intrinsically disordered region within OTUB1 as assessed by PONDR. (c) Covalent ligand screen of cysteine-reactive libraries competed against IA-rhodamine labeling of recombinant OTUB1 to identify binders to OTUB1 by gel-based ABPP. Vehicle DMSO or cysteine-reactive covalent ligands (50 μM) were pre-incubated with OTUB1 for 30 min at room temperature prior to IA-rhodamine labeling (500 nM, 30 min room temperature). OTUB1 was then separated by SDS/PAGE and in-gel fluorescence was assessed and quantified.
Extended Data Figure 2.
Extended Data Figure 2.. NMR analysis of OTUB1, EN523, and UBE2D2.
(a) 13C-HMQC spectrum of OTUB1 labeled on methyl groups of isoleucine, alanine, valine and leucine residues. The presence of peaks with negative proton chemical shifts indicates that the protein is properly folded. (b) Overlay of HMQC spectra of apo-OTUB1 (black) and EN523-bound OTUB1 (red). While both spectra are mostly identical, we identified small but clear chemical shift perturbations of alanine, isoleucine, valine and leucine peaks. Some of these signal changes are shown in the respective blow-up boxes. (c) Overlay of HMQC spectra of apo-OTUB1 (black), UBE2D2 bound OTUB1 (red) and EN523/UBE2D2-bound OTUB1 (blue). The strong chemical shift perturbations (CSPs) are evidence of specific interactions between OTUB1 and the ubiquitinylated ubiquitin-conjugating enzyme. The lack of significant differences between spectra recorded in the presence and absence of EN523 prove that the covalent ligand does not interfere with the protein-protein interaction. Differing peak shift pattern are only seen for peaks directly affected by compound binding (see inlay for blow-up of Ala region). (d) Overlay of HMQC spectra of apo-OTUB1 (black), Ub-UBE2D2 bound OTUB1 (red) and EN523/Ub-UBE2D2-bound OTUB1 (blue). The strong CSPs are evidence of specific interactions between OTUB1 and the ubiquitin-conjugating enzyme. The lack of significant differences between spectra recorded in the presence and absence of EN523 prove that the covalent ligand does not interfere with the protein-protein interaction. Differing peak shift pattern are only seen for peaks directly affected by compound binding (see inlay for blow-up of Ala region).
Extended Data Figure 3.
Extended Data Figure 3.. Structure-activity relationships of EN523 analogs with OTUB1.
Gel-based ABPP analysis EN523 analogs against OTUB1. Vehicle DMSO or EN523 analogs were pre-incubated with recombinant OTUB1 for 30 min at 37 °C prior to IA-rhodamine labeling (100 nM, 30 min room temperature). OTUB1 was then separated by SDS/PAGE and in-gel fluorescence was assessed. Also shown is silver staining showing protein loading. Shown are representative gels of n=3 biologically independent samples/group.
Extended Data Figure 4.
Extended Data Figure 4.. EN523 does not alter ORUB1 levels and NJH-2-075 engages OTUB1 in CFBE41o-4.7 cells expressing ΔF508-CFTR.
(a) CFBE41o-4.7 cells expressing ΔF508-CFTR were treated with vehicle DMSO or EN523 (10 μM) for 24 h and OTUB1 and loading control vinculin levels were assessed by Western blotting. (b) NJH-2-075 engagement of OTUB1 in CFBE41o-4.7 cells expressing ΔF508-CFTR. Cells were treated with DMSO vehicle or NJH-2-075 (50 μM) for 2 h, after which cell lysates were subjected to CuAAC with biotin picolyl azide and NJH-2-075 labeled proteins were subjected to avidin pulldown, eluted, separated by SDS/PAGE, and blotted for OTUB1 and vinculin. Both input lysate and pulldown levels are shown. Blots shown are representative blots from n=3 biologically independent samples/group.
Extended Data Figure 5.
Extended Data Figure 5.. Effect of DUBTACs on mutant CFTR levels.
CFBE41o-4.7 cells expressing ΔF508-CFTR were treated with vehicle DMSO or NJH-2-057 and CFTR and loading control GAPDH levels were assessed by Western blotting. For dose-response studies, NJH-2-057 was treated for 24 h. For time-course studies, NJH-2-057 was treated at 10 μM. Dose-response and time-course data gels are representative of n=3 biologically independent samples/group and are quantified in the bar graphs to the right. Data in bar graphs show individual biological replicate values and average ± sem from n=3 biologically independent samples/group.
Extended Data Figure 6.
Extended Data Figure 6.. Effect of DUBTACs on mutant CFTR levels.
CFBE41o-4.7 cells expressing ΔF508-CFTR were treated with vehicle DMSO or NJH-2-057 and CFTR and loading control GAPDH levels were assessed by Western blotting using three different antibodies against CFTR from the ones used for the main figures. NJH-2-057 was treated for 24 h. Gels are representative of n=3 biologically independent samples/group.
Extended Data Figure 7.
Extended Data Figure 7.. Effect of DUBTACs on mutant CFTR levels in siControl and siCFTR cells.
CFBE41o-4.7 cells expressing ΔF508-CFTR were treated with vehicle DMSO or NJH-2-057 (10 μM) for 24 h and CFTR and loading control GAPDH levels were assessed by Western blotting. Blot is representative of n=3 biologically independent samples/group.
Extended Data Figure 8.
CFBE41o-4.7 cells expressing ΔF508-CFTR were treated with vehicle DMSO or DUBTACs (10 μM) for 24 h and CFTR and loading control GAPDH levels were assessed by Western blotting. Blot is representative of n=3 biologically independent samples/group.
Extended Data Figure 9.
CFBE41o-4.7 cells expressing ΔF508-CFTR were treated with vehicle DMSO or DUBTACs (10 μM) for 24 h and CFTR and loading control actin levels were assessed by Western blotting. Blot is representative of n=3 biologically independent samples/group. Bar graphs show quantification of CFTR levels shown as individual biological replicate data and average ± sem. Statistical significance was calculated with unpaired two-tailed Student’s t-tests compared to vehicle-treated controls and is expressed as *p<0.05.
Extended Data Figure 10.
CFBE41o-4.7 cells expressing ΔF508-CFTR were treated with vehicle DMSO or compounds (10 μM) for 24 h and CFTR and loading control GAPDH levels were assessed by Western blotting. Blot is representative of n=3 biologically independent samples/group.
Extended Data Figure 11.
Extended Data Figure 11.. Effect of bortezomib and lumacaftor on mutant CFTR levels.
CFBE41o-4.7 cells expressing ΔF508-CFTR were treated with vehicle DMSO, bortezomib (1 μM), or lumacaftor (1 μM) for 24 h and CFTR and loading control GAPDH levels were assessed by Western blotting. The gel shown is representative of n=3 biologically independent samples/group.
Extended Data Figure 12.
TMT-based quantitative proteomic profiling of EN523 or Lumacaftor treatment. CFBE41o-4.7 cells expressing ΔF508-CFTR were treated with vehicle DMSO or EN523 or Lumacaftor (10 μM) for 24 h. Data shown are from n=3 biologically independent samples/group. Full data for this experiment can be found in Table S3.
Extended Data Figure 13.
Native MS analysis of DUBTAC-mediated ternary complex formation. OTUB1 (2 μM) and the CFTR-nucleotide binding domain (2 μM) were incubated with DMSO vehicle, EN523 (50 μM), or NJH-2-057 (50 μM) in 150 mM ammonium acetate with MgCl2 (100 μM) and ATP (100 μM). Zoomed in spectra of just the ternary complex is shown for each biologically independent replicate showing the minor peaks next to the OTUB1-CFTR complex mass of 57,225 Da.
Extended Data Figure 14.
Extended Data Figure 14.. IsoTOP-ABPP analysis of NJH-2-057.
CFBE41o-4.7 cells expressing ΔF508-CFTR were treated with vehicle DMSO or NJH-2-057 for 8 h. Resulting cell lysates were labeled with IA-alkyne (200 μM) for 1 h and taken through the isoTOP-ABPP procedure. Shown in red are the probe-modified peptides that showed isotopically light/heavy or control/NJH-2-57 ratios >4 with adjusted p-values <0.05. The data are from n=3 biologically independent samples/group. The full isoTOP-ABPP dataset can be found in Table S4.
Extended Data Figure 15.
Extended Data Figure 15.. WEE1 DUBTAC.
(a) HEP3B cells were treated with DMSO vehicle or bortezomib (1 μM) for 24 h. WEE1 and loading control GAPDH levels were assessed by Western blotting. (b) Structures of four WEE1 DUBTACs linking AZD1775 to the OTUB1 recruiter EN523 through four different linkers. (c) HEP3B cells were treated with DMSO vehicle, the four DUBTACs, bortezomib, EN523, or AZD1775 at 1 μM for 24 h. WEE1 and loading control GAPDH levels were assessed by Western blotting. Blots shown in (a) and (b) are representative blots from n=3 biologically independent samples/group. Data in bar graphs show individual biological replicate values and average ± sem from n=3 biologically independent samples/group.
Figure 1.
Figure 1.. DUBTAC platform.
(a) DUBTACs are heterobifunctional molecules consisting of a protein-targeting ligand linked to a DUB recruiter via a linker. DUBTACs are ideally used for stabilizing the levels of actively ubiquitinated proteins that are degraded by the proteasome. When treated in cells, a DUBTAC will induce the proximity of a DUB with a target protein to remove polyubiquitin chains to prevent the protein from undergoing proteasome-mediated degradation, thereby stabilizing and elevating the level of the actively degraded protein. (b) Out of 65 DUBs mined in our research group’s aggregate chemoproteomic datasets of cysteine-reactive probe labeling with IA-alkyne in various complex proteomes, we identified probe-modified cysteines across all 100 % of the 65 DUBs. This is shown in the first pie chart. Among the 65 DUBs that showed probe-modified cysteines, 40 of these DUBs showed >10 aggregate spectral counts across our chemoproteomic datasets. 24 DUBs, or 60 %, of these 40 DUBs showed labeling of the DUB catalytic or active site cysteines. (c) Mining the DUB data, we identified 10 DUBs wherein there was one probe-modified cysteine that represented >50 % of the total aggregate spectral counts for probe-modified cysteine peptides for the particular DUB. 7 of those 10 DUBs do not target a known catalytic cysteine whereas 3 do target the catalytic cysteine (abbreviated by cat). (d) Analysis of aggregate chemoproteomic data for OTUB1 IA-alkyne labeling showing that C23 is the dominant site labeled by IA-alkyne compared to the catalytic (cat) C91. Chemoproteomic data analysis of DUBs across aggregated datasets can be found in Table S1.
Figure 2.
Figure 2.. Discovery of covalent ligands that target OTUB1.
(a) Covalent ligand screen of a cysteine-reactive library competed against IA-rhodamine labeling of recombinant OTUB1 to identify binders to OTUB1 by gel-based ABPP. Vehicle DMSO or cysteine-reactive covalent ligands (50 μM) were pre-incubated with OTUB1 for 30 min at room temperature prior to IA-rhodamine labeling (500 nM, 30 min room temperature). OTUB1 was then separated by SDS/PAGE and in-gel fluorescence was assessed and quantified. Gel-based ABPP data and quantification of in-gel fluorescence shown in Extended Data Figure 1b and Table S2. EN523 annotated in red was the top hit that showed the greatest inhibition of OTUB1 IA-rhodamine labeling. (b) Structure of EN523 shown with cysteine-reactive acrylamide highlighted in red. (c) Gel-based ABPP confirmation showing dose-responsive inhibition of IA-rhodamine binding of OTUB1. Vehicle DMSO or EN523 were pre-incubated with recombinant OTUB1 for 30 min at 37 °C prior to IA-rhodamine labeling (500 nM, 30 min room temperature). OTUB1 was then separated by SDS/PAGE and in-gel fluorescence was assessed. Also shown is silver staining showing protein loading. Shown is a representative gel of n=3 biologically independent samples/group. (d) LC-MS/MS data showing EN523-modified adduct on C23 of OTUB1. OTUB1 (10 μg) recombinant protein was incubated with EN523 (50 μM) for 30 min, after which the protein was precipitated and digested with trypsin and tryptic digests were analyzed by LC-MS/MS to identify modified sites. (e) OTUB1 DUB activity monitored by cleavage of K48 diubiquitin. Recombinant OTUB1 were pre-incubated with DMSO or EN523 (50 μM) for 1 h. After pre-incubation, OTUB1 was added to a mixture of diubiquitin and UBE2D1. The appearance of mono-Ub was monitored by Western blotting. (f) Structure of alkyne-functionalized EN523 probe—NJH-2-075. (g) Gel-based ABPP of NJH-2-075. Vehicle DMSO or NJH-2-075 were pre-incubated with OTUB1 for 30 min at 37 °C prior to IA-rhodamine labeling (500 nM, 30 min room temperature). OTUB1 was then separated by SDS/PAGE and in-gel fluorescence was assessed. Also shown is silver staining showing protein loading. (h) NJH-2-075 labeling of recombinant OTUB1. OTUB1 (0.5 μg) was labeled with DMSO or NJH-2-075 for 1.5 h at 37° C, after which rhodamine-azide was appended by CuAAC, OTUB1 was separated by SDS/PAGE and in-gel fluorescence was assessed. Also shown is silver staining showing protein loading. (i) NJH-2-075 engagement of OTUB1 in HEK293T cells. HEK293T cells were treated with DMSO vehicle or NJH-2-075 (50 μM) for 2 h, after which cell lysates were subjected to CuAAC with biotin picolyl azide and NJH-2-075 labeled proteins were subjected to avidin pulldown, eluted, separated by SDS/PAGE, and blotted for OTUB1 and vinculin. Both input lysate and pulldown levels are shown. Gels or blots shown in (c, e, g, h, i) are representative of n=3 biologically independent samples/group.
Figure 3.
Figure 3.. DUBTAC against mutant CFTR.
(a, b) Structures of NJH-2-056 and NJH-2-057; these DUBTACs against mutant CFTR protein are formed by linking CFTR ligand lumacaftor to OTUB1 recruiter EN523 through C3 and C5 alkyl linkers, respectively. (c, d) Gel-based ABPP analysis of NJH-2-056 and NJH-2-057 against OTUB1. Vehicle DMSO or DUBTACs were preincubated with recombinant OTUB1 for 30 min at 37 °C prior to addition of IA-rhodamine (100 nM) for 30 min at room temperature. OTUB1 was run on SDS/PAGE and in-gel fluorescence was assessed. Protein loading was assessed by silver staining. (e) Effect of DUBTACs on mutant CFTR levels. CFBE41o-4.7 cells expressing ΔF508-CFTR were treated with vehicle DMSO, NJH-2-056 (10 μM), NJH-2-057 (10 μM), lumacaftor (10 μM), or EN523 (10 μM) for 24 h, and mutant CFTR and loading control GAPDH levels were assessed by Western blotting. (f) Quantification of the experiment described in (e). (g) TMT-based quantitative proteomic profiling of NJH-2-057 treatment. CFBE41o-4.7 cells expressing ΔF508-CFTR were treated with vehicle DMSO or NJH-2-057 (10 μM) for 24 h. Data shown are from n=3 biologically independent samples/group. Full data for this experiment can be found in Table S3. (h) Native MS analysis of DUBTAC-mediated ternary complex formation. OTUB1 (2 μM) and the CFTR-nucleotide binding domain (2 μM) were incubated with DMSO vehicle, EN523 (50 μM), or NJH-2-057 (50 μM) in 150 mM ammonium acetate with MgCl2 (100 μM) and ATP (100 μM). Representative mass spectra from n=3 biologically independent samples/group are shown. (i) percentage of ternary complex formation assessed by measuring the CFTR-OTUB1 complex formed in the experiment described in (h). Gels shown in (c, d, e) are representative of n=3 biologically independent samples/group. Data in (f, i) show individual biological replicate values and average ± sem from n=3 biologically independent samples/group. Statistical significance was calculated with unpaired two-tailed Student’s t-tests in (f, i) compared to vehicle-treated controls and is expressed as *p<0.05.
Figure 4.
Figure 4.. Characterizing the mechanism of the CFTR DUBTAC NJH-2-057.
(a) Effect of lumacaftor or EN523 pre-incubation on NJH-2-057 DUBTAC-mediated stabilization of mutant CFTR levels. CFBE41o-4.7 cells expressing ΔF508-CFTR were pre-treated with vehicle DMSO, lumacaftor (100 μM), or EN523 (100 μM) for 1 h prior to treatment with NJH-2-057 (10 μM) for 24 h. Mutant CFTR and loading control GAPDH levels were assessed by Western blotting. (b) Quantification of the experiment described in (a). (c) Effect of OTUB1 knockdown on NJH-2-057 DUBTAC-mediated mutant CFTR stabilization. CFBE41o-4.7 cells expressing ΔF508-CFTR were transiently transfected with siControl or siOTUB1 oligonucleotides for 48 h prior to treatment of cells with vehicle DMSO or NJH-2-057 (10 μM) for 16 h. Mutant CFTR, OTUB1, and loading control GAPDH levels were assessed by Western blotting. (d) Levels of mutant CFTR and OTUB1 from the experiment described in (c). (e) Transepithelial conductance in primary human cystic fibrosis donor bronchial epithelial cells bearing the ΔF508-CFTR mutation. Cells were treated with DMSO vehicle, NJH-2-057 (10 μM), or lumacaftor (10 μM) 24 h prior to the TECC24 assay in which cells received four additional sequential treatments with a sodium channel inhibitor amiloride (10 μM), cAMP activator Forskolin (20 μM), a CFTR potentiator VX770 (0.5 μM), and finally with a CFTR inhibitor CFTR-Inh172 (30 μM). Shown are the average values from conductance from a single donor. Experiments were conducted in primary cells from two donors. (f) Changes in current between potentiator VX770 (Ivacaftor) treatment and the CFTR inhibitor treatment in the experiment described in (e) in two primary human cystic fibrosis donor bronchial epithelial cells bearing the ΔF508-CFTR mutation. Individual replicate data are shown in the bar graph from n=10 biologically independent samples in the DMSO vehicle treated group, n=13 biologically independent samples in the lumacaftor treated group, and n=18 biologically independent samples in the NJH-2-057 treated group. Gels shown in (a, c) are representative of n=3 biologically independent samples/group. Data in (b, d) show individual biological replicate values and average ± sem from n=3 biologically independent samples/group. Statistical significance in was calculated with unpaired two-tailed Student’s t-tests in (b, d, f) and is expressed as *p<0.05 compared to vehicle-treated control in (b, f) and vehicle-treated siControl in (d) and #p<0.05 compared to the NJH-2-057 treated group in (b) and NJH-2-057 treated siControl group for CFTR levels in (d).
Scheme 1.
Scheme 1.
General scheme describing synthetic route to bifunctional DUBTACs containing EN523 as an OTUB1 recruiter.

Comment in

  • DUB be good to me.
    Liu X, Ciulli A. Liu X, et al. Nat Chem Biol. 2022 Apr;18(4):358-359. doi: 10.1038/s41589-022-00978-9. Nat Chem Biol. 2022. PMID: 35210617 No abstract available.
  • DUBTACs for targeted protein stabilization.
    Willson J. Willson J. Nat Rev Drug Discov. 2022 Apr;21(4):258. doi: 10.1038/d41573-022-00039-9. Nat Rev Drug Discov. 2022. PMID: 35233100 No abstract available.
  • DUB to the rescue.
    Teh WP, Zhu H, Marto JA, Buhrlage SJ. Teh WP, et al. Mol Cell. 2022 Apr 21;82(8):1411-1413. doi: 10.1016/j.molcel.2022.03.039. Mol Cell. 2022. PMID: 35452613

Similar articles

Cited by

References

    1. Dixon SJ & Stockwell BR Identifying druggable disease-modifying gene products. Curr. Opin. Chem. Biol 13, 549–555 (2009). - PMC - PubMed
    1. Spradlin JN, Zhang E & Nomura DK Reimagining Druggability Using Chemoproteomic Platforms. Acc. Chem. Res 54, 1801–1813 (2021). - PubMed
    1. Nalawansha DA & Crews CM PROTACs: An Emerging Therapeutic Modality in Precision Medicine. Cell Chem. Biol 27, 998–1014 (2020). - PMC - PubMed
    1. Burslem GM & Crews CM Proteolysis-Targeting Chimeras as Therapeutics and Tools for Biological Discovery. Cell 181, 102–114 (2020). - PMC - PubMed
    1. Schapira M, Calabrese MF, Bullock AN & Crews CM Targeted protein degradation: expanding the toolbox. Nat. Rev. Drug Discov 18, 949–963 (2019). - PubMed

Publication types

MeSH terms