

In situ visualization of large-scale turbulence simulations in Nek5000 with ParaView Catalyst
- PMID: 35210696
- PMCID: PMC8827385
- DOI: 10.1007/s11227-021-03990-3
In situ visualization of large-scale turbulence simulations in Nek5000 with ParaView Catalyst
Abstract
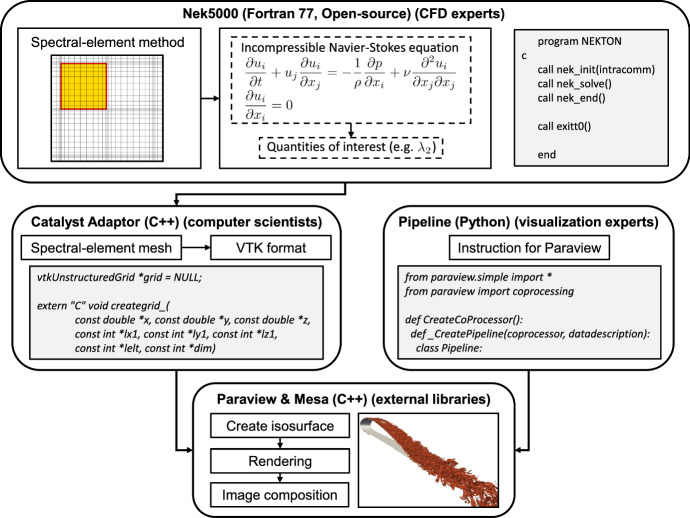
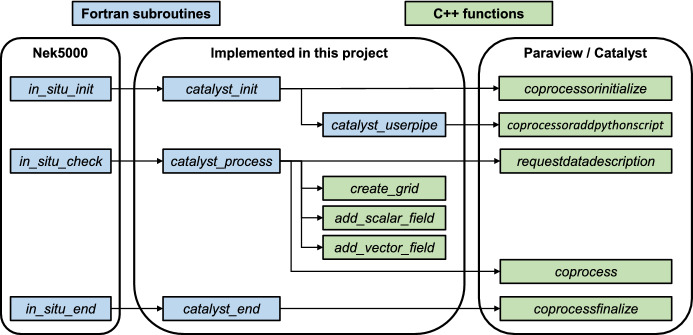
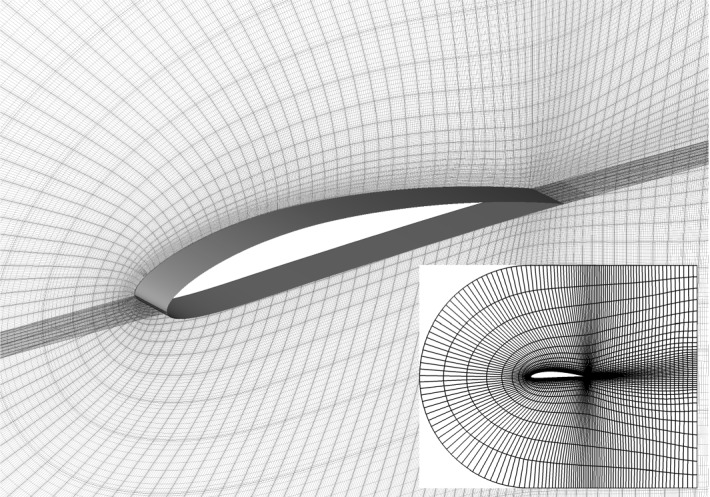
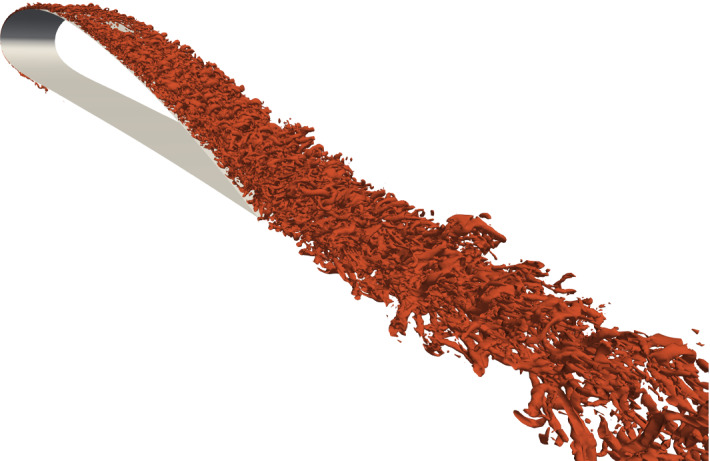
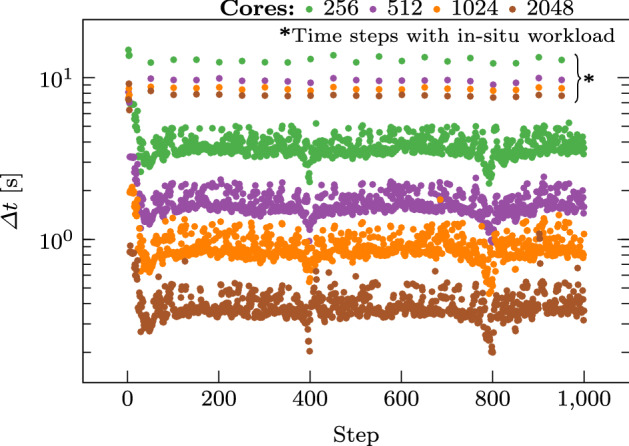
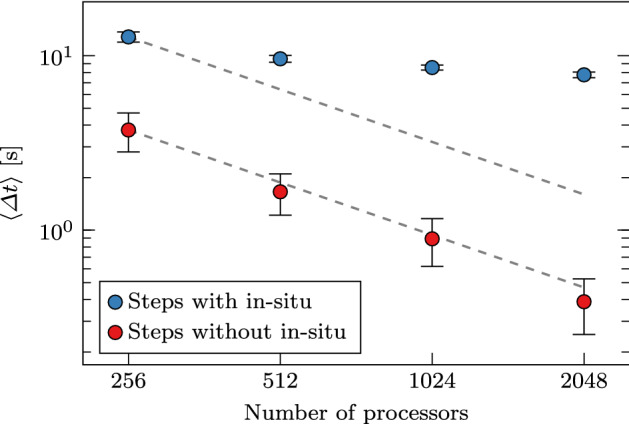
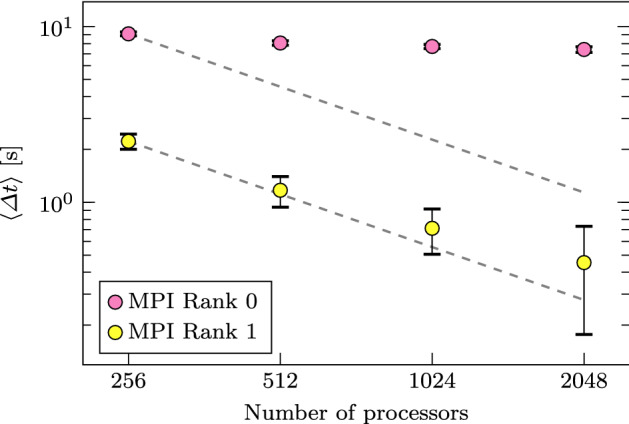
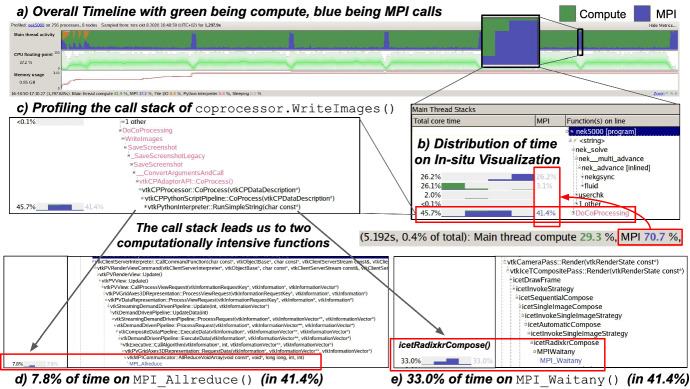
In situ visualization on high-performance computing systems allows us to analyze simulation results that would otherwise be impossible, given the size of the simulation data sets and offline post-processing execution time. We develop an in situ adaptor for Paraview Catalyst and Nek5000, a massively parallel Fortran and C code for computational fluid dynamics. We perform a strong scalability test up to 2048 cores on KTH's Beskow Cray XC40 supercomputer and assess in situ visualization's impact on the Nek5000 performance. In our study case, a high-fidelity simulation of turbulent flow, we observe that in situ operations significantly limit the strong scalability of the code, reducing the relative parallel efficiency to only on 2048 cores (the relative efficiency of Nek5000 without in situ operations is ). Through profiling with Arm MAP, we identified a bottleneck in the image composition step (that uses the Radix-kr algorithm) where a majority of the time is spent on MPI communication. We also identified an imbalance of in situ processing time between rank 0 and all other ranks. In our case, better scaling and load-balancing in the parallel image composition would considerably improve the performance of Nek5000 with in situ capabilities. In general, the result of this study highlights the technical challenges posed by the integration of high-performance simulation codes and data-analysis libraries and their practical use in complex cases, even when efficient algorithms already exist for a certain application scenario.
Keywords: Computational fluid dynamics; High-performance computing; In situ visualization.
© The Author(s) 2021.
Conflict of interest statement
Conflict of interestThe authors declare that they have no conflict of interest.
Figures
References
-
- Ahrens J, Geveci B, Law C. ParaView: an end-user tool for large data visualization. Vis Handb. 2005;836:717–732.
-
- Ayachit U, Bauer A, Duque EPN, Eisenhauer G, Ferrier N, Gu J, Jansen KE, Loring B, Lukic Z, Menon S, Morozov D, O’Leary P, Ranjan R, Rasquin M, Stone CP, Vishwanath V, Weber GH, Whitlock B, Wolf M, Wu KJ, Bethel EW (2016) Performance analysis, design considerations, and applications of extreme-scale in situ infrastructures. In: SC ’16: l, pp 921–932
-
- Ayachit U, Bauer A, Geveci B, O’Leary P, Moreland K, Fabian N, Mauldin J (2015) ParaView catalyst: enabling in situ data analysis and visualization. In: Proceedings of the First Workshop on In Situ Infrastructures for Enabling Extreme-Scale Analysis and Visualization, pp 25–29
-
- Bernardoni B, Ferrier N, Insley J, Papka M.E, Patel S, Rizzi S (2018) In situ visualization and analysis to design large scale experiments in computational fluid dynamics. In: 2018 IEEE 8th Symposium on Large Data Analysis and Visualization (LDAV). IEEE, pp 94–95
-
- Deville MO, Fischer PF, Mund EH. High-order methods for incompressible fluid flows. New York: Cambridge University Press; 2002.
LinkOut - more resources
Full Text Sources