Identification and Verification of Immune-Related Genes Prognostic Signature Based on ssGSEA for Adrenocortical Carcinoma (ACC)
- PMID: 35210821
- PMCID: PMC8857983
- DOI: 10.2147/IJGM.S345123
Identification and Verification of Immune-Related Genes Prognostic Signature Based on ssGSEA for Adrenocortical Carcinoma (ACC)
Abstract
Purpose: Adrenocortical carcinoma (ACC) is an endocrine malignant tumor with poor prognosis. The study aimed to construct ACC immune-related gene prognostic signature and verify the efficacy of prognostic signature.
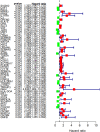
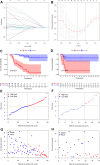
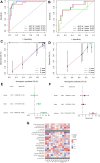
Methods: ACC RNA-seq data and clinical information are downloaded from TCGA databases and GEO databases. We used single sample gene set enrichment analysis (ssGSEA) to assess immune cell infiltration in ACC patients and ACC patients were divided into high- and low-immune cell infiltration clusters. The validity of ssGSEA grouping was verified using the ESTIMATE algorithm. A total of 275 differentially expressed immune-related genes (IRGs) were obtained from the intersection of IRGs and differentially expressed genes (DEGs) in high and low immune cell infiltration clusters. LASSO analysis was used to identify 13 IRGs that regulate the prognosis of ACC patients through immune infiltration. Kaplan-Meier analysis, ROC curve, univariate and multivariate Cox regression further confirmed that these 13 immune-related gene signatures were innovative and significant prognostic factors, which were independent of clinical features. Finally, ACC prognostic nomogram was constructed, ROC curve and calibration curve were drawn to evaluate the accuracy of the prognostic nomogram.
Results: LASSO regression analysis was used to screen out ACC survival-related genes. Univariate and multivariate Cox proportional risk regression models were used to analyze and construct the ACC prognosis nomogram. The AUC for predicting 1-, 3- and 5-year overall survival rate of ACC patients was 0.799, 0.966 and 0.969, suggesting good prediction accuracy. The calibration curve shows that the predicted results of the prognostic nomogram are in good agreement with the actual situation.
Conclusion: ssGSEA technique plays an important role in the construction of ACC prognostic model. Based on IRGs associated with survival independently predicted ACC prognosis, we identified thirteen immune-related genes as prognostic signature for ACC.
Keywords: ACC; adrenocortical carcinoma; immune; prognostic; risk score; single sample gene set enrichment analysis; ssGSEA.
© 2022 Yuan et al.
Conflict of interest statement
The authors report no conflicts of interest in this work.
Figures


Similar articles
-
Comprehensive analysis of immune-related gene signature based on ssGSEA algorithms in the prognosis and immune landscape of hepatocellular carcinoma.Front Genet. 2022 Dec 9;13:1064432. doi: 10.3389/fgene.2022.1064432. eCollection 2022. Front Genet. 2022. PMID: 36568383 Free PMC article.
-
Identification of prognostic immune-related gene signature associated with tumor microenvironment of colorectal cancer.BMC Cancer. 2021 Aug 8;21(1):905. doi: 10.1186/s12885-021-08629-3. BMC Cancer. 2021. PMID: 34364366 Free PMC article.
-
A Novel Prognostic Risk Model for Cervical Cancer Based on Immune Checkpoint HLA-G-Driven Differentially Expressed Genes.Front Immunol. 2022 Jul 18;13:851622. doi: 10.3389/fimmu.2022.851622. eCollection 2022. Front Immunol. 2022. PMID: 35924232 Free PMC article.
-
Construction of a novel mRNA-signature prediction model for prognosis of bladder cancer based on a statistical analysis.BMC Cancer. 2021 Jul 27;21(1):858. doi: 10.1186/s12885-021-08611-z. BMC Cancer. 2021. PMID: 34315402 Free PMC article.
-
Phosphorus Metabolism-Related Genes Serve as Novel Biomarkers for Predicting Prognosis in Bladder Cancer: A Bioinformatics Analysis.Iran J Public Health. 2024 Sep;53(9):1935-1950. doi: 10.18502/ijph.v53i9.16449. Iran J Public Health. 2024. PMID: 39429662 Free PMC article. Review.
Cited by
-
Identification of Immune-Related Subtypes and Construction of a Novel Prognostic Model for Bladder Urothelial Cancer.Biomolecules. 2022 Nov 11;12(11):1670. doi: 10.3390/biom12111670. Biomolecules. 2022. PMID: 36421685 Free PMC article.
-
Identification and validation of immune-related hub genes based on machine learning in prostate cancer and AOX1 is an oxidative stress-related biomarker.Front Oncol. 2023 Jul 31;13:1179212. doi: 10.3389/fonc.2023.1179212. eCollection 2023. Front Oncol. 2023. PMID: 37583929 Free PMC article.
-
Gene signatures associated with exosomes as diagnostic markers of postpartum depression and their role in immune infiltration.Front Endocrinol (Lausanne). 2025 Jul 17;16:1542327. doi: 10.3389/fendo.2025.1542327. eCollection 2025. Front Endocrinol (Lausanne). 2025. PMID: 40747300 Free PMC article.
-
Novel diagnostic biomarkers of oxidative stress, immune- infiltration characteristics and experimental validation of SERPINE1 in colon cancer.Discov Oncol. 2023 Nov 18;14(1):206. doi: 10.1007/s12672-023-00833-w. Discov Oncol. 2023. PMID: 37980291 Free PMC article.
-
Intratumoral immune heterogeneity of prostate cancer characterized by typing and hub genes.J Cell Mol Med. 2023 Jan;27(1):101-112. doi: 10.1111/jcmm.17641. Epub 2022 Dec 16. J Cell Mol Med. 2023. PMID: 36524848 Free PMC article.
References
LinkOut - more resources
Full Text Sources

