

Identification of a Nomogram with an Autophagy-Related Risk Signature for Survival Prediction in Patients with Glioma
- PMID: 35210825
- PMCID: PMC8857975
- DOI: 10.2147/IJGM.S335571
Identification of a Nomogram with an Autophagy-Related Risk Signature for Survival Prediction in Patients with Glioma
Abstract
Background: Glioma is a common type of tumor in the central nervous system characterized by high morbidity and mortality. Autophagy plays vital roles in the development and progression of glioma, and is involved in both normal physiological and various pathophysiological progresses.
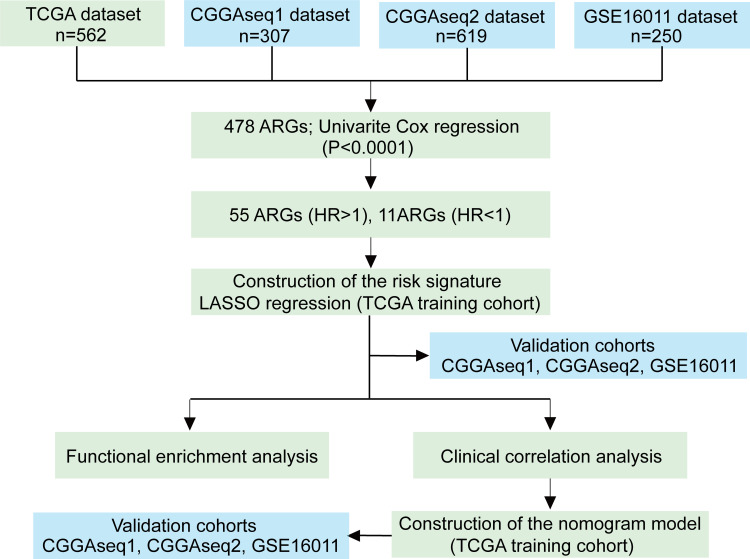
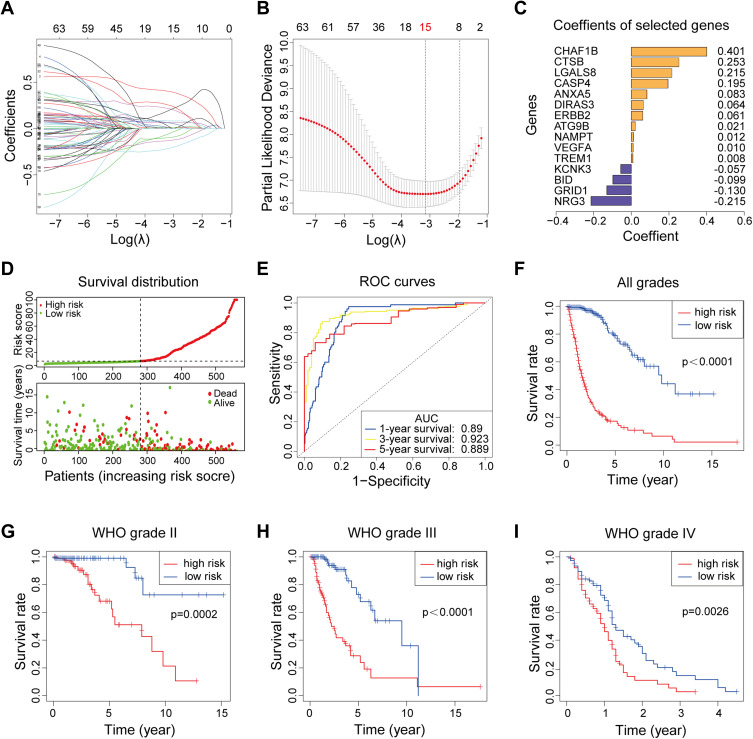
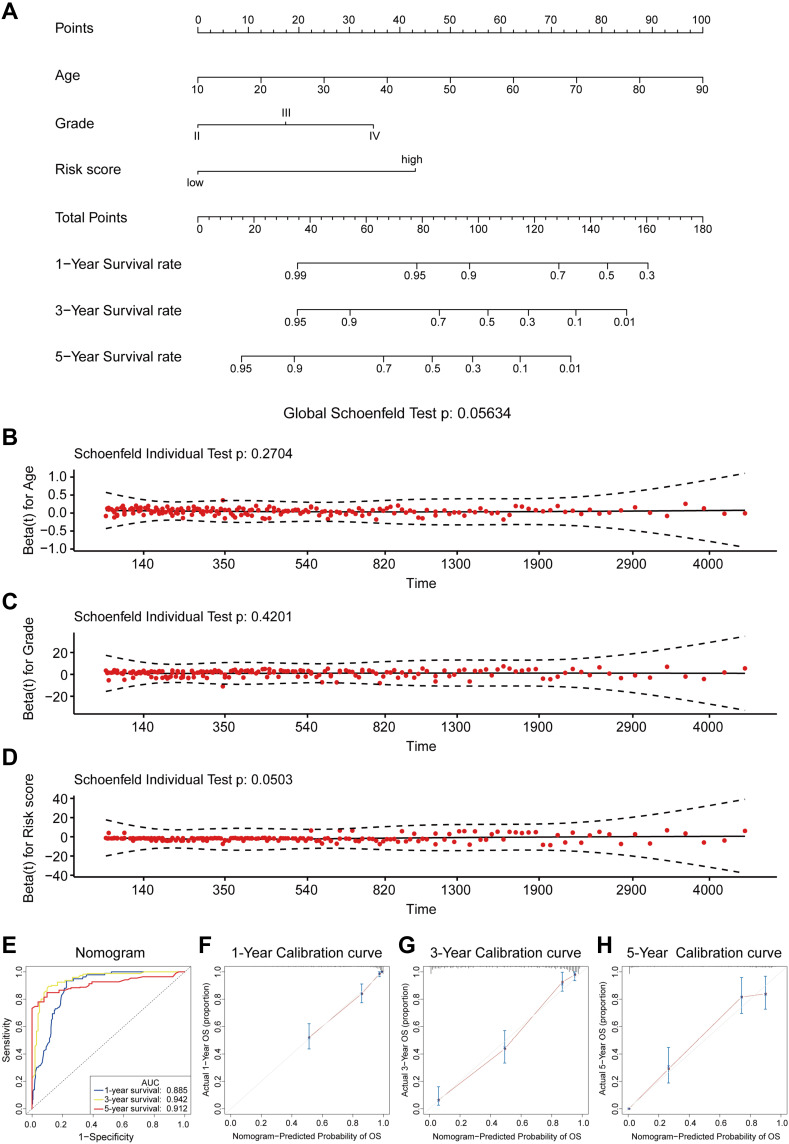
Patients and methods: A total of 531 autophagy-related genes (ARGs) were obtained and 1738 glioma patients were collected from three public databases. We performed least absolute shrinkage and selection operator regression to identify the optimal prognosis-related genes and constructed an autophagy-related risk signature. The performance of the signature was validated by receiver operating characteristic analysis, survival analysis, clinic correlation analysis, and Cox regression. A nomogram model was established by using multivariate Cox regression analysis. Schoenfeld's global and individual test were used to estimate time-varying covariance for the assumption of the Cox proportional hazard regression analysis. The R programming language was used as the main data analysis and visualizing tool.
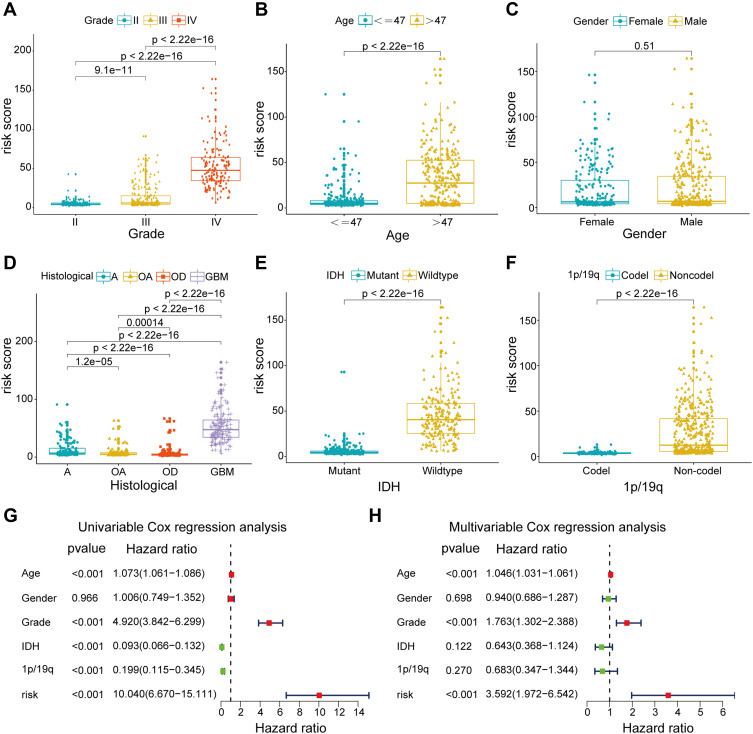
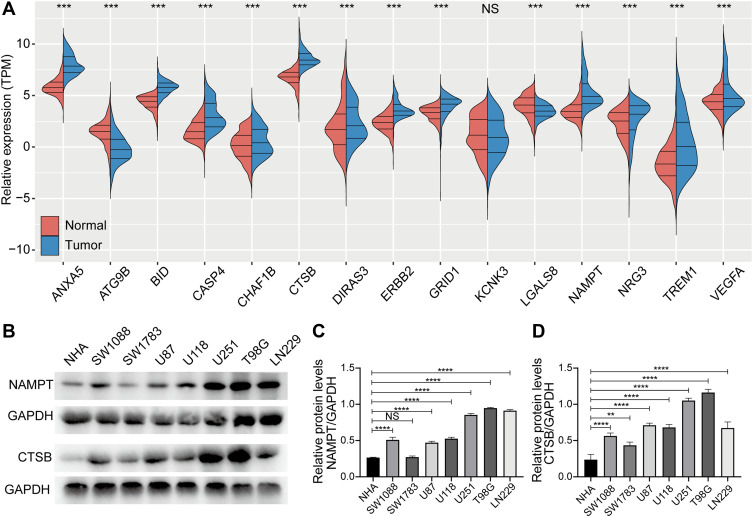
Results: An overall survival-related risk signature consisting of 15 ARGs was constructed and significantly stratified glioma patients into high- and low-risk groups (P < 0.0001). The area under the ROC curve of 1-, 3-, 5-year survival was 0.890, 0.923, and 0.889, respectively. Univariate and multivariate Cox analyses indicated that the risk signature was a satisfactory independent prognostic factor. Moreover, a nomogram model integrating risk signature with clinical information for predicting survival rates of patients with glioma was constructed (C-index=0.861±0.024).
Conclusion: This study constructed a novel and reliable ARG-related risk signature, which was verified as a satisfactory prognostic marker. The nomogram model could provide a reference for individually predicting the prognosis for each patient with glioma and promoting the selection of optimal treatment.
Keywords: autophagy; glioma; nomogram; prognosis; risk signature.
© 2022 Fu et al.
Conflict of interest statement
The authors report no conflicts of interest in this work.
Figures
Similar articles
-
Development and Validation of Autophagy-Related Gene Signature and Nomogram for Predicting Survival in Oral Squamous Cell Carcinoma.Front Oncol. 2020 Oct 16;10:558596. doi: 10.3389/fonc.2020.558596. eCollection 2020. Front Oncol. 2020. PMID: 33178587 Free PMC article.
-
Nomogram based on autophagy related genes for predicting the survival in melanoma.BMC Cancer. 2021 Nov 22;21(1):1258. doi: 10.1186/s12885-021-08928-9. BMC Cancer. 2021. PMID: 34809598 Free PMC article.
-
The novel transcriptomic signature of angiogenesis predicts clinical outcome, tumor microenvironment and treatment response for prostate adenocarcinoma.Mol Med. 2022 Jul 14;28(1):78. doi: 10.1186/s10020-022-00504-6. Mol Med. 2022. PMID: 35836112 Free PMC article.
-
An Autophagy-Related Gene Signature Associated With Clinical Prognosis and Immune Microenvironment in Gliomas.Front Oncol. 2020 Oct 19;10:571189. doi: 10.3389/fonc.2020.571189. eCollection 2020. Front Oncol. 2020. PMID: 33194668 Free PMC article.
-
Construction and Validation of a Prognostic Risk Model for Triple-Negative Breast Cancer Based on Autophagy-Related Genes.Front Oncol. 2022 Feb 4;12:829045. doi: 10.3389/fonc.2022.829045. eCollection 2022. Front Oncol. 2022. PMID: 35186763 Free PMC article.
Cited by
-
Protein Quality Control in Glioblastoma: A Review of the Current Literature with New Perspectives on Therapeutic Targets.Int J Mol Sci. 2022 Aug 27;23(17):9734. doi: 10.3390/ijms23179734. Int J Mol Sci. 2022. PMID: 36077131 Free PMC article. Review.
-
Natural Compounds That Target Glioma Stem Cells.NeuroSci. 2025 Jun 5;6(2):52. doi: 10.3390/neurosci6020052. NeuroSci. 2025. PMID: 40559213 Free PMC article. Review.
-
Prognosis Individualized: Survival predictions for WHO grade II and III gliomas with a machine learning-based web application.NPJ Digit Med. 2023 Oct 26;6(1):200. doi: 10.1038/s41746-023-00948-y. NPJ Digit Med. 2023. PMID: 37884599 Free PMC article.
-
Advancements in Image-Based Models for High-Grade Gliomas Might Be Accelerated.Cancers (Basel). 2024 Apr 19;16(8):1566. doi: 10.3390/cancers16081566. Cancers (Basel). 2024. PMID: 38672647 Free PMC article. Review.
References
-
- Lapointe S, Perry A, Butowski NA. Primary brain tumours in adults. Lancet. 2018;392(10145):432–446. - PubMed
LinkOut - more resources
Full Text Sources
