

Changes in Electroencephalography Activity of Sensory Areas Linked to Car Sickness in Real Driving Conditions
- PMID: 35210997
- PMCID: PMC8862765
- DOI: 10.3389/fnhum.2021.809714
Changes in Electroencephalography Activity of Sensory Areas Linked to Car Sickness in Real Driving Conditions
Abstract
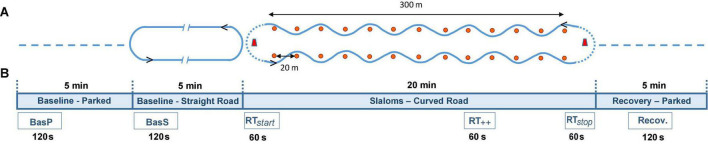
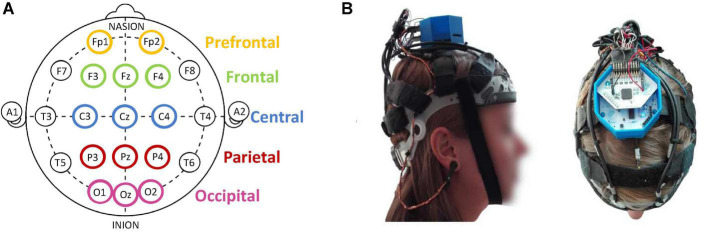
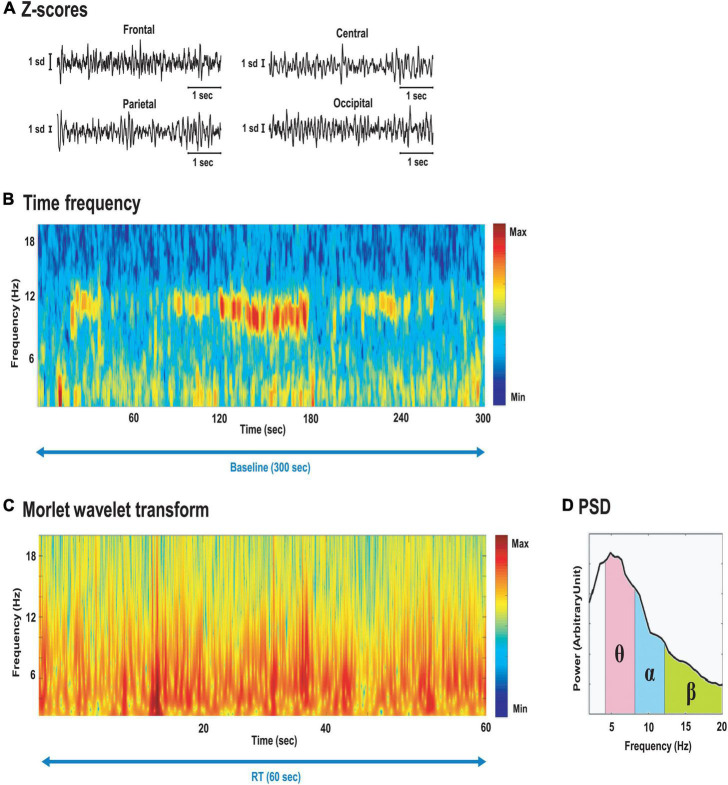
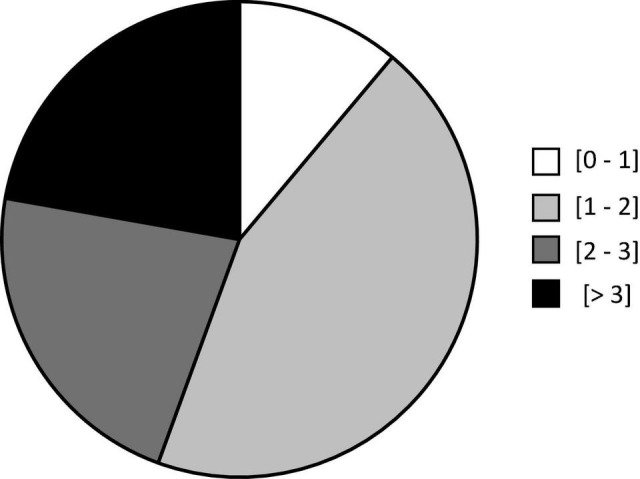
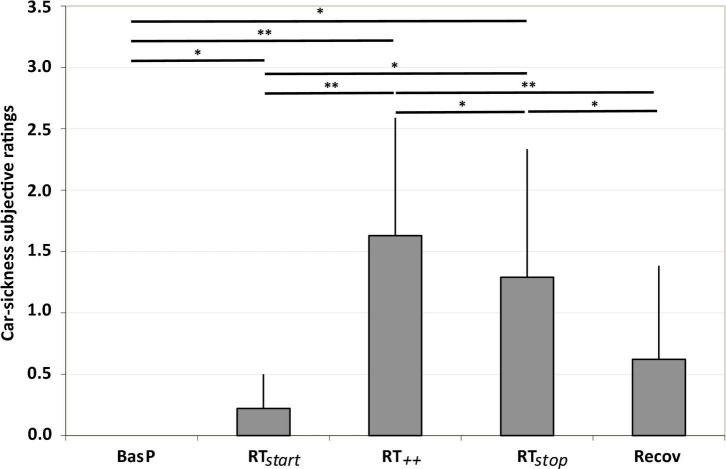
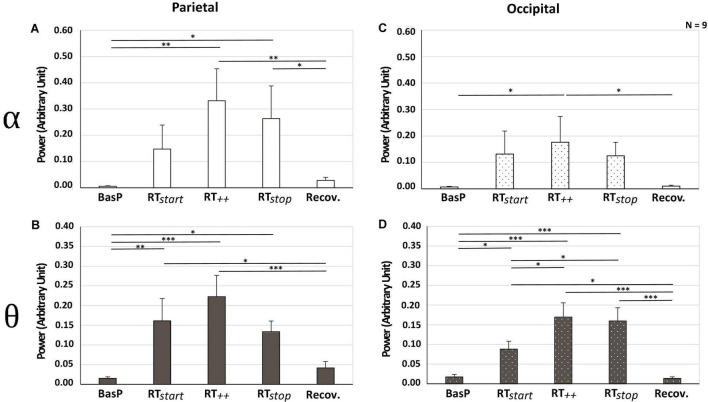
Car sickness is a major concern for car passengers, and with the development of autonomous vehicles, increasing numbers of car occupants are likely to be affected. Previous laboratory studies have used EEG measurements to better understand the cerebral changes linked to symptoms. However, the dynamics of motion in labs/simulators differ from those of a real car. This study sought to identify specific cerebral changes associated with the level of car sickness experienced in real driving conditions. Nine healthy volunteers participated as front passengers in a slalom session inducing lateral movements at very low frequency (0.2 Hz). They were continuously monitored via EEG recordings and subjectively rated their level of symptoms after each slalom, using a 5-point likert scale. Car-sickness symptoms evolved concomitantly with changes in theta and alpha power in the occipital and parietal areas. These changes may reflect altered sensory integration, as well as a possible influence of sleepiness mitigating symptoms.
Keywords: EEG activity; car passenger; car sickness; real driving; sensory integration.
Copyright © 2022 Henry, Bougard, Bourdin and Bringoux.
Conflict of interest statement
The authors declare that the research was conducted in the absence of any commercial or financial relationships that could be construed as a potential conflict of interest.
Figures
Similar articles
-
EEG-based evaluation of motion sickness and reducing sensory conflict in a simulated autonomous driving environment.Annu Int Conf IEEE Eng Med Biol Soc. 2022 Jul;2022:4026-4030. doi: 10.1109/EMBC48229.2022.9871407. Annu Int Conf IEEE Eng Med Biol Soc. 2022. PMID: 36086173
-
Comparing the Differences in Brain Activities and Neural Comodulations Associated With Motion Sickness Between Drivers and Passengers.IEEE Trans Neural Syst Rehabil Eng. 2021;29:1259-1267. doi: 10.1109/TNSRE.2021.3092876. Epub 2021 Jul 12. IEEE Trans Neural Syst Rehabil Eng. 2021. PMID: 34181544
-
Combining visual cues with relaxing music, perfume and ventilation to reduce passenger car sickness: An experimental study.Appl Ergon. 2025 Feb;123:104387. doi: 10.1016/j.apergo.2024.104387. Epub 2024 Oct 31. Appl Ergon. 2025. PMID: 39486345
-
Factors Affecting Car Sickness of Passengers Traveled by Vehicles in North Shewa Zone, Oromia, Ethiopia.J Environ Public Health. 2022 Feb 22;2022:6642603. doi: 10.1155/2022/6642603. eCollection 2022. J Environ Public Health. 2022. PMID: 35242196 Free PMC article.
-
[Motion sickness].Med Trop (Mars). 1997;57(4 Bis):483-7. Med Trop (Mars). 1997. PMID: 9612757 Review. French.
Cited by
-
Exploring neurophysiological correlates of visually induced motion sickness using electroencephalography (EEG).Exp Brain Res. 2023 Oct;241(10):2463-2473. doi: 10.1007/s00221-023-06690-x. Epub 2023 Aug 31. Exp Brain Res. 2023. PMID: 37650899
References
LinkOut - more resources
Full Text Sources