

Evaluation of Laser Confocal Raman Spectroscopy as a Non-Invasive Method for Detecting Sperm DNA Contents
- PMID: 35211034
- PMCID: PMC8861532
- DOI: 10.3389/fphys.2022.827941
Evaluation of Laser Confocal Raman Spectroscopy as a Non-Invasive Method for Detecting Sperm DNA Contents
Abstract
Research question: Is Raman spectroscopy an efficient and accurate method to detect sperm chromosome balance state by DNA content differences?
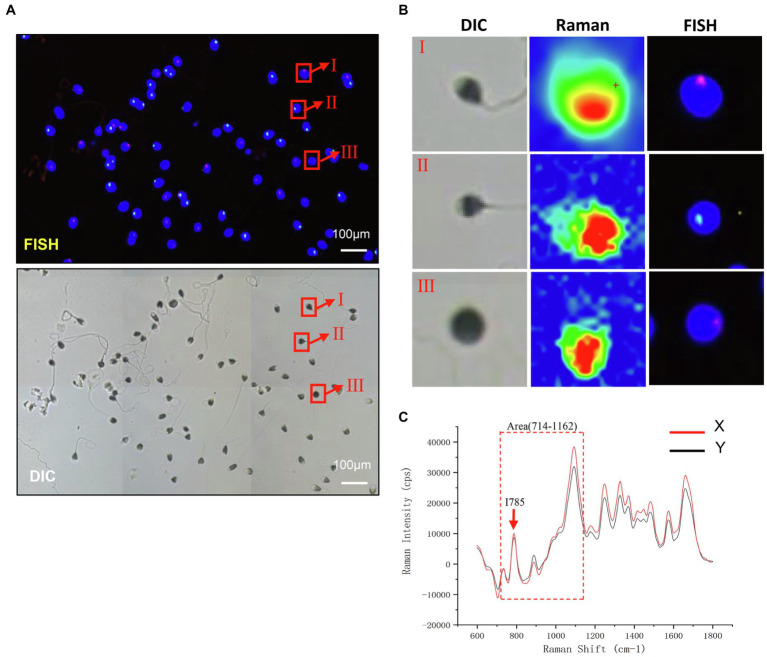
Design: Semen samples were provided by diploid healthy men, and the analysis parameters met the current World Health Organization standards. The DNA content was assessed by analysis of the corresponding spectra obtained from a laser confocal Raman spectroscope. The sperm sex chromosome information was obtained by fluorescence in situ hybridization (FISH). Comparative analysis was performed between FISH results and Raman spectral analysis results.
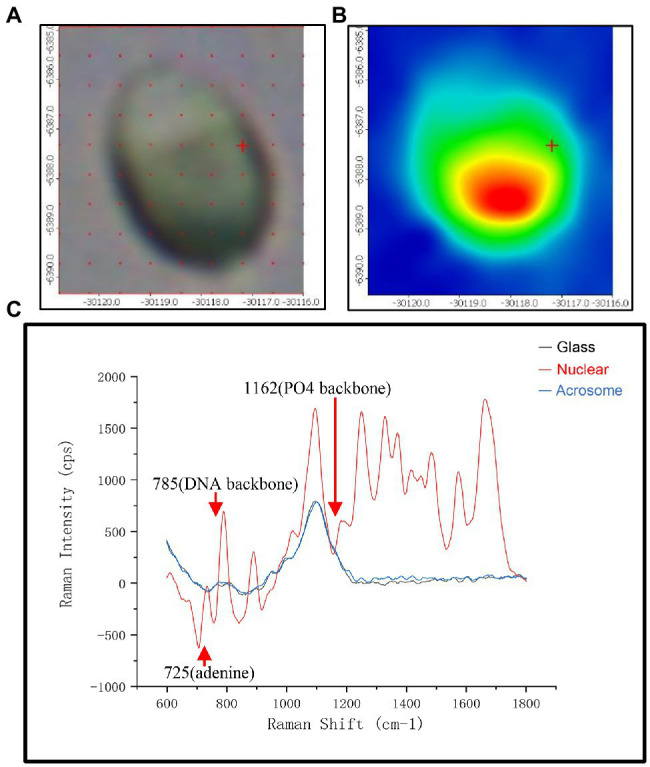
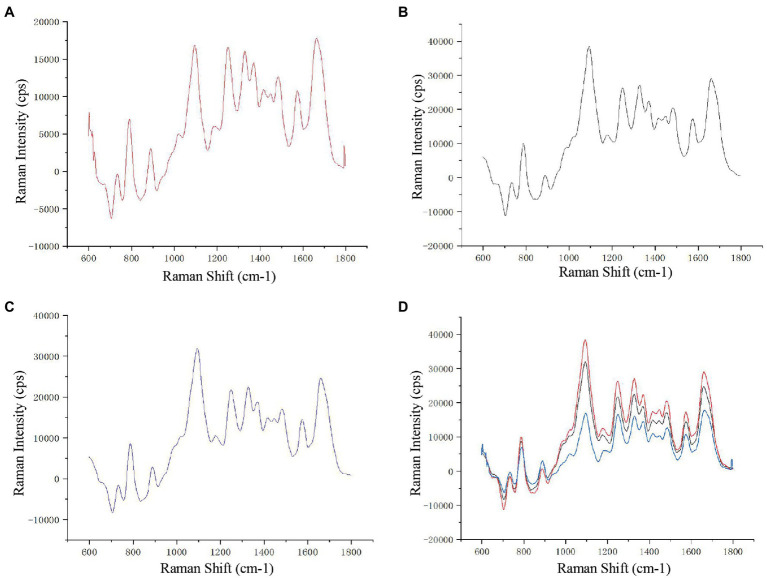
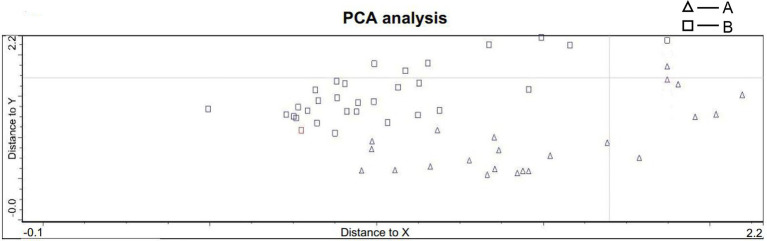
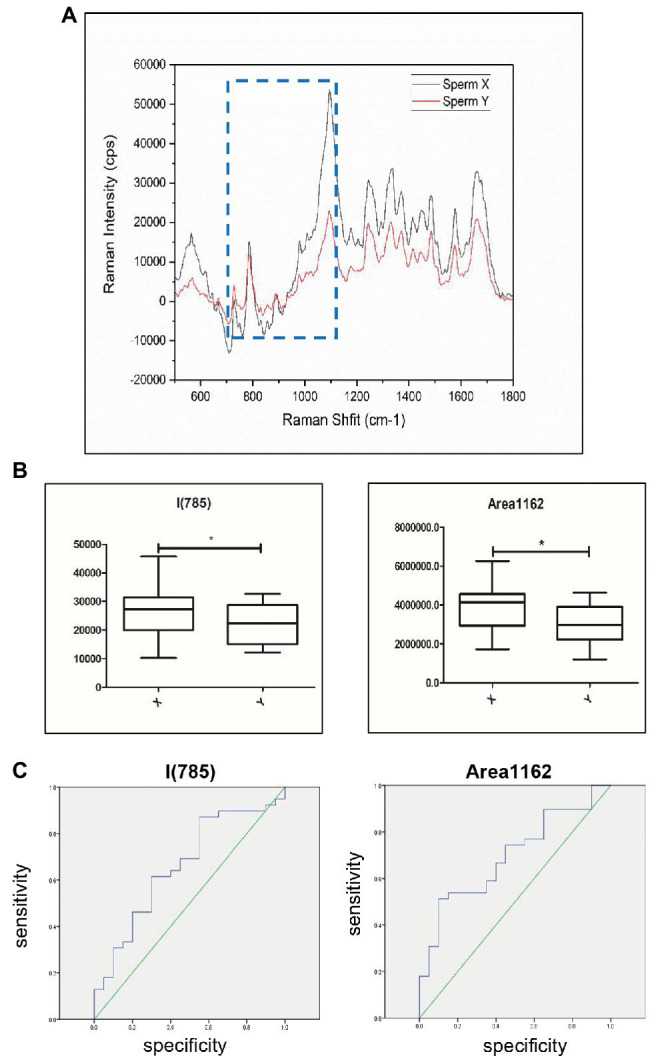
Results: Different parts of the sperm head showed different spectral signal intensities, which indicated that there were different chemical components. Standard principal component analysis (PCA) can preliminarily classify sperm with different DNA contents into two groups. Further analysis showed that there were significant differences in the 785 DNA backbone peaks and 714-1,162 cm-1 DNA skeleton regions among sperm with different DNA contents. The peak and regional peak of the DNA skeleton of X sperm were significantly higher than those of Y sperm (X vs. Y, p < 0.05). The above sperm types were confirmed by FISH. ROC curve analysis shows that there is a correlation between the Raman spectrum data and FISH results.
Conclusion: Raman spectroscopy can identify X and Y sperms by analyzing the DNA content difference. However, the accuracy of the detection still needs to be improved. Nevertheless, Raman spectroscopy has a potential application value in the field of sperm aneuploidy detection and may even be used as a non-invasive predictor of sperm aneuploid state in preimplantation genetic testing (PGT-A).
Keywords: DNA content; fluorescence in situ hybridization; human sperm; laser confocal Raman spectroscopy; preimplantation genetic testing.
Copyright © 2022 Li, Ji, Wang, Zhang, Zhang, Tang, Lin and Hu.
Conflict of interest statement
DW and YZ were employed by company Thermo Fisher Scientific. The remaining authors declare that the research was conducted in the absence of any commercial or financial relationships that could be construed as a potential conflict of interest.
Figures
Similar articles
-
Raman micro-spectroscopy analysis of different sperm regions: a species comparison.Mol Hum Reprod. 2018 Apr 1;24(4):185-202. doi: 10.1093/molehr/gax071. Mol Hum Reprod. 2018. PMID: 29528451
-
Label-Free Evaluation of Chromatin Condensation in Human Normal Morphology Sperm Using Raman Spectroscopy.Reprod Sci. 2021 Sep;28(9):2527-2539. doi: 10.1007/s43032-021-00494-6. Epub 2021 Apr 20. Reprod Sci. 2021. PMID: 33877640 Free PMC article.
-
Spontaneous rates of sex chromosomal aneuploidies in sperm and offspring of mice: a validation of the detection of aneuploid sperm by fluorescence in situ hybridization.Mutat Res. 1996 Dec;372(2):259-68. doi: 10.1016/s0027-5107(96)00145-5. Mutat Res. 1996. PMID: 9015144
-
Sperm chromosomal abnormalities and their contribution to human embryo aneuploidy.Biol Reprod. 2019 Dec 24;101(6):1091-1101. doi: 10.1093/biolre/ioz125. Biol Reprod. 2019. PMID: 31318411 Review.
-
Multicolor fluorescence in situ hybridization analysis of meiotic chromosome segregation in a 47,XYY male and a review of the literature.Am J Med Genet. 2000 Jul 3;93(1):40-6. doi: 10.1002/1096-8628(20000703)93:1<40::aid-ajmg7>3.0.co;2-k. Am J Med Genet. 2000. PMID: 10861680 Review.
Cited by
-
Non-invasive applications of Raman spectroscopy in assisted reproduction.Front Endocrinol (Lausanne). 2025 May 8;16:1577702. doi: 10.3389/fendo.2025.1577702. eCollection 2025. Front Endocrinol (Lausanne). 2025. PMID: 40405973 Free PMC article. Review.
-
Surface-Enhanced Raman Spectroscopy on Gold Nanoparticle for Sperm Quality Discrimination.Molecules. 2025 Apr 23;30(9):1876. doi: 10.3390/molecules30091876. Molecules. 2025. PMID: 40363683 Free PMC article.
-
A Narrative Review on the Sperm Selection Methods in Assisted Reproductive Technology: Out with the New, the Old Is Better?J Clin Med. 2025 Feb 7;14(4):1066. doi: 10.3390/jcm14041066. J Clin Med. 2025. PMID: 40004597 Free PMC article. Review.
References
LinkOut - more resources
Full Text Sources
Other Literature Sources
Miscellaneous