. 2022 Feb 8:12:794137.
doi: 10.3389/fpls.2021.794137. eCollection 2021.

Integrated Metabolomic and Transcriptomic Analysis of the Flavonoid Accumulation in the Leaves of Cyclocarya paliurus at Different Altitudes

Affiliations

Integrated Metabolomic and Transcriptomic Analysis of the Flavonoid Accumulation in the Leaves of Cyclocarya paliurus at Different Altitudes

Zhaokui Du et al. Front Plant Sci. .

Abstract

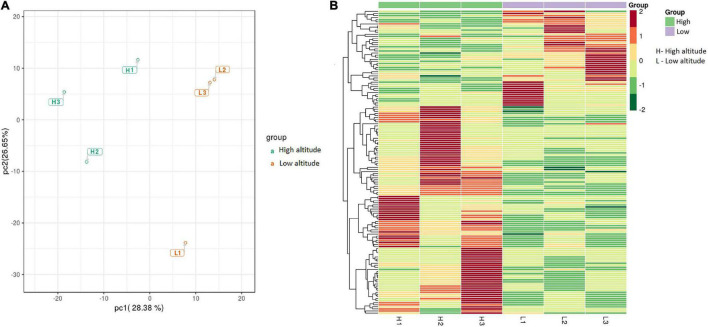
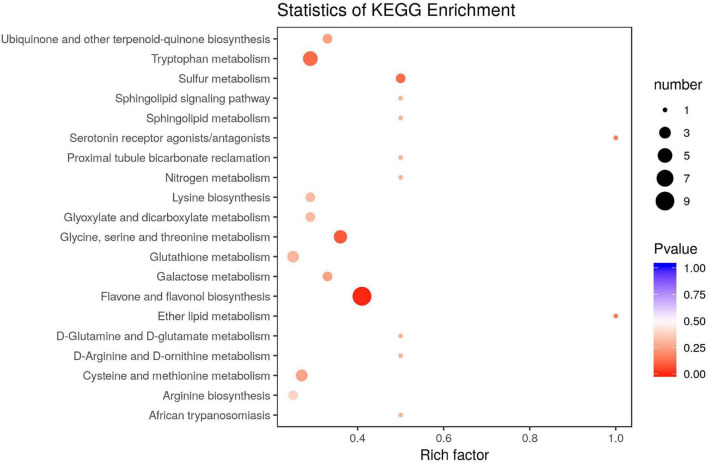
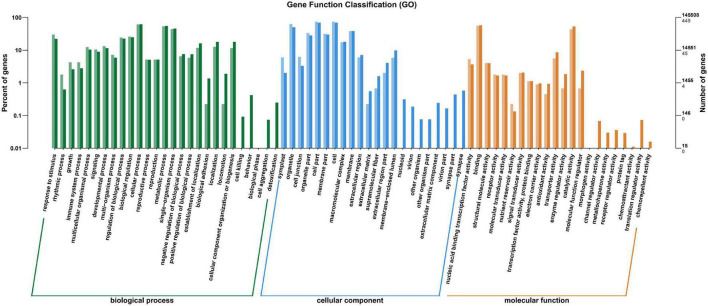
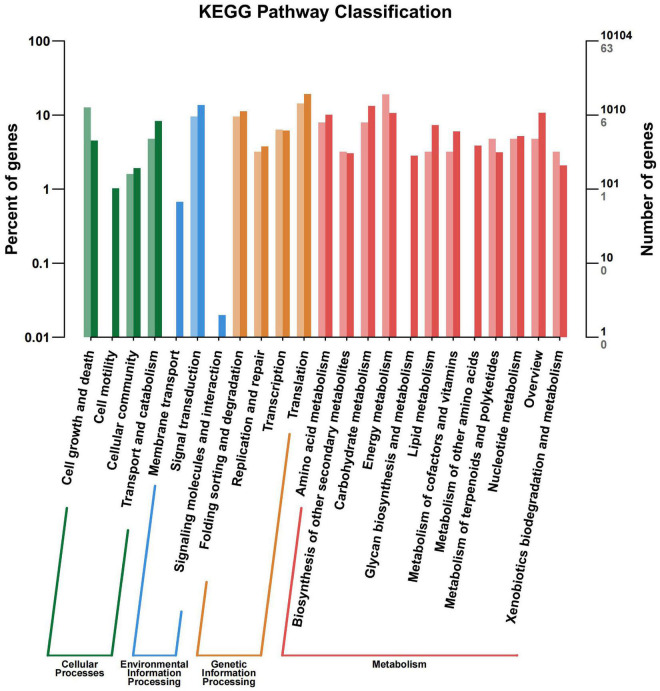
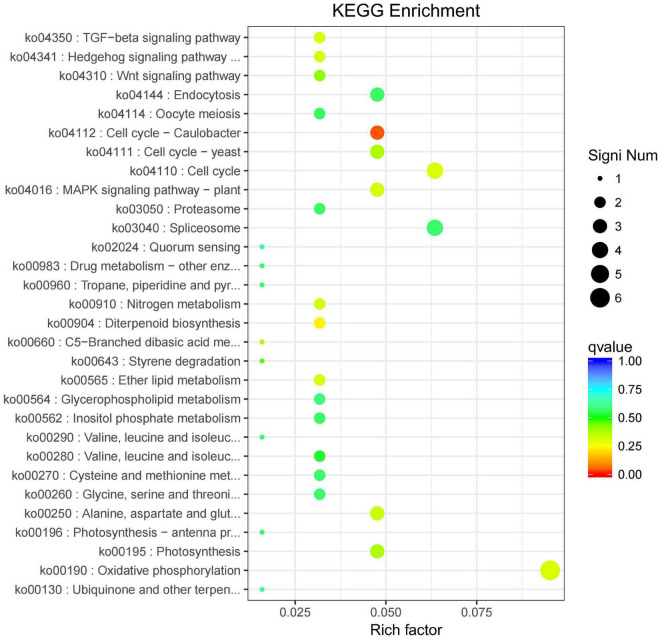
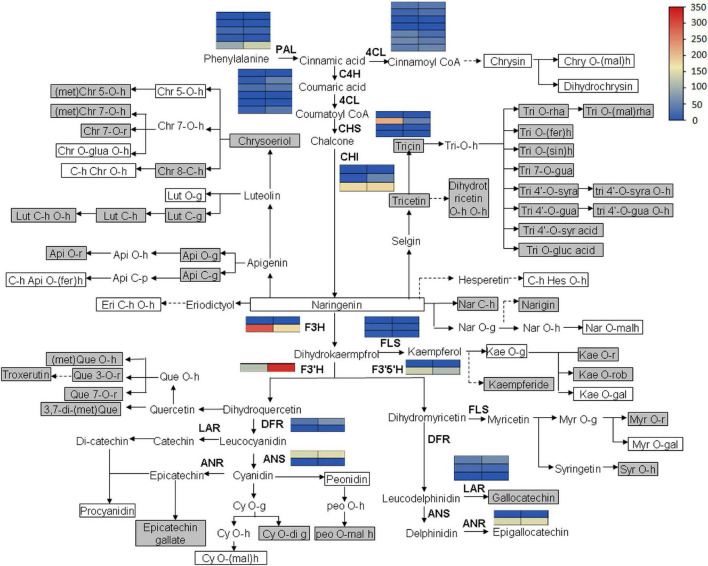
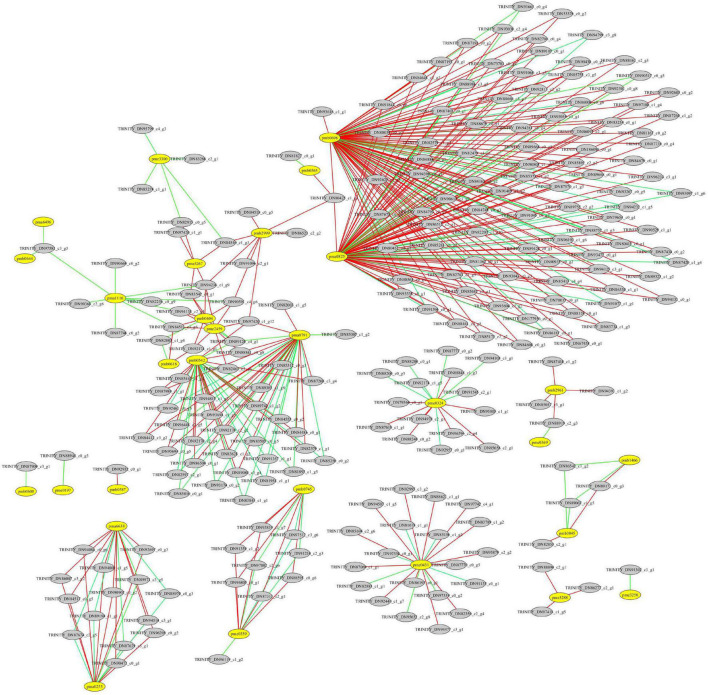
Cyclocarya paliurus is a medicinal plant containing flavonoids, triterpenoids, polyphenolics, polysaccharides, and other compounds with diverse biological functions. C. paliurus is distributed across altitudes ranging from 400 to 1,000 m. However, little is known about the effect of altitude on metabolite accumulation in C. paliurus. Also, the biosynthetic pathway involved in flavonoid accumulation in C. paliurus has not been fully elucidated. In this study, mature leaves of C. paliurus growing at low altitude (280 m) and high altitude (920 m) were sampled and subjected to metabolomic and transcriptomic analyses. The flavonoid content and composition were higher in the leaves of C. paliurus collected at high altitude than in those collected at low altitude. Most of the differentially accumulated metabolites (DAMs) were enriched in "flavone and flavonol biosynthesis." The significant differentially expressed genes (DEGs) between low and high altitudes were mainly enriched in "biological process." The most heavily enriched KEGG pathway was related to the subcategory "Oxidative phosphorylation," indicating that complicated biological processes are involved in the response of C. paliurus to harsh environmental factors. High UV-light might be the main influencing factor among the harsh environmental factors found in high altitudes. Integrated analysis of metabolomic and transcriptomic data showed that 31 flavonoids were significantly correlated with 227 DEGs, resulting in 412 related pairs (283 positive and 129 negative) between the DEGs and flavonoids. The possible mechanisms underlying the differentially accumulation of flavonoids at different altitude might be due to variations in transport and relocation of flavonoids in C. paliurus leaves, but not different flavonoid biosynthesis pathways. The up-regulation of genes related to energy and protein synthesis might contribute to flavonoid accumulation at high altitudes. This study broadens our understanding of the effect of altitude on metabolite accumulation and biosynthesis in C. paliurus.

Keywords: Cyclocarya paliurus; altitude; flaovnoid; metabolome; transcriptome.


Conflict of interest statement

The authors declare that the research was conducted in the absence of any commercial or financial relationships that could be construed as a potential conflict of interest.

Figures

FIGURE 1
FIGURE 1
Effect of altitude on flavonoid content in the leaves of Cyclocarya paliurus. ** Indicates significant difference at P < 0.01.
FIGURE 2
FIGURE 2
Principal component analysis (PCA) (A) and heatmap (B) of differentially accumulated metabolites (DAMs) in the leaves of Cyclocarya paliurus between low altitude (L1∼L3) and high altitude (H1∼H3). The log2 transformed values of DAMs are indicated from green to red (low to high).
FIGURE 3
FIGURE 3
KEGG pathway enrichment of differentially accumulated metabolites (DAMs) in the leaves of Cyclocarya paliurus between low and high altitudes.
FIGURE 4
FIGURE 4
Volcano plot of differentially expressed genes (DEGs) in the leaves of Cyclocarya paliurus between low and high altitudes.
FIGURE 5
FIGURE 5
Gene ontology categories of differentially expressed genes (DEGs) in the leaves of Cyclocarya paliurus between low and high altitudes.
FIGURE 6
FIGURE 6
KEGG pathway terms assignment of differentially expressed genes (DEGs) in the leaves of Cyclocarya paliurus between low and high altitudes.
FIGURE 7
FIGURE 7
KEGG pathway enrichment of differentially expressed genes (DEGs) in the leaves of Cyclocarya paliurus between low and high altitudes.
FIGURE 8
FIGURE 8
Flavonoid biosynthesis and accumulation pathway in the leaves of Cyclocarya paliurus at low and high altitudes. The blue and red colors refer to the expression level of genes from low to high based on fragments per kilobase of exon per million fragments mapped (FPKM) value clustering. The gray box indicates significantly increased metabolites. The white box indicates significantly decreased metabolites. The metabolites without box indicate no significant change. Api, apigenin; Chr, chrysoeriol; Chry, Chrysin; Cy, cyaniding, Dp, delphinidin; Eri, Eriodictyol; fer, feruloyl; gal, galactoside; g, glucoside; gal, galactoside; glua, glucuronic acid; gua, guaiacylglycerol; h, hexoside/hexosyl; Hes, hesperetin; Kae, Kaempferol; Lut, Luteolin; mal, malonyl; met, methyl; Myr, Myricetin; Nar, Naringenin; Peo, Peonidin; Que, Quercetin; r, rutinoside; rha, rhamnoside; rob, robinobioside; rut, rutinoside; sin, sinapolyl; syr, syringic; syra, syringic alcohol; Tri, Tricin; PAL, phenylalanine ammonialyase; 4CL, 4-coumarate coenzyme A ligase; C4H, Cinnamate 4-hydroxylase; CHS, chalcone synthase; CHI, chalcone isomerase; F3H, flavanone 3-hydroxylase; FLS, flavonol synthase; F3′H, flavonoid 3′-hydroxylase; F3′5′H, flavonoid 3′,5′-hydroxylase; DFR, Dihydro flavonol reductase; LAR, Leucoanthocyanidin reductase; ANS, Anthocyanidin synthase; ANR, Anthocyanidin reductase.
FIGURE 9
FIGURE 9
Correlation analysis between differentially expressed genes (DEGs) and differentially accumulated flavonoids in the leaves of Cyclocarya paliurus at low and high altitudes. The yellow circle represents flavonoids; the gray circle represents DEGs. The red line indicates a significant positive correlation; the green line indicates a significant negative correlation. pma0253, O-methylchrysoeriol 5-O-hexoside; pma0791, Naringenin O-malonylhexoside; pma0825, chrysin O-malonylhexoside; pma1116, kaempferide; pma6496, luteolin 6-C-glucoside; pma6638, O-methylchrysoeriol 7-O-hexoside; pmb0542, cyaniding 3-O-malonylherxoside; pmb0563, peonidin; pmb0587, chrysoeriol O-glucuronic acid-O-hexoside; pmb0600, chrysoerio 7-O-rutinoside; pmb0604, kaempferol 3-o-glucoside; pmb0618, 8-C-hexosyl-hesperetin O-hexoside; pmb0644, luteolin C-hexoside; pmb0696, 8-C-hexosyl chrysoeriol O-hexoside; pmb0745, tricin 4′-O-syringyl alcohol; pmb1466, tricin 4′-O-syringic acid; pmb2961, peonidin O-malonylhexoside; pmb2999, chrysoeriol 5-O-hexoside; pmb3045, tricin O-glucuronic acid; pme0197, quercetin 3-O-rutinoside; pme0324, chrysin; pme0359, apigenin 5-O-glucoside; pme0369, kaempferol 3-O-rutinoside; pme0431, procyanidin A1; pme1535, gallocatechin; pme1562, epicatechin gallate; pme2459, luteolin 7-O-glucoside; pme3250, biochanin A; pme3267, kaempferol 3-O-galactoside; pme3288, 3,7-di-O-methylquercetin; pme3300, tricetin.
FIGURE 10
FIGURE 10
Real-time quantitative polymerase chain reaction (RT-qPCR) validation of candidate unigenes involved in Cyclocarya paliurus phenolic acid biosynthesis. The histogram shows the relative gene expression obtained via RT-qPCR. The transcripts per million (TPM) of each million mapped fragments of the transcriptome are represented by a line graph. The right y-axis indicates gene expression levels calculated as TPM. The left y-axis indicates relative gene expression levels obtained via RT-qPCR.

References

    1. Agharbaoui Z., Leclercq M., Remita M. A., Badawi M. A., Lord E., Houde M., et al. (2015). An integrative approach to identify hexaploid wheat miRNAome associated with development and tolerance to abiotic stress. BMC Genomics 16:339. 10.1186/s12864-015-1490-8 - DOI - PMC - PubMed
    1. Blake C. C. F., Rice D. (1981). Phosphoglycerate kinase. Philos. Trans. R. Soc. B Biol. Sci. 293 93–104. 10.1098/rstb.1981.0063 - DOI - PubMed
    1. Chang P. Y., Hsieh M. J., Hsieh Y. S., Chen P. N., Yang J. S., Lo F. C., et al. (2017). Tricetin inhibits human osteosarcoma cells metastasis by transcriptionally repressing MMP-9 via p38 and Akt pathways. Environ. Toxicol. 32 2032–2040. 10.1002/tox.22380 - DOI - PubMed
    1. Chung T. T., Chuang C. Y., Teng Y. H., Hsieh M. J., Lai J. C., Chuang Y. T., et al. (2017). Tricetin suppresses human oral cancer cell migration by reducing matrix metalloproteinase-9 expression through the mitogen-activated protein knase signaling pathway. Environ. Toxicol. 32 2392–2399. 10.1002/tox.22452 - DOI - PubMed
    1. Dong N. Q., Lin H. X. (2021). Contribution of phenylpropanoid metabolism to plant development and plant-environment interactions. J. Integr. Plant Biol. 63 180–209. 10.1111/jipb.13054 - DOI - PubMed

LinkOut - more resources