. 2022 Feb 8:13:836015.
doi: 10.3389/fpls.2022.836015. eCollection 2022.

Potential Role of Domains Rearranged Methyltransferase7 in Starch and Chlorophyll Metabolism to Regulate Leaf Senescence in Tomato

Affiliations

Potential Role of Domains Rearranged Methyltransferase7 in Starch and Chlorophyll Metabolism to Regulate Leaf Senescence in Tomato

Yu Xin Wen et al. Front Plant Sci. .

Abstract

Deoxyribonucleic acid (DNA) methylation is an important epigenetic mark involved in diverse biological processes. Here, we report the critical function of tomato (Solanum lycopersicum) Domains Rearranged Methyltransferase7 (SlDRM7) in plant growth and development, especially in leaf interveinal chlorosis and senescence. Using a hairpin RNA-mediated RNA interference (RNAi), we generated SlDRM7-RNAi lines and observed pleiotropic developmental defects including small and interveinal chlorosis leaves. Combined analyses of whole genome bisulfite sequence (WGBS) and RNA-seq revealed that silencing of SlDRM7 caused alterations in both methylation levels and transcript levels of 289 genes, which are involved in chlorophyll synthesis, photosynthesis, and starch degradation. Furthermore, the photosynthetic capacity decreased in SlDRM7-RNAi lines, consistent with the reduced chlorophyll content and repression of genes involved in chlorophyll biosynthesis, photosystem, and photosynthesis. In contrast, starch granules were highly accumulated in chloroplasts of SlDRM7-RNAi lines and associated with lowered expression of genes in the starch degradation pathway. In addition, SlDRM7 was activated by aging- and dark-induced senescence. Collectively, these results demonstrate that SlDRM7 acts as an epi-regulator to modulate the expression of genes related to starch and chlorophyll metabolism, thereby affecting leaf chlorosis and senescence in tomatoes.

Keywords: DNA methylation; SlDRM7; chlorophyll metabolism; leaf chlorosis and senescence; starch excess.


Conflict of interest statement

The authors declare that the research was conducted in the absence of any commercial or financial relationships that could be construed as a potential conflict of interest.

Figures

FIGURE 1
FIGURE 1
Generation and characterization of tomato SlDRM7-RNAi lines. (A) Schematic of the pRNAi-SlDRM7 construct. A 230-bp fragment of SlDRM7 (Solyc04g005250.2) was cloned into the pRNAi-LIC vector to generate pRNAi-SlDRM7. (B) Summary of segregation of leaf chlorosis/senescence phenotype in T0 to T8 generations of SlDRM7-RNAi lines. The numerator represents the number of progenies of SlDRM7-RNAi lines with maintained interveinal chlorosis/senescence leaves with kanamycin resistance, while the denominator represents the number of progenies with normal green leaves with kanamycin sensitivity. (C–I) Segregation of leaf chlorosis in SlDRM7-RNAi lines. wild-type (WT) seedlings display normal green leaves (C), while progenies of SlDRM7-RNAi lines display normal WT green leaves called drm7i_ns-1 (D), and drm7i_ns-2 (E), whereas progenies maintain interveinal chlorosis/senescence leaves called drm7i-1 (F,H) and drm7i-2 (G,I). Tomato seeds were spread and germinated directly in compost, and seedlings were photographed at 10 days after germination in (C–G) with bars = 1 cm, while seedlings were photographed at 6 weeks after germination in (H,I) with bars = 5 cm. (J) RT-qPCR analysis of the relative expression levels of SlDRM7 in leaves of WT and SlDRM7-RNAi lines at the six-leaf stage. Data are means ± SD of five biological replicates. Asterisks indicate the significant differences compared with WT (*P ≤ 0.05, ***P ≤ 0.001, one-way ANOVA, Tukey’s HSD). No difference with statistical significance was found for WT vs. drm7i_ns-1, and WT vs. drm7i_ns-2.
FIGURE 2
FIGURE 2
Measurement of photosynthetic pigment content and photosynthetic capacity. (A) The auto-fluorescence of chlorophyll in leaves of SlDRM7-RNAi lines. Strong chlorophyll auto-fluorescence intensity with almost no differences was observed in leaf Mesophyll cells from the 2nd compound leaves of wild-type AC (WT), two drm7i_ns lines, and the greening leaf Mesophyll (GLM) cells of two drm7i lines at the six-leaf stage, but much weaker in the yellowing leaf mesophyll (YLM) cells of two drm7i lines. WT, drm7i_ns-1 and drm7i_ns-2, drm7i-1 and drm7i-2 are shown. Bars = 20 μm. (B) The content of three photosynthetic pigments in leaf tissues of SlDRM7-RNAi lines. The content of chlorophyll a (chla) and chlorophyll b (chlb) (left panel), and carotenoid (right panel) was measured in the 2nd compound leaves of six-leaf-stage seedlings of WT, two drm7i_ns lines, and two drm7i lines, respectively. (C,D) Effect of SlDRM7-RNAi on photosynthesis. Light and CO2 response curves (C), as well as net photosynthetic rates (Pn), respiration rate, stomatal conductance (Gs), and transpiration rate (Tr) (D) of the 2nd compound leaves of six-leaf-stage seedlings of drm7i_ns-1 and two drm7i lines. Data are means ± SD (n = 3 in panel B, while n = 5 in panel D). Asterisks indicate the significant differences when compared with WT or drm7i_ns lines (*P ≤ 0.05, **P ≤ 0.01, ***P ≤ 0.001, one-way ANOVA, Tukey’s HSD).
FIGURE 3
FIGURE 3
Expression analysis of senescence-associated genes in WT and SlDRM7-RNAi leaf tissues. (A–H) RT-qPCR analysis of the relative expression levels of SlSAG12 (A), SlSAG13 (B), SlSAG15 (C), SlSRG1 (D), SlGLK1 (E), SlORE1S03 (F), SlORE1S06 (G), SlNAP2 (H) in mature leaves of the WT, two drm7i_ns lines, and two drm7i lines, respectively. Data are means ± SD of three biological duplicates. Asterisks (above error bar represent the difference with WT; above the short line represent the difference with drm7i_ns lines) indicate the significant differences (*P ≤ 0.05, **P ≤ 0.01, ***P ≤ 0.001, one-way ANOVA, Tukey’s HSD).
FIGURE 4
FIGURE 4
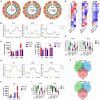
Effect of SlDRM7-RNAi on whole-genome DNA methylation. (A) Whole-genome bisulfite sequencing (WGBS) reveals DNA methylation profiles globally. Genome-wide methylations of 12 tomato chromosomes from WT, drm7i_ns-1, and drm7i-1 samples are illustrated in the mCG, mCHG, and mCHH contexts (where H is A, T, or C), and mC for TEs and genes. (B) Density plots of differential mCG, mCHG, and mCHH at the regions of the promoter, 5’-UTR, exon, intron, and 3’-UTR. Green, orange, and purple lines represent WT, drm7i_ns-1, and drm7i-1, respectively. (C) Numbers of differentially methylated regions (DMRs) and differentially methylated genes (DMGs) at CG, CHG, and CHH sites in drm7i vs. drm7i_ns. (D) Heat maps of the methylation level of DMRs at CG, CHG, and CHH sites in drm7i vs. drm7i_ns. (E) Overall DNA methylation level of hyper- and hypo-DMRs at CG, CHG, and CHH sites identified in drm7i_ns vs. drm7i. (F) Venn diagrams of DMGs associated with gene body (left) and promoter regions (right) in drm7i. (G) Density plots of differential mCG, mCHG, and mCHH at TEs and their 2-kb upstream and downstream regions. WT, drm7i_ns-1, and drm7i-1 are indicated. (H) Numbers of differentially methylated probes (DMPs) of TEs at CG, CHG, and CHH sites in drm7i-1 vs. drm7i_ns-1. (I) Methylation levels of hyper- and hypo-TEs in CG, CHG, and CHH sites.
FIGURE 5
FIGURE 5
Combinational analysis of differential DNA methylated genes (DMGs) and differentially expressed genes (DEGs). (A) Venn diagrams of DMGs and DEGs (fold change > 2, FDR < 0.05, and drm7i-1 or drm7i_ns-1 FPKM > 1). (B) Venn diagrams of hypermethylated/hypomethylated genes and up-/downregulated genes. (C) Numbers of meth-DMGs in CG, CHG, and CHH contexts. (D) Numbers of meth-DMGs with DMRs located at promoters or gene bodies. (E) Overall DNA methylation levels of meth-DEGs in drm7i-1 vs. drm7i_ns-1.
FIGURE 6
FIGURE 6
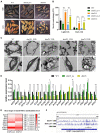
Analysis of down-regulated meth-DEGs. (A) Gene ontology enrichment analysis of 128 downregulated meth-DEGs. The size of the circle represents gene numbers, and the color represents the FDR. (B) Validation of RNA-seq using RT-qPCR for meth-DEGs involved in photosynthetic or chloroplast-related terms in (A). Data are shown as means ± SD of three biological duplicates. Asterisks (above error bar represent the difference with WT; above the short line represent the difference with drm7i_ns) indicate the significant differences (*P ≤ 0.05, **P ≤ 0.01, ***P ≤ 0.001, one-way ANOVA, Tukey’s HSD). (C) Heat map illustration of the methylation level of meth-DEGs shown in (B). (D) Heat map display of gene expression in the photosynthesis light reactions. Gene expression was determined by RNA-seq. (E) Heat map of expression of genes related to chlorophyll biosynthesis and chlorophyll degradation. Gene expression was determined by RNA-seq. (F) Heat map of the methylation levels of meth-DEGs in (E).
FIGURE 7
FIGURE 7
SlDRM7 functions in starch metabolism. (A,B) Iodine-iodide kalium staining (A) and measurement (B) of starch content of the leaves in a 12-h photoperiod. By harvesting at the end of daylight (light 12 h) and the end of the night (dark 12 h), leaves at the same position of the drm7i_ns-1 and drm7i-1 lines at the six-leaf stage were stained with Lugol’s solution to visualize starch, and then the starch content was measured physiologically. (C) TEM examination of chloroplast structures. Leaf mesophyll cells were collected from the 2nd leaves of AC, two SlDRM7-RNAi lines drm7i-1 and drm7i-2 at the six-leaf stage. The Upper and lower panels show a group of or individual chloroplasts. Bars are inserted as indicated. S, starch granule; OG, osmiophilic plastoglobuli; GL, Grana lamella; SL, stroma lamella. (D) Relative expression of genes related to starch degradation in WT, drm7i_ns-1, and drm7i-1. Data are represented as means ± SD of three biological duplicates. Asterisks (above error bar represent the difference with WT; above the short line represent the difference with drm7i_ns) indicate the significant differences (*P ≤ 0.05, **P ≤ 0.01, ***P ≤ 0.001, one-way ANOVA, Tukey’s HSD). (E) Heat map of the methylation levels of meth-DEGs involved in starch metabolism. (F) Detailed DNA methylation profile at the SlGWD (Solyc05g005020.2) loci. Differential DNA methylation is seen in the drm7i vs. drm7i_ns. A screenshot from the Integrative Genomics Viewer (IGV) display of whole-genome bisulfite sequencing data is shown. Vertical bars on each track indicate DNA methylation levels. Red boxes represent the DMRs.
FIGURE 8
FIGURE 8
A model for SlDRM7 epi-controls leaf chlorosis and senescence. SlDRM7-mediated DMRs affect gene expression, which is designed as meth-DEGs. Silencing of SlDRM7 influences DNA methylation in promoter and gene body, and leads to transcriptional inhibition of genes directly or indirectly as exemplified by SlLFNR1, SlPORB, SlPsaK, and SlGWD. We hypothesized that these changes including promoter hypermethylation of SlLFNR1, intron hypermethylation of SlPORB and SlPsaK, and intron hypomethylation of SlGWD resulted in their expression repression, which inhibited photosynthesis and starch degradation, eventually leading to leaf chlorosis and senescence. Conversely, leaf senescence can induce SlDRM7, forming a feedback regulatory loop, to balance vegetative growth and senescence.

Similar articles

Cited by

References

    1. Arnon D. I. (1949). Copper enzymes in isolated chloroplasts. Polyphenoloxidase in Beta vulgaris. Plant Physiol. 24 1–15. 10.1104/pp.24.1.1 - DOI - PMC - PubMed
    1. Ay N., Irmler K., Fischer A., Uhlemann R., Reuter G., Humbeck K. (2009). Epigenetic programming via histone methylation at WRKY53 controls leaf senescence in Arabidopsis thaliana. Plant J. 58 333–346. 10.1111/j.0960-7412.2009.03782.x - DOI - PubMed
    1. Ay N., Janack B., Humbeck K. (2014). Epigenetic control of plant senescence and linked processes. J. Exp. Bot. 65 3875–3887. 10.1093/jxb/eru132 - DOI - PubMed
    1. Balazadeh S., Siddiqui H., Allu A. D., Matallana-Ramirez L. P., Caldana C., Mehrnia M., et al. (2010). A gene regulatory network controlled by the NAC transcription factor ANAC092/AtNAC2/ORE1 during salt-promoted senescence. Plant J. 62 250–264. 10.1111/j.1365-313X.2010.04151.x - DOI - PubMed
    1. Cao X. F., Aufsatz W., Zilberman D., Mette M. F., Huang M. S., Matzke M., et al. (2003). Role of the DRM and CMT3 Methyltransferases in RNA-directed DNA methylation. Curr. Biol. 13 2212–2217. 10.1016/s0960-9822(03)00908-4 - DOI - PubMed

LinkOut - more resources