. 2021 Dec 15;15(3):452-472.
doi: 10.1093/ckj/sfab273. eCollection 2022 Mar.

The ERA Registry Annual Report 2019: summary and age comparisons

Affiliations

The ERA Registry Annual Report 2019: summary and age comparisons

Rianne Boenink et al. Clin Kidney J. .

Abstract

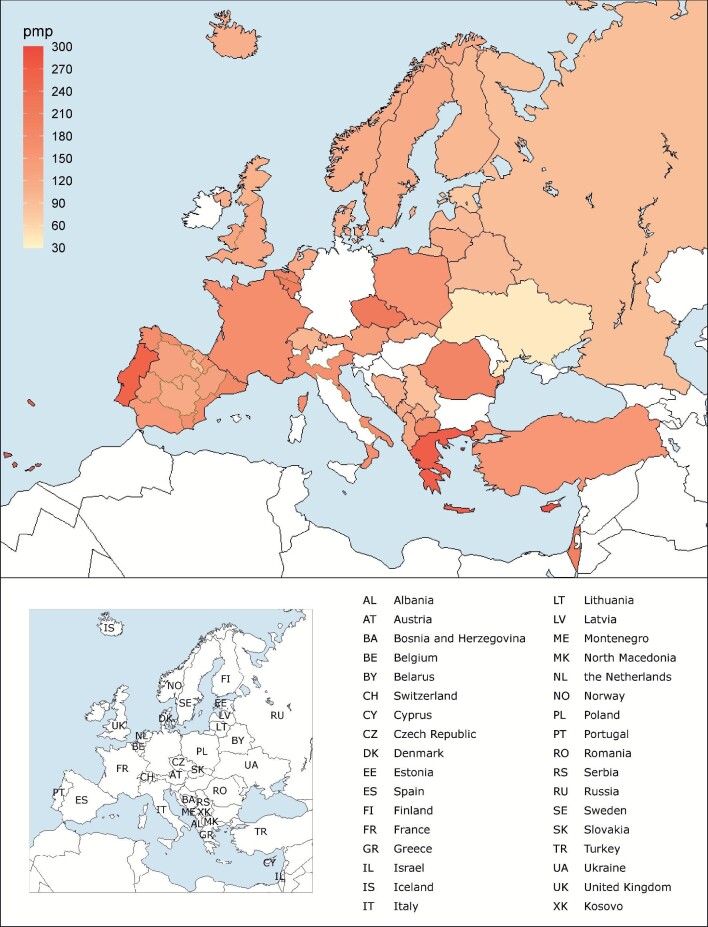
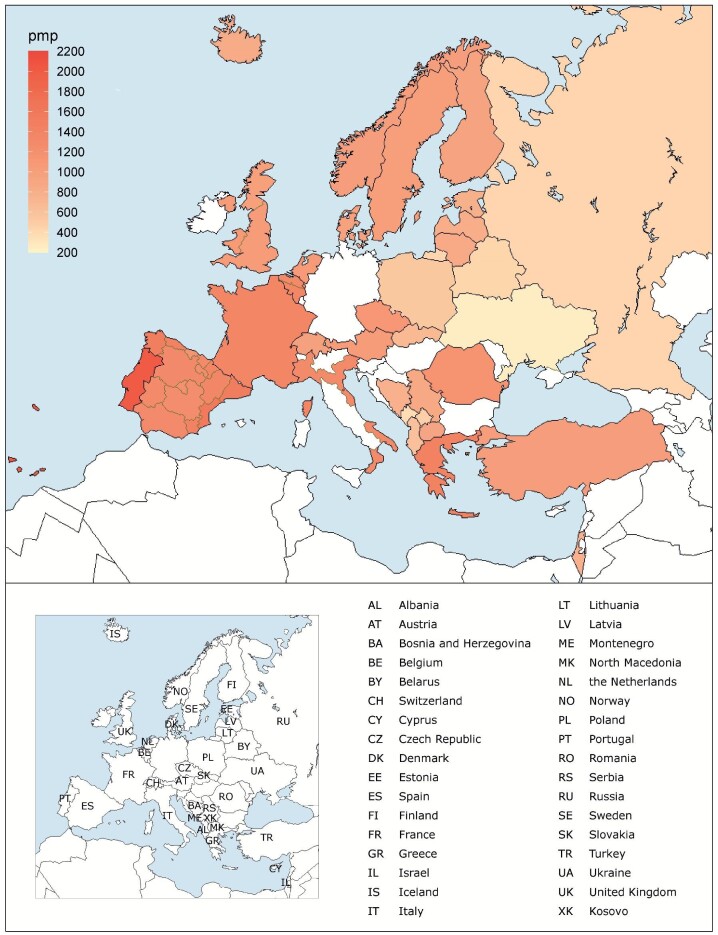
Background: Data on renal replacement therapy (RRT) for end-stage renal disease were collected by the European Renal Association (ERA) Registry via national and regional renal registries in Europe and countries bordering the Mediterranean Sea. This article provides a summary of the 2019 ERA Registry Annual Report, including data from 34 countries and additional age comparisons.

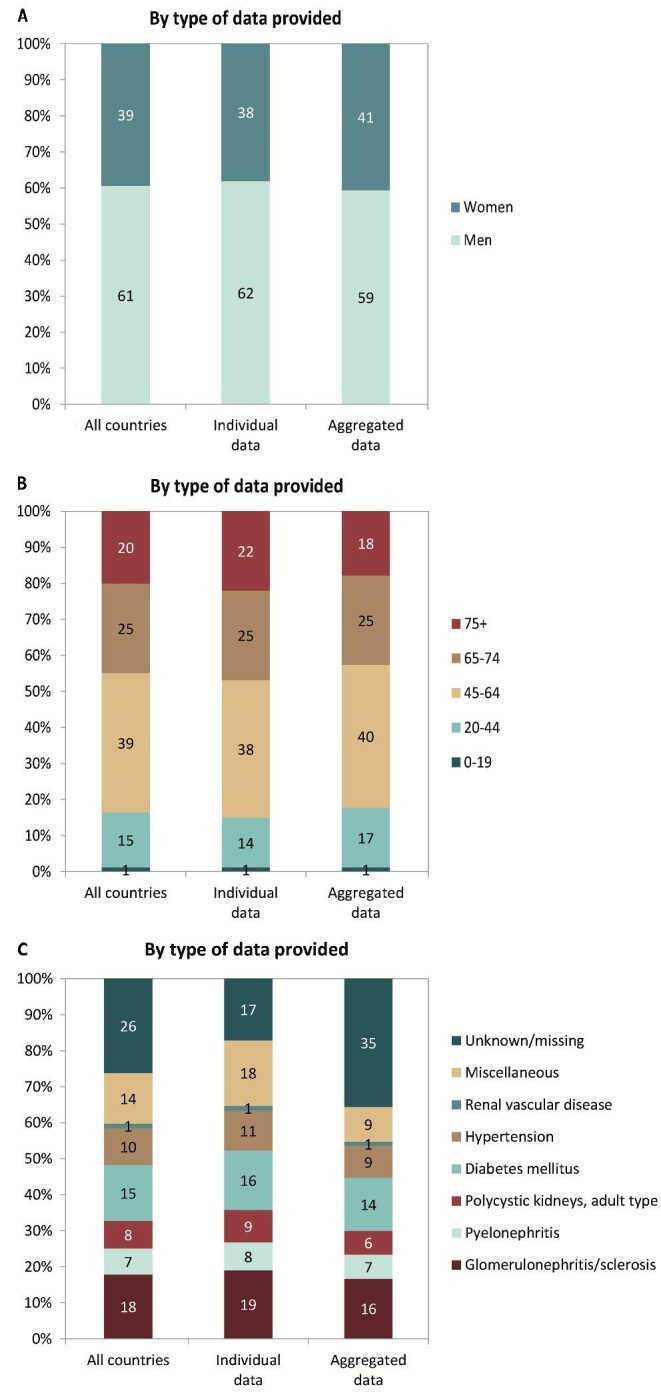
Methods: Individual patient data for 2019 were provided by 35 registries and aggregated data by 17 registries. Using these data, the incidence and prevalence of RRT, the kidney transplantation activity and the survival probabilities were calculated.

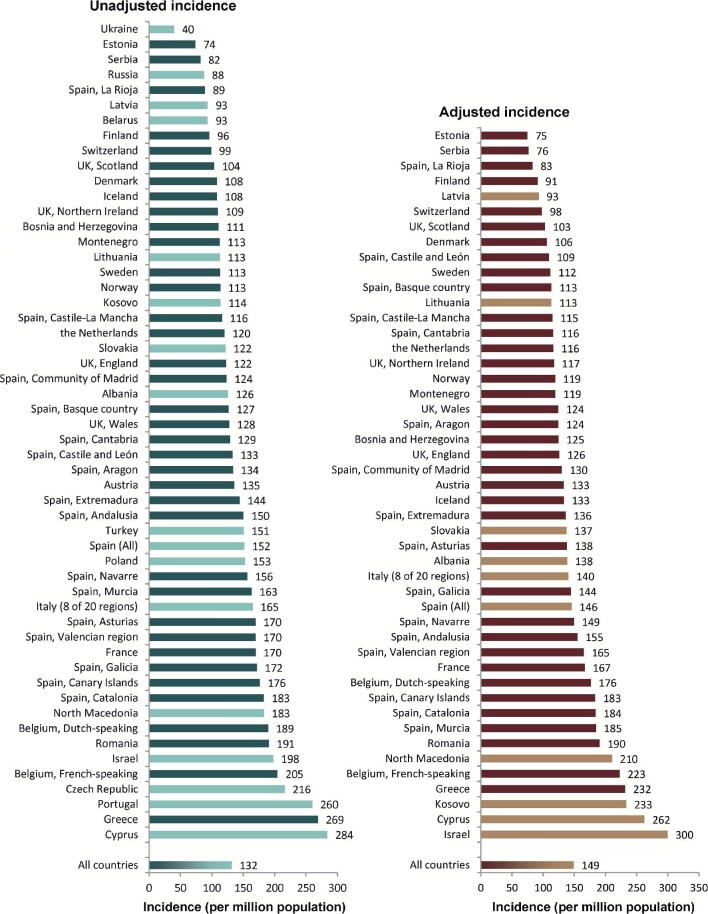
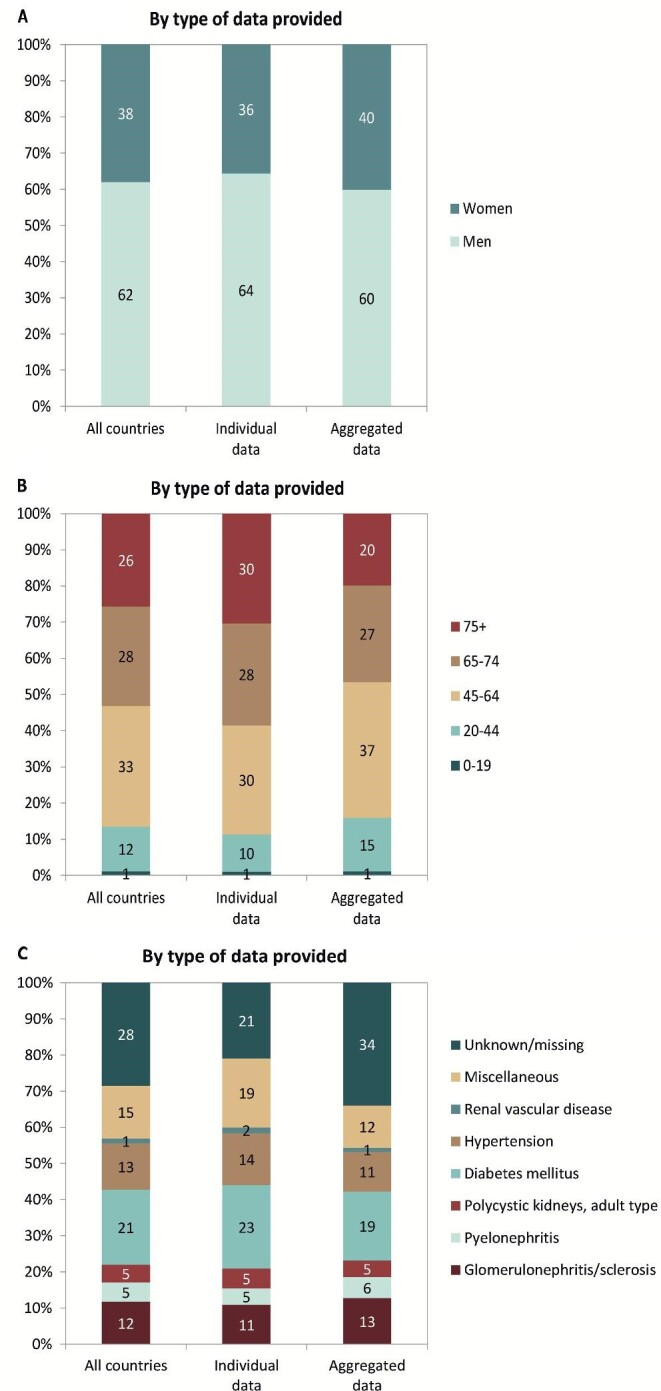
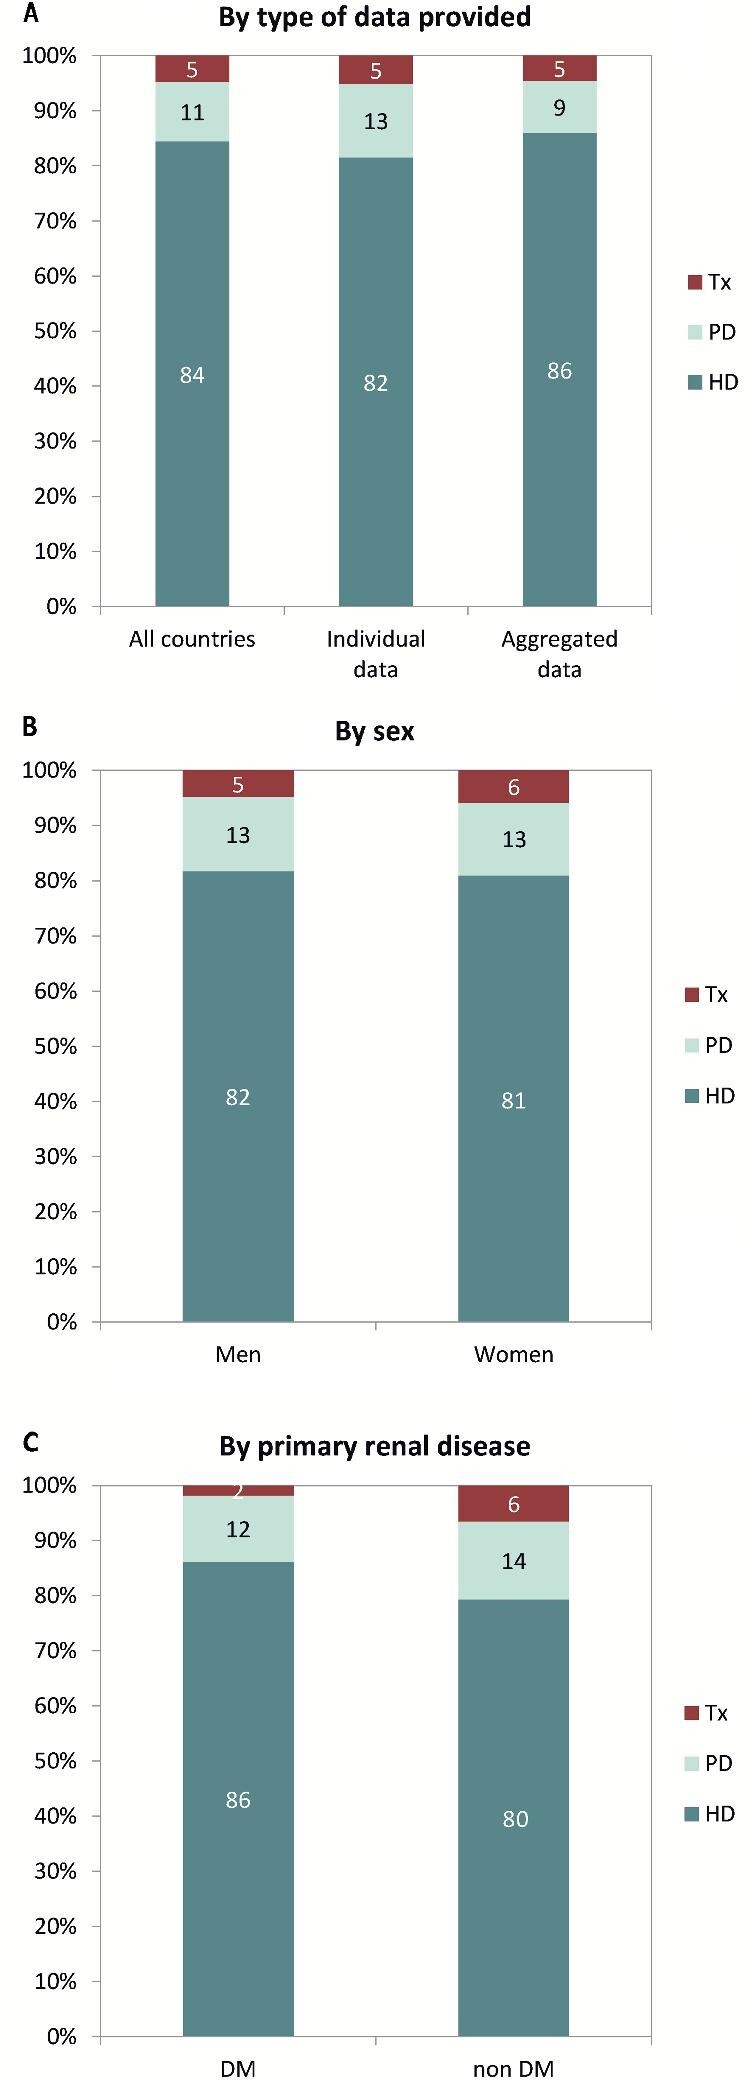
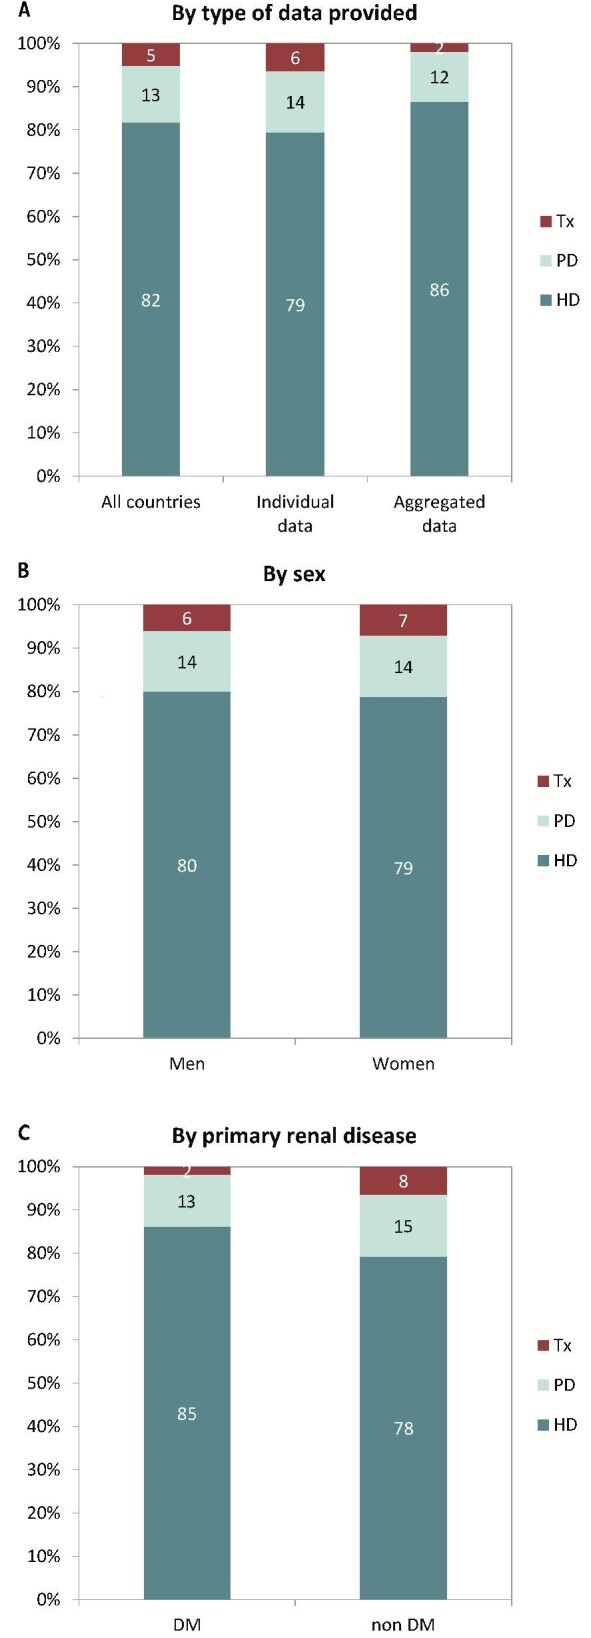
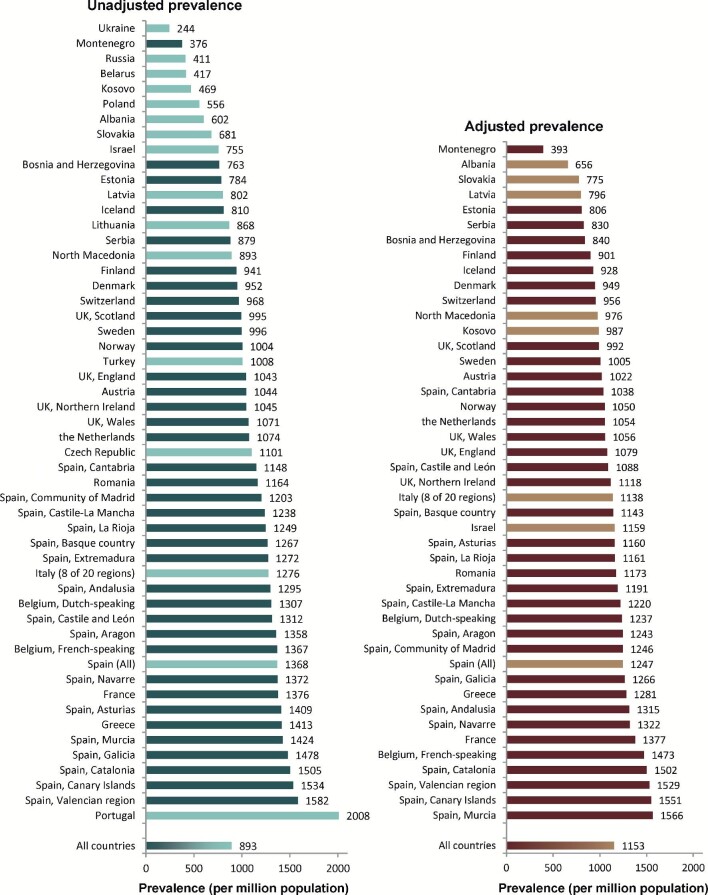
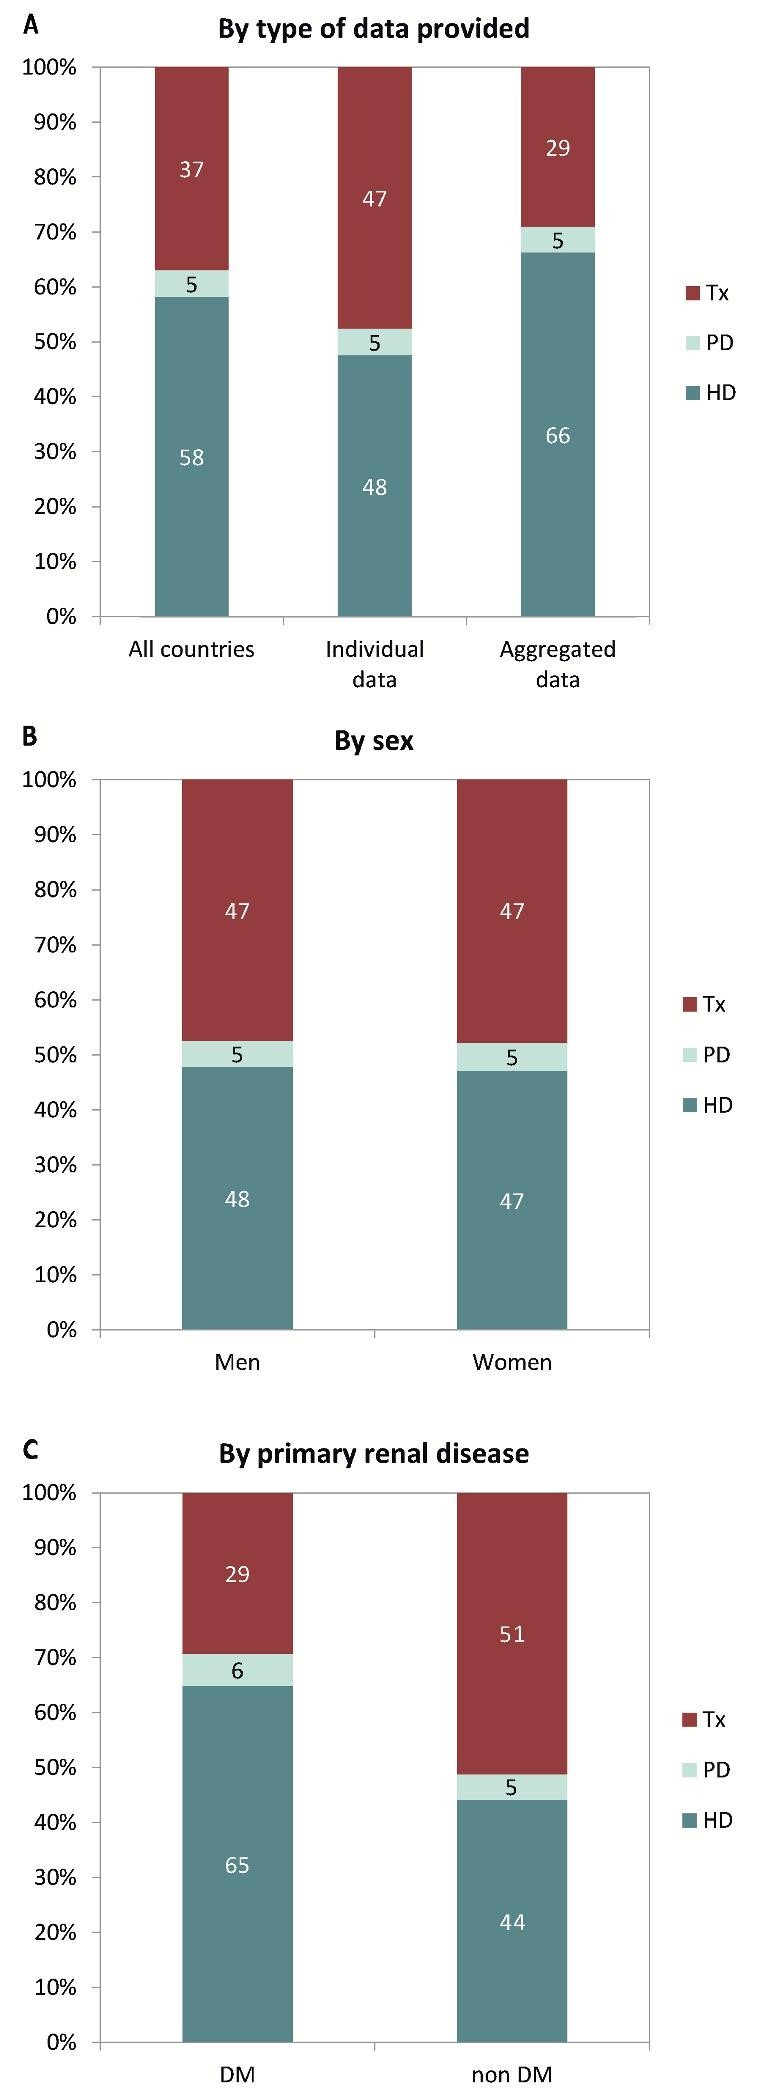
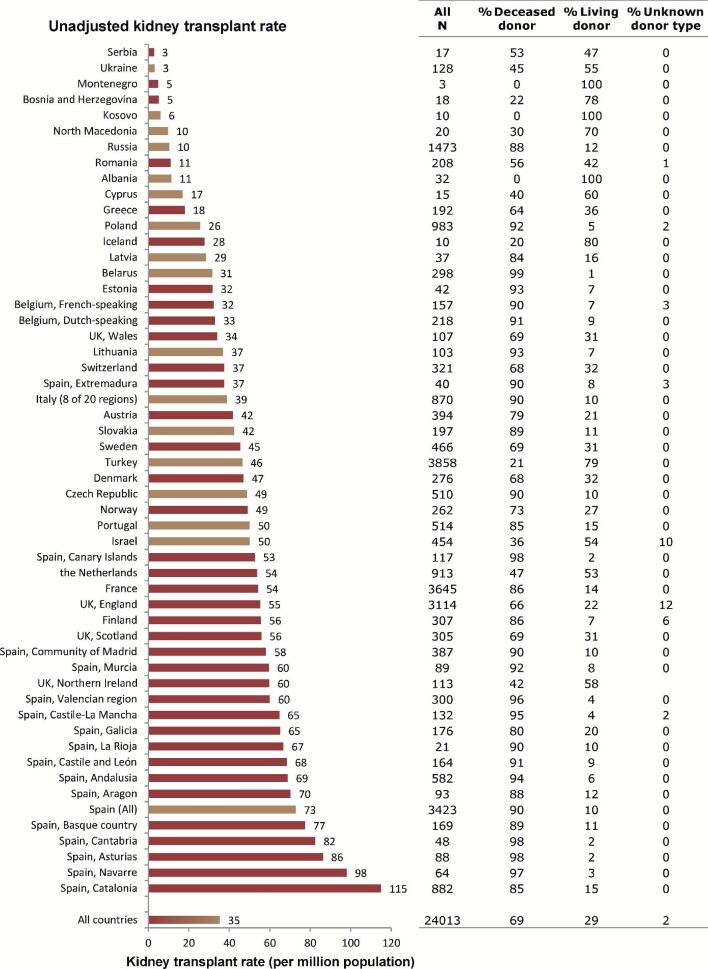
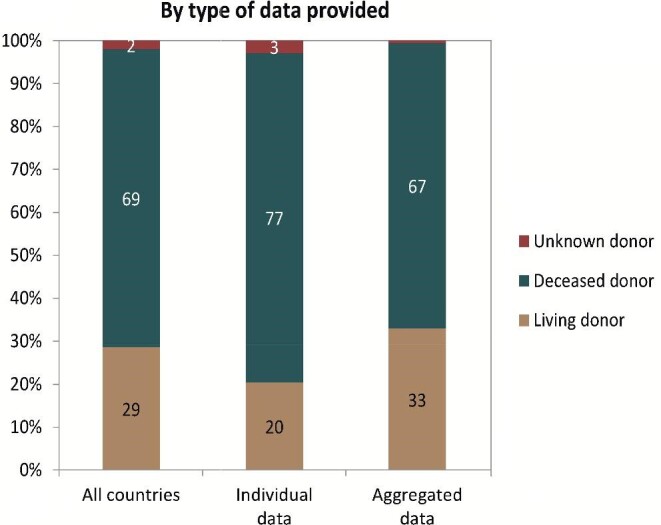
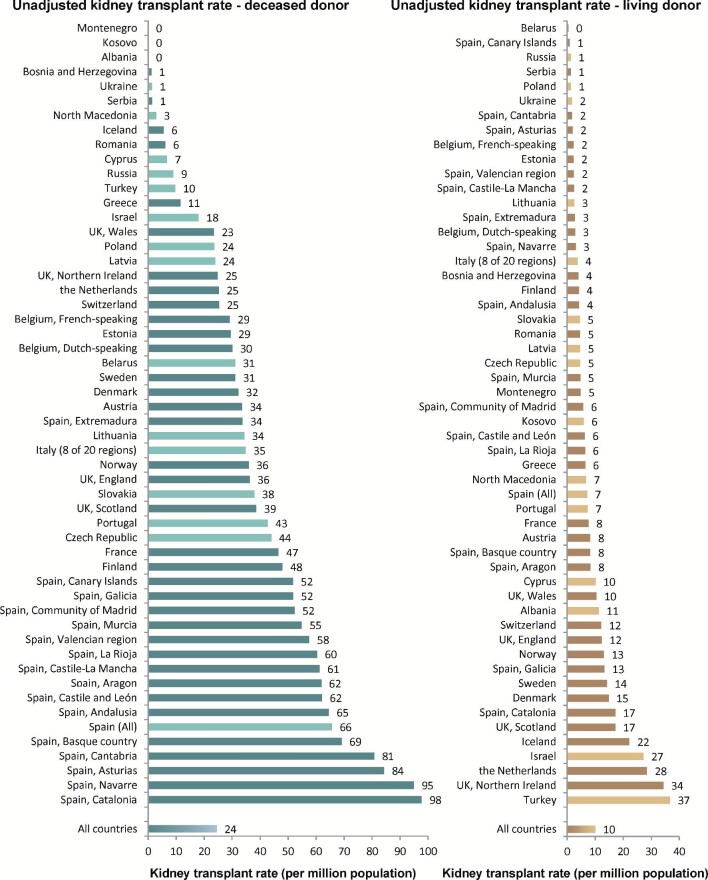
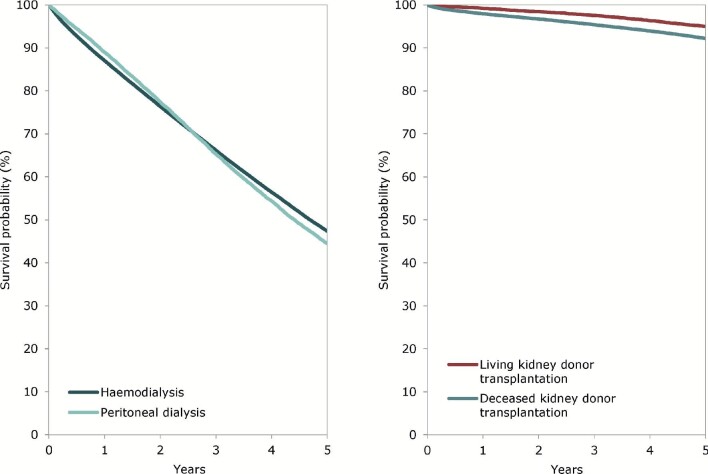
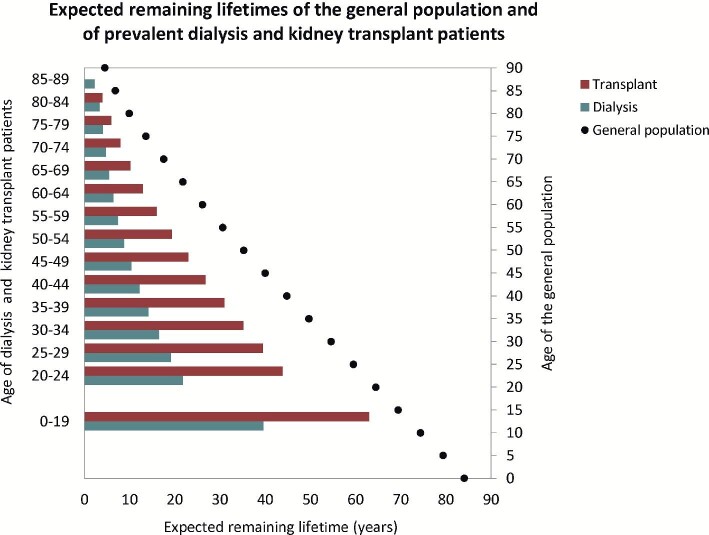
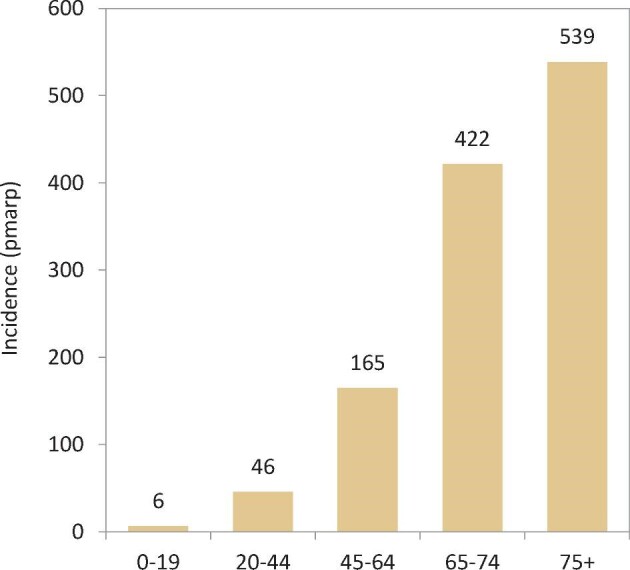
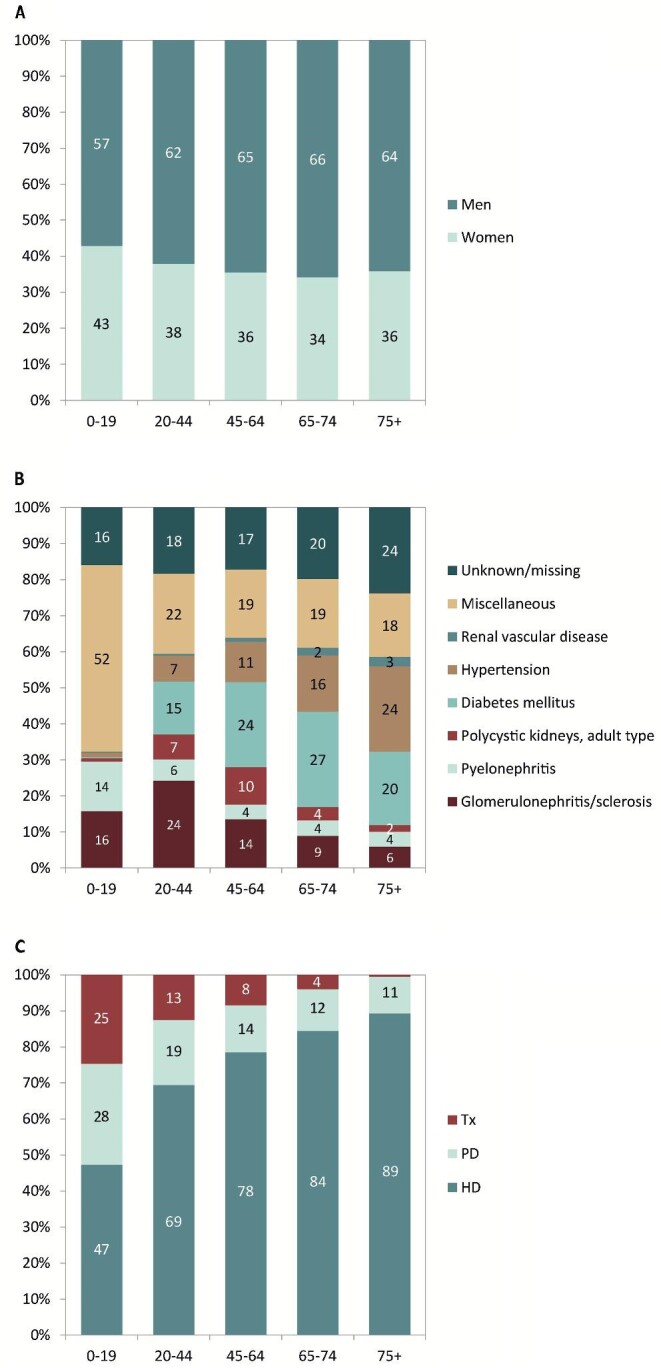
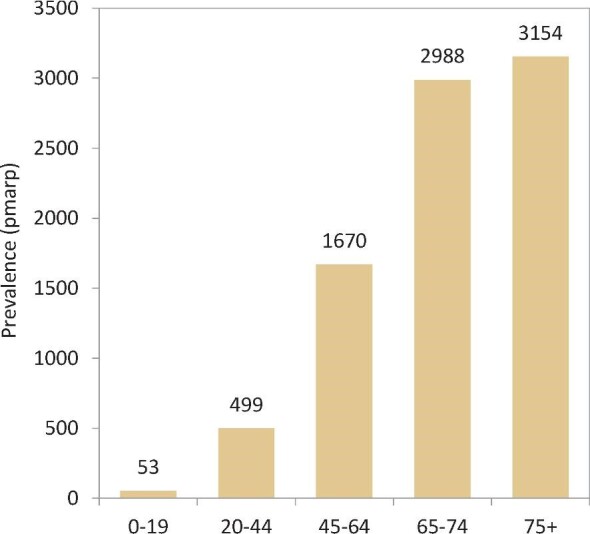
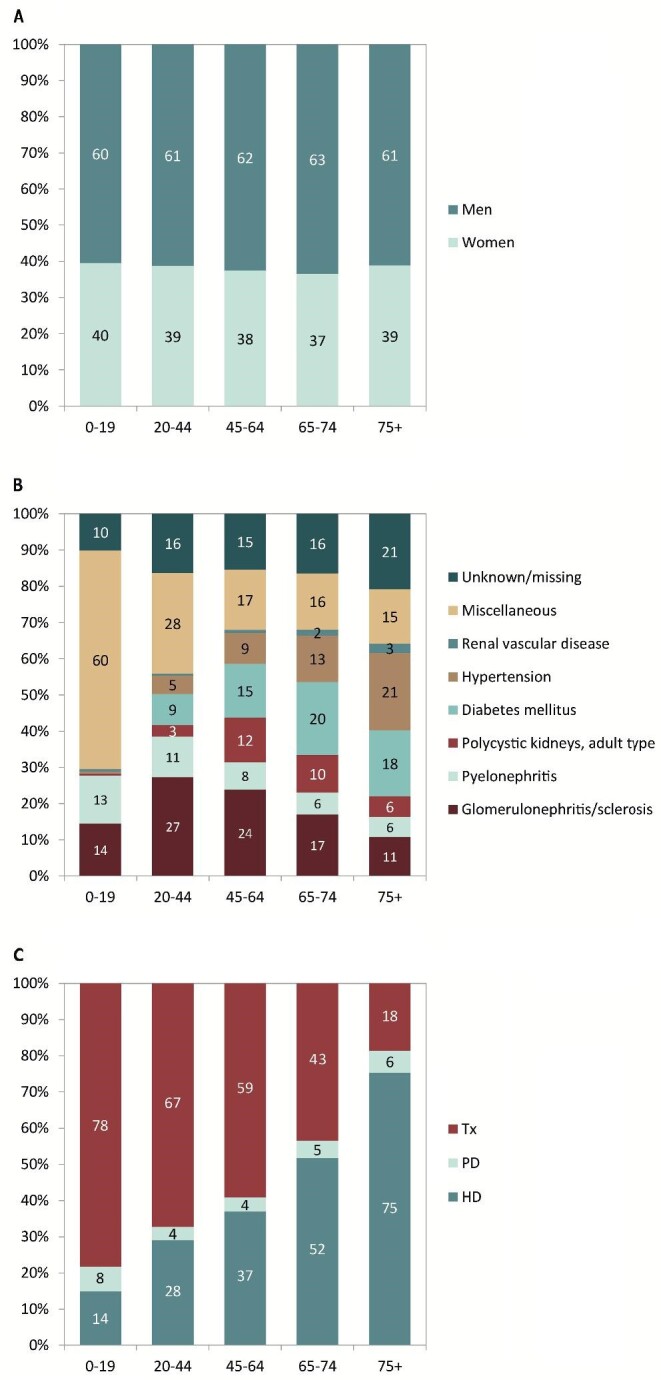
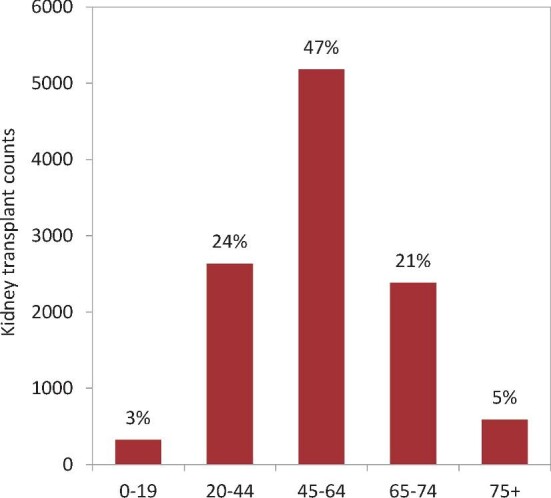
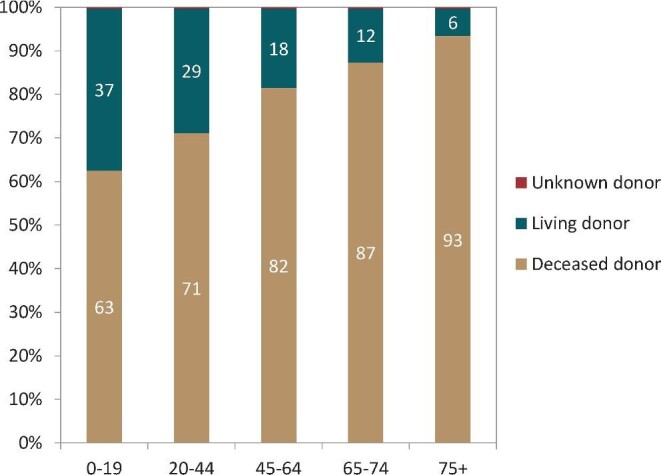
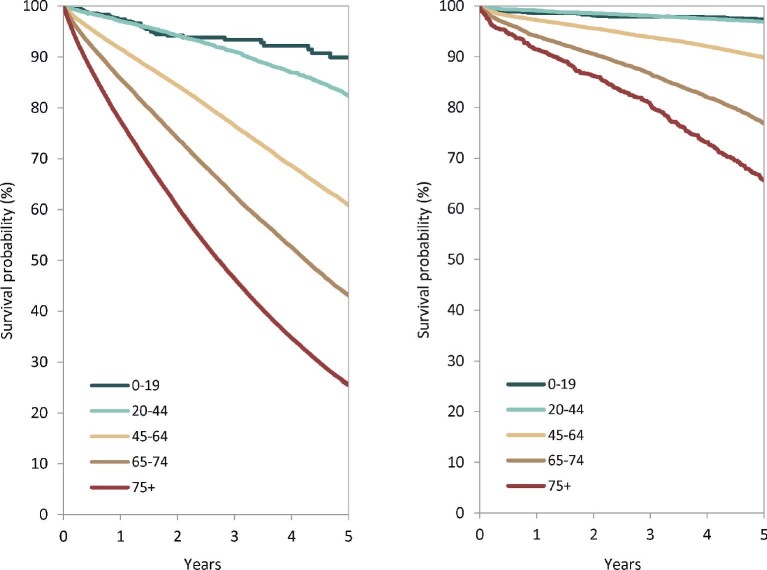
Results: In 2019, a general population of 680.8 million people was covered by the ERA Registry. Overall, the incidence of RRT was 132 per million population (p.m.p.). Of these patients, 62% were men, 54% were ≥65 years of age and 21% had diabetes mellitus as primary renal disease (PRD), and 84% had haemodialysis (HD), 11% had peritoneal dialysis (PD) and 5% had pre-emptive kidney transplantation as an initial treatment modality. The overall prevalence of RRT on 31 December 2019 was 893 p.m.p., with 58% of patients on HD, 5% on PD and 37% living with a kidney transplant. The overall kidney transplant rate was 35 p.m.p. and 29% of the kidney grafts were from a living donor. The unadjusted 5-year survival probability was 42.3% for patients commencing dialysis, 86.6% for recipients of deceased donor grafts and 94.4% for recipients of living donor grafts in the period 2010-14. When comparing age categories, there were substantial differences in the distribution of PRD, treatment modality and kidney donor type, and in the survival probabilities.

Keywords: ESRD; dialysis; epidemiology; graft survival; kidney transplantation; patient survival.


Conflict of interest statement

A.O. is the CKJ Editor-in-Chief.

Figures

FIGURE 1:
FIGURE 1:
Incidence of RRT (p.m.p.) in 2019, on Day 1, by country or region, unadjusted. The incidence for Czech Republic, Russia and Slovakia only includes patients receiving dialysis.
FIGURE 2:
FIGURE 2:
Unadjusted (left panel) and adjusted (right panel) incidence of RRT p.m.p. in 2019, on Day 1, by country or region. Registries providing individual patient data are shown as dark-coloured bars and registries providing aggregated data as light-coloured bars. Age- and sex-adjusted incidence was calculated by standardization to the age and sex distribution of the EU-28 population. The incidence for Czech Republic, Russia and Slovakia only includes patients receiving dialysis.
FIGURE 3:
FIGURE 3:
(A) Sex, (B) age and (C) primary renal disease distribution by type of data provided for incident patients accepted for RRT in 2019, on Day 1. See Appendix 1 for a list of countries and regions providing individual patient data or aggregated data.
FIGURE 4:
FIGURE 4:
Treatment modality distribution, on Day 1, by (A) type of data provided, (B) sex and (C) primary renal disease (DM and non-DM) for incident patients accepted for RRT in 2019. Panels (B) and (C) are only based on the data from registries providing individual patient data. See Appendix 1 for a list of countries and regions providing individual patient data or aggregated data. DM, diabetes mellitus; HD, haemodialysis; PD, peritoneal dialysis; Tx, kidney transplant.
FIGURE 5:
FIGURE 5:
Treatment modality distribution, on Day 91, by (A) type of data provided, (B) sex and (C) primary renal disease (DM and non-DM) for incident patients accepted for RRT in 2019. Parts (B) and (C) are only based on the data from registries providing individual patient data. See Appendix 1 for a list of countries and regions providing individual patient data or aggregated data. DM, diabetes mellitus; HD, haemodialysis; PD, peritoneal dialysis; Tx, kidney transplant.
FIGURE 6:
FIGURE 6:
Prevalence of RRT (p.m.p.) on 31 December 2019 by country or region. The prevalence for Israel, Poland and Slovakia only includes patients receiving dialysis.
FIGURE 7:
FIGURE 7:
Unadjusted (left panel) and adjusted (right panel) prevalence (p.m.p.) of RRT on 31 December 2019 by country or region. Registries providing individual patient data are shown as dark-coloured bars and registries providing aggregated data as light-coloured bars. Age- and sex-adjusted prevalence was calculated by standardization to the age and sex distribution of the EU-28 population. The prevalence for Israel, Poland and Slovakia only includes patients receiving dialysis.
FIGURE 8:
FIGURE 8:
(A) Sex, (B) age and (C) primary renal disease distribution, by type of data provided for prevalent patients on RRT on 31 December 2019. See Appendix 1 for a list of countries and regions providing individual patient data or aggregated data.
FIGURE 9:
FIGURE 9:
Treatment modality distribution by (A) type of data provided, (B) sex and (C) primary renal disease (DM and non-DM) for prevalent patients on RRT on 31 December 2019. Parts (B) and (C) are only based on the data from registries providing individual patient data. See Appendix 1 for a list of countries and regions providing individual patient data or aggregated data. DM, diabetes mellitus; HD, haemodialysis; PD, peritoneal dialysis; Tx, kidney transplant.
FIGURE 10:
FIGURE 10:
Kidney transplants performed in 2019, presented as counts and p.m.p., by country or region, unadjusted. Registries providing individual patient data are shown as red-coloured bars and registries providing aggregated data as orange-coloured bars. The total count for Austria is based on residents and non-residents. For Romania, Serbia and the Netherlands, the overall kidney transplant rate is underestimated by 30%, 15% and 2%, respectively.
FIGURE 11:
FIGURE 11:
Donor-type distribution for kidney transplants performed in 2019, by type of data provided. See Appendix 1 for a list of countries and regions providing individual patient data or aggregated data.
FIGURE 12:
FIGURE 12:
Deceased donor (left panel) and living donor (right panel) kidney transplants performed in 2019 p.m.p., by country or region, unadjusted. Registries providing individual patient data are shown as dark-coloured bars and registries providing aggregated data as light-coloured bars. The total count for Austria is based on residents and non-residents. For Romania and the Netherlands, the kidney transplant rate is underestimated by 30% and 2%, respectively. For Serbia, the transplant rate is underestimated by 16% for deceased donor transplants and by 12% for living donor transplants.
FIGURE 13:
FIGURE 13:
Survival of patients starting HD and PD between 2010 and 2014 from Day 91 (left panel) and patients receiving a first kidney transplant from a living or deceased donor between 2010 and 2014 (right panel). Survival on dialysis was censored for kidney transplantation and adjusted using fixed values for age (67 years), sex (63% men) and primary renal disease (24% diabetes mellitus, 19% hypertension/renal vascular disease, 11% glomerulonephritis and 46% other causes). Survival after kidney transplantation was adjusted using fixed values for age (50 years), sex (63% men) and primary renal disease (14% diabetes mellitus, 10% hypertension/renal vascular disease, 23% glomerulonephritis and 53% other causes). These figures are based on the data from the following registries providing individual patient data: Austria, Belgium (Dutch-speaking), Belgium (French-speaking), Bosnia and Herzegovina, Denmark, Finland, France, Greece, Iceland, Norway, Spain (Andalusia), Spain (Aragon), Spain (Asturias), Spain (Basque country), Spain (Cantabria), Spain (Castile and León), Spain (Castile-La Mancha), Spain (Catalonia), Spain (Community of Madrid), Spain (Extremadura), Spain (Galicia), Spain (Murcia), Spain (Valencian Region), Sweden, the Netherlands, the UK (England/Northern Ireland/Wales) and the UK (Scotland).
FIGURE 14:
FIGURE 14:
Expected remaining lifetime of prevalent dialysis and kidney transplant patients (cohort 2015–19) and the general population (cohort 2015–19), by age. This figure is based on data from the following registries providing individual patient data: Austria, Belgium (Dutch-speaking), Belgium (French-speaking), Bosnia and Herzegovina, Denmark, Finland, France, Greece, Iceland, Norway, Spain (Andalusia), Spain (Aragon), Spain (Asturias), Spain (Basque country), Spain (Cantabria), Spain (Castille and León), Spain (Castille-La Mancha), Spain (Catalonia), Spain (Community of Madrid), Spain (Extremadura), Spain (Galicia), Spain (Murcia), Spain (Valencian Region), Sweden, the Netherlands, the UK (England/Northern Ireland/Wales) and the UK (Scotland).
FIGURE 15:
FIGURE 15:
Incidence of RRT per million age-related population (p.m.a.r.p.) in 2019, on Day 1, by age, unadjusted. Results are based on data from registries providing individual patient data.
FIGURE 16:
FIGURE 16:
(A) Sex, (B) primary renal disease and (C) treatment modality distribution by age in incident patients accepted for RRT in 2019, on Day 1, unadjusted. Results are based on data from registries providing individual patient data. HD, haemodialysis; PD, peritoneal dialysis; Tx, kidney transplant.
FIGURE 17:
FIGURE 17:
Prevalence of RRT per million age-related population (p.m.a.r.p.) on 31 December 2019, by age, unadjusted. Results are based on data from registries providing individual patient data.
FIGURE 18:
FIGURE 18:
(A) Sex, (B) primary renal disease and (C) treatment modality distribution by age in prevalent patients on 31 December 2019, unadjusted. Results are based on data from registries providing individual patient data. HD, haemodialysis; PD, peritoneal dialysis; Tx, kidney transplant.
FIGURE 19:
FIGURE 19:
Kidney transplant counts and percentages by recipient age in 2019, unadjusted. Results are based on data from registries providing individual patient data. The percentages in this figure sum up to 100% for all age groups together.
FIGURE 20:
FIGURE 20:
Donor type distribution by age in kidney transplant recipients, unadjusted. Results are based on data from registries providing individual patient data.
FIGURE 21:
FIGURE 21:
Patient survival probability by age for incident dialysis patients from Day 91 (left panel) and for patients receiving a first kidney transplant from the day of transplantation (right panel), adjusted for sex and primary renal disease. Results are based on data from registries providing individual patient data.

References

    1. Kramer A, Boenink R, Stel VSet al. . The ERA-EDTA Registry Annual Report 2018: a summary. Clin Kidney J 2021; 14: 107–123 - PMC - PubMed
    1. Eurostat . Demography, Population Stock and Balance-Population National Level. https://ec.europa.eu/eurostat/web/main/data/database (August 2021, date last accessed)