ANXA2P2: A Potential Immunological and Prognostic Signature in Ovarian Serous Cystadenocarcinoma via Pan-Carcinoma Synthesis
- PMID: 35211410
- PMCID: PMC8860902
- DOI: 10.3389/fonc.2022.818977
ANXA2P2: A Potential Immunological and Prognostic Signature in Ovarian Serous Cystadenocarcinoma via Pan-Carcinoma Synthesis
Abstract
Background: Although the effect of pseudogene ANXA2P2 on some tumors has been reported in a few literatures, the therapeutic potential and prognostic value of ANXA2P2 in ovarian serous cystadenocarcinoma (OV) have not been elucidated.
Methods: The correlation for ANXA2P2 expression patterns to prognostic characteristics, tumor immune microenvironment, immune cell infiltration level, tumor mutation burden (TMB), tumor microsatellite instability (MSI), drug sensitivity, and pathway function enrichment were investigated in pan-carcinoma via TCGA and GTEx databases. Subsequently, the role of ANXA2P2 expression levels in the pathway enrichments and prognosis prediction in OV were further explored using weighted correlation network analysis (WGCNA) analysis, gene mutation analysis, and risk-independent prognostic analysis.
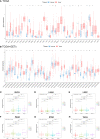
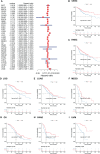
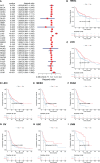
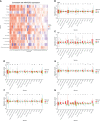
Results: ANXA2P2 was frequently overexpressed in a variety of tumors compared with normal tissues. The correlation analysis for prognostic characteristics, tumor immune microenvironment, immune cell infiltration level, TMB, MSI, drug sensitivity, and pathway function enrichment revealed that ANXA2P2 expression patterns might deal a significant impact on the pathogenesis, development, and prognosis of various tumors. Then, GSVA, GSEA, WGCNA, gene mutation, and independent prognostic analysis for OV have indicated that high expression in ANXA2P2 could be mostly enriched in TNF-α signaling-via-NF-κB, epithelial-mesenchymal transition, apical junction, IL-6-JAK STAT3 signaling, etc., which were also proved to act as crucial factors on tumorigenesis, development, invasion, and metastasis. The mutation of TP53 (94%), TTN (24%), and CSMD3 (9%) in the biological process of tumor had been confirmed by relevant studies. Finally, the independent prognostic analysis demonstrated that ANXA2P2 expression in OV contributes greatly to the dependability of 3- and 5-year survival prediction.
Conclusion: In summary, our findings might provide a helpful foundation for prospective explorative researches, afford new strategies for the clinical treatment, deal prognosis prediction, and give new hope for OV patients.
Keywords: ANXA2P2; immune characteristics; ovarian serous cystadenocarcinoma; prognostic signature; pseudogene.
Copyright © 2022 Zhang, Du and Chen.
Conflict of interest statement
The authors declare that the research was conducted in the absence of any commercial or financial relationships that could be construed as a potential conflict of interest.
Figures



Similar articles
-
Prognostic Implication and Oncogenic Role of PNPO in Pan-Cancer.Front Cell Dev Biol. 2022 Jan 21;9:763674. doi: 10.3389/fcell.2021.763674. eCollection 2021. Front Cell Dev Biol. 2022. PMID: 35127701 Free PMC article.
-
KRT19 is a Promising Prognostic Biomarker and Associates with Immune Infiltrates in Serous Ovarian Cystadenocarcinoma.Int J Gen Med. 2023 Oct 26;16:4849-4862. doi: 10.2147/IJGM.S419235. eCollection 2023. Int J Gen Med. 2023. PMID: 37916194 Free PMC article.
-
Comprehensive bioinformatics analysis of co-mutation of FLG2 and TP53 reveals prognostic effect and influences on the immune infiltration in ovarian serous cystadenocarcinoma.Transl Cancer Res. 2025 Feb 28;14(2):1282-1296. doi: 10.21037/tcr-24-1596. Epub 2025 Feb 17. Transl Cancer Res. 2025. PMID: 40104745 Free PMC article.
-
Analyzing and validating the prognostic value and mechanism of colon cancer immune microenvironment.J Transl Med. 2020 Aug 28;18(1):324. doi: 10.1186/s12967-020-02491-w. J Transl Med. 2020. PMID: 32859214 Free PMC article.
-
Systemic characterization of alternative splicing related to prognosis, immune infiltration, and drug sensitivity analysis in ovarian cancer.Ann Transl Med. 2022 Jan;10(2):126. doi: 10.21037/atm-21-6422. Ann Transl Med. 2022. PMID: 35282039 Free PMC article.
Cited by
-
High expression of the ANXA3 gene promotes immune infiltration and improves tumor prognosis in ovarian serous carcinoma using bioinformatics analyses.Ann Transl Med. 2022 Oct;10(19):1055. doi: 10.21037/atm-22-3726. Ann Transl Med. 2022. PMID: 36330402 Free PMC article.
-
Pseudogene pair-based prognostic model reveals LAT as a biomarker of immune response in head and neck squamous cell carcinoma.Discov Oncol. 2025 Aug 11;16(1):1528. doi: 10.1007/s12672-025-03316-2. Discov Oncol. 2025. PMID: 40788434 Free PMC article.
-
Multi-Omics Analysis of Gut Microbiota and Host Transcriptomics Reveal Dysregulated Immune Response and Metabolism in Young Adults with Irritable Bowel Syndrome.Int J Mol Sci. 2024 Mar 20;25(6):3514. doi: 10.3390/ijms25063514. Int J Mol Sci. 2024. PMID: 38542485 Free PMC article.
References
-
- Moss HA, Berchuck A, Neely ML, Myers ER, Havrilesky LJ. Estimating Cost-Effectiveness of a Multimodal Ovarian Cancer Screening Program in the United States: Secondary Analysis of the UK Collaborative Trial of Ovarian Cancer Screening (UKCTOCS). JAMA Oncol (2018) 4:190–5. doi: 10.1001/jamaoncol.2017.4211 - DOI - PMC - PubMed
LinkOut - more resources
Full Text Sources
Research Materials
Miscellaneous

