

Vasculogenic Potency of Bone Marrow- and Adipose Tissue-Derived Mesenchymal Stem/Stromal Cells Results in Differing Vascular Network Phenotypes in a Microfluidic Chip
- PMID: 35211462
- PMCID: PMC8861308
- DOI: 10.3389/fbioe.2022.764237
Vasculogenic Potency of Bone Marrow- and Adipose Tissue-Derived Mesenchymal Stem/Stromal Cells Results in Differing Vascular Network Phenotypes in a Microfluidic Chip
Abstract
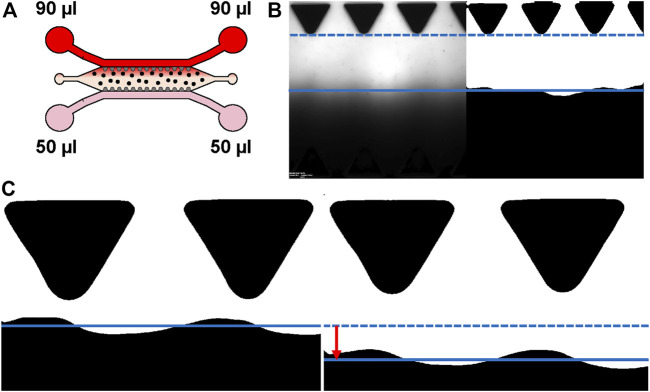
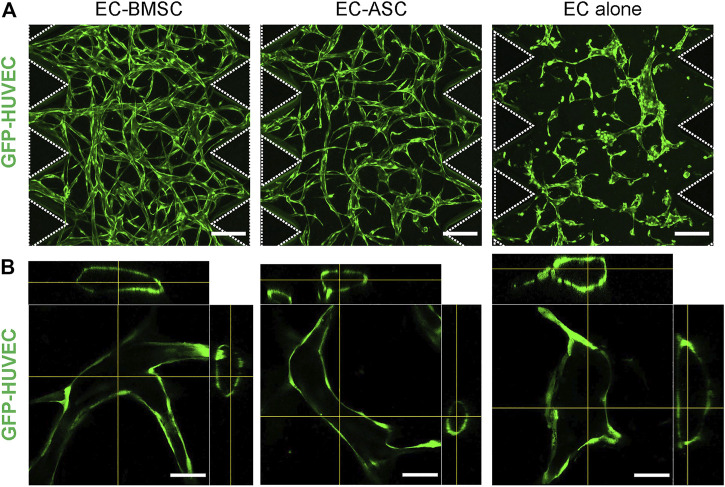
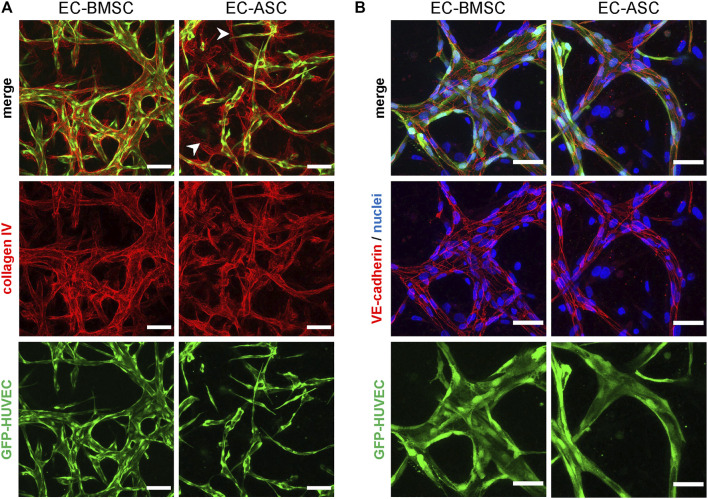
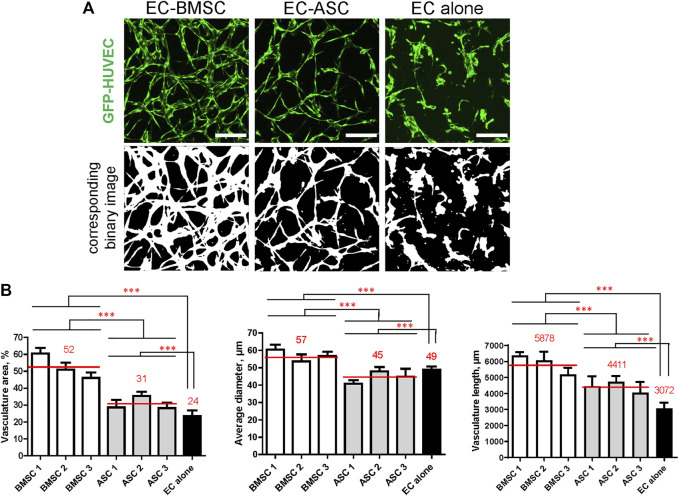
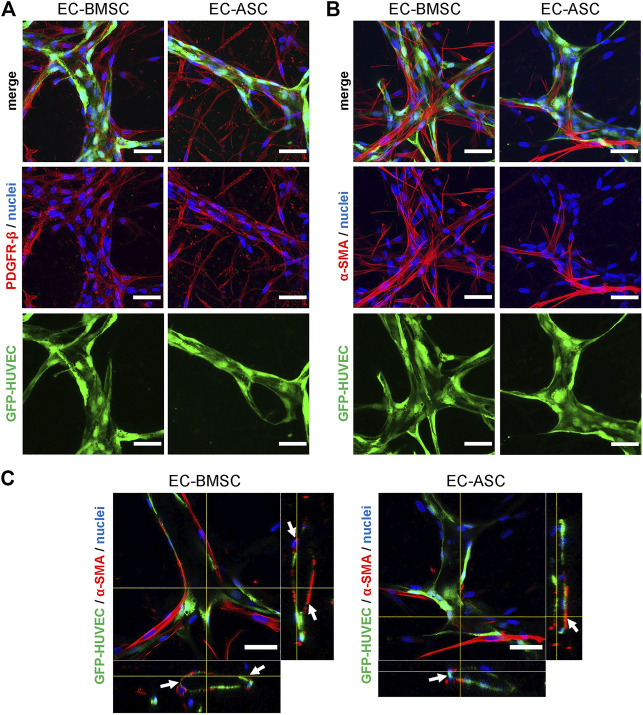
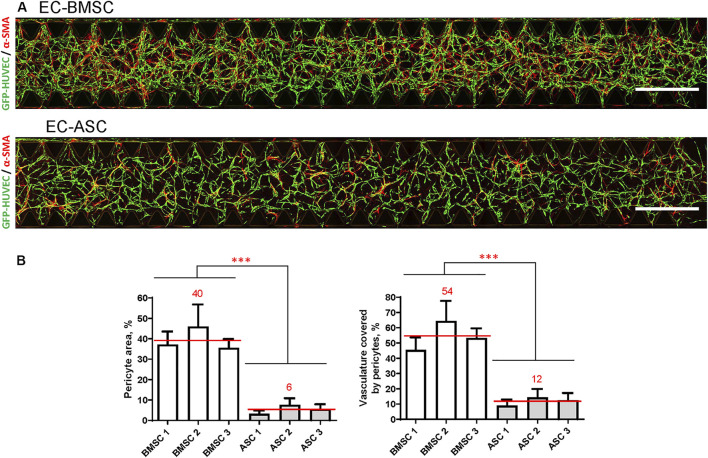
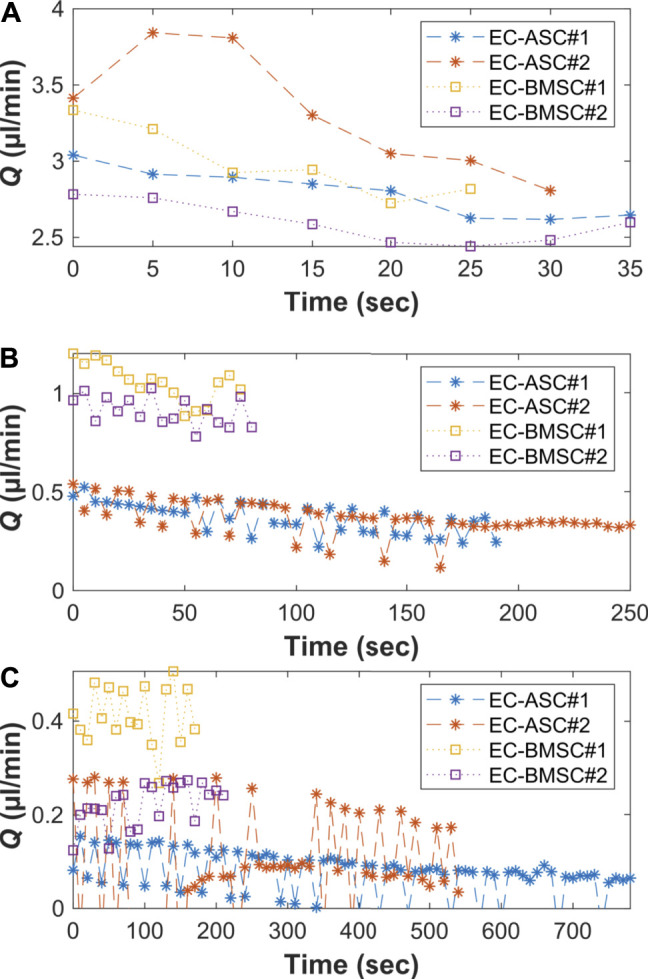
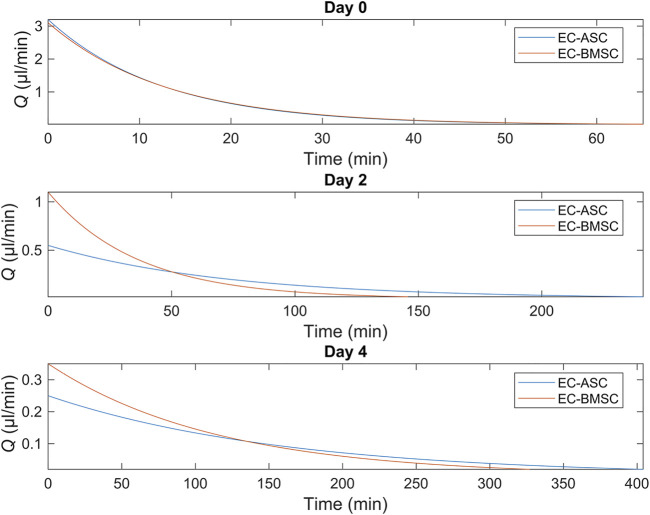
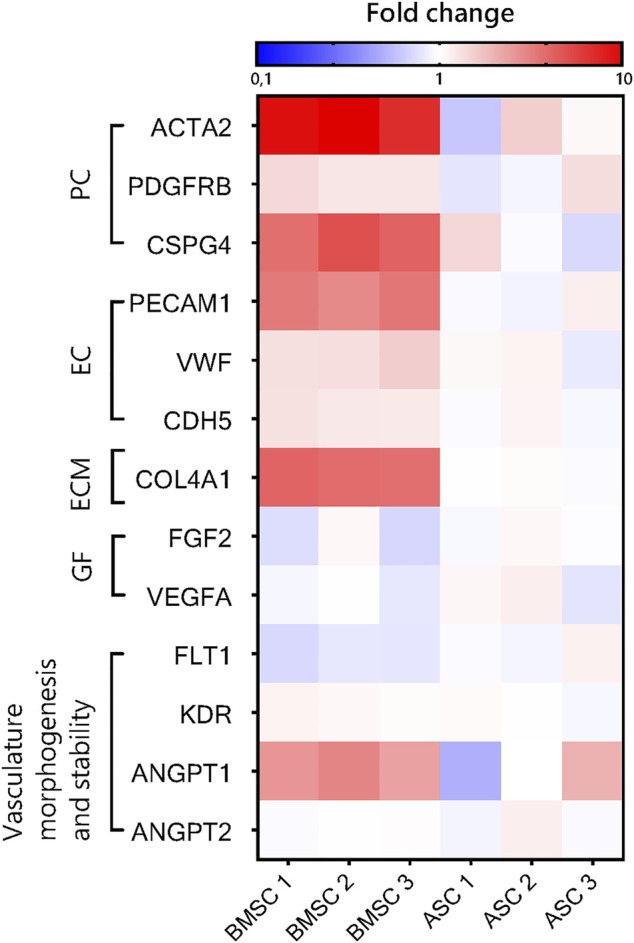
The vasculature is an essential, physiological element in virtually all human tissues. Formation of perfusable vasculature is therefore crucial for reliable tissue modeling. Three-dimensional vascular networks can be formed through the co-culture of endothelial cells (ECs) with stromal cells embedded in hydrogel. Mesenchymal stem/stromal cells (MSCs) derived from bone marrow (BMSCs) and adipose tissue (ASCs) are an attractive choice as stromal cells due to their natural perivascular localization and ability to support formation of mature and stable microvessels in vitro. So far, BMSCs and ASCs have been compared as vasculature-supporting cells in static cultures. In this study, BMSCs and ASCs were co-cultured with endothelial cells in a fibrin hydrogel in a perfusable microfluidic chip. We demonstrated that using MSCs of different origin resulted in vascular networks with distinct phenotypes. Both types of MSCs supported formation of mature and interconnected microvascular networks-on-a-chip. However, BMSCs induced formation of fully perfusable microvasculature with larger vessel area and length whereas ASCs resulted in partially perfusable microvascular networks. Immunostainings revealed that BMSCs outperformed ASCs in pericytic characteristics. Moreover, co-culture with BMSCs resulted in significantly higher expression levels of endothelial and pericyte-specific genes, as well as genes involved in vasculature maturation. Overall, our study provides valuable knowledge on the properties of MSCs as vasculature-supporting cells and highlights the importance of choosing the application-specific stromal cell source for vascularized organotypic models.
Keywords: endothelial cells; in vitro vascularization; mesenchymal stem cells; microfluidic chip; organ-on-a-chip; pericytes.
Copyright © 2022 Mykuliak, Yrjänäinen, Mäki, Gebraad, Lampela, Kääriäinen, Pakarinen, Kallio, Miettinen and Vuorenpää.
Conflict of interest statement
The authors declare that the research was conducted in the absence of any commercial or financial relationships that could be construed as a potential conflict of interest.
Figures
Similar articles
-
Coculture of Endothelial and Stromal Cells to Promote Concurrent Osteogenesis and Vasculogenesis.Tissue Eng Part A. 2021 Nov;27(21-22):1376-1386. doi: 10.1089/ten.TEA.2020.0330. Epub 2021 Mar 30. Tissue Eng Part A. 2021. PMID: 33599160 Free PMC article.
-
Simultaneous induction of vasculature and neuronal network formation on a chip reveals a dynamic interrelationship between cell types.Cell Commun Signal. 2023 Jun 14;21(1):132. doi: 10.1186/s12964-023-01159-4. Cell Commun Signal. 2023. PMID: 37316873 Free PMC article.
-
Vascularization mediated by mesenchymal stem cells from bone marrow and adipose tissue: a comparison.Cell Regen. 2015 Oct 23;4:8. doi: 10.1186/s13619-015-0025-8. eCollection 2015. Cell Regen. 2015. PMID: 26500761 Free PMC article.
-
Angiogenic Effects and Crosstalk of Adipose-Derived Mesenchymal Stem/Stromal Cells and Their Extracellular Vesicles with Endothelial Cells.Int J Mol Sci. 2021 Oct 8;22(19):10890. doi: 10.3390/ijms221910890. Int J Mol Sci. 2021. PMID: 34639228 Free PMC article. Review.
-
Osteogenic potential: Comparison between bone marrow and adipose-derived mesenchymal stem cells.World J Stem Cells. 2014 Jul 26;6(3):288-95. doi: 10.4252/wjsc.v6.i3.288. World J Stem Cells. 2014. PMID: 25126378 Free PMC article. Review.
Cited by
-
Building blocks of microphysiological system to model physiology and pathophysiology of human heart.Front Physiol. 2023 Jul 6;14:1213959. doi: 10.3389/fphys.2023.1213959. eCollection 2023. Front Physiol. 2023. PMID: 37485060 Free PMC article. Review.
-
Growth Response and Differentiation of Bone Marrow-Derived Mesenchymal Stem/Stromal Cells in the Presence of Novel Multiple Myeloma Drug Melflufen.Cells. 2022 May 7;11(9):1574. doi: 10.3390/cells11091574. Cells. 2022. PMID: 35563880 Free PMC article.
-
Bone marrow vasculature advanced in vitro models for cancer and cardiovascular research.Front Cardiovasc Med. 2023 Oct 17;10:1261849. doi: 10.3389/fcvm.2023.1261849. eCollection 2023. Front Cardiovasc Med. 2023. PMID: 37915743 Free PMC article. Review.
-
Barrier-free, open-top microfluidic chip for generating two distinct, interconnected 3D microvascular networks.Sci Rep. 2024 Oct 2;14(1):22916. doi: 10.1038/s41598-024-74493-3. Sci Rep. 2024. PMID: 39358415 Free PMC article.
-
Ascorbic Acid 2-Phosphate-Releasing Supercritical Carbon Dioxide-Foamed Poly(L-Lactide-Co-epsilon-Caprolactone) Scaffolds Support Urothelial Cell Growth and Enhance Human Adipose-Derived Stromal Cell Proliferation and Collagen Production.J Tissue Eng Regen Med. 2023 Mar 4;2023:6404468. doi: 10.1155/2023/6404468. eCollection 2023. J Tissue Eng Regen Med. 2023. PMID: 40226413 Free PMC article.
References
-
- Bachmann B., Spitz S., Rothbauer M., Jordan C., Purtscher M., Zirath H., et al. (2018). Engineering of Three-Dimensional Pre-vascular Networks within Fibrin Hydrogel Constructs by Microfluidic Control over Reciprocal Cell Signaling. Biomicrofluidics 12 (4), 042216. 10.1063/1.5027054 - DOI - PMC - PubMed
-
- Benjamini Y., Krieger A. M., Yekutieli D. (2006). Adaptive Linear Step-Up Procedures that Control the False Discovery Rate. Biometrika 93 (3), 491–507. 10.1093/biomet/93.3.491 - DOI
LinkOut - more resources
Full Text Sources