. 2022 Feb 8:8:824179.
doi: 10.3389/fvets.2021.824179. eCollection 2021.

Infectious Bronchitis Virus Infection Increases Pathogenicity of H9N2 Avian Influenza Virus by Inducing Severe Inflammatory Response

Affiliations

Infectious Bronchitis Virus Infection Increases Pathogenicity of H9N2 Avian Influenza Virus by Inducing Severe Inflammatory Response

Lingchen Kong et al. Front Vet Sci. .

Abstract

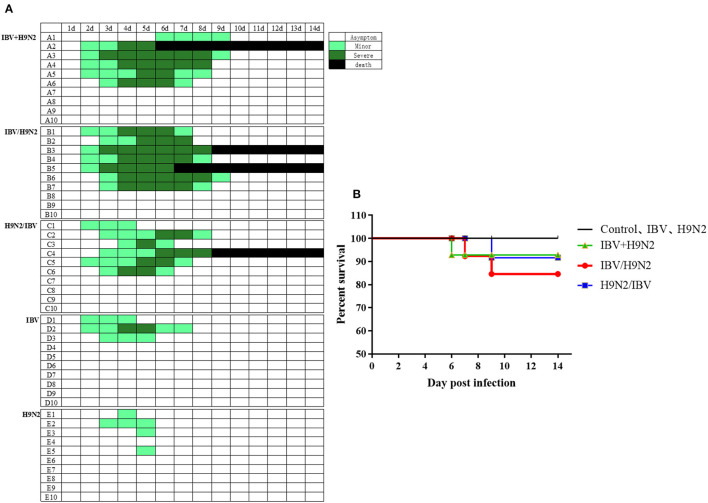
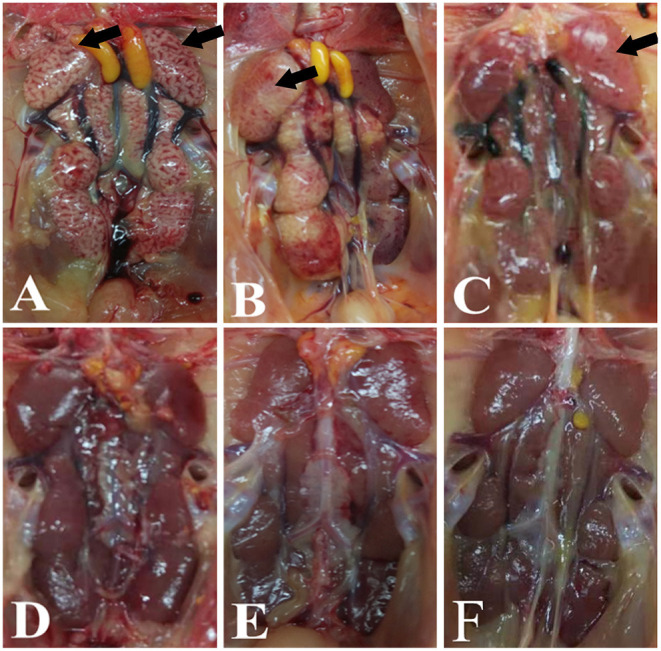
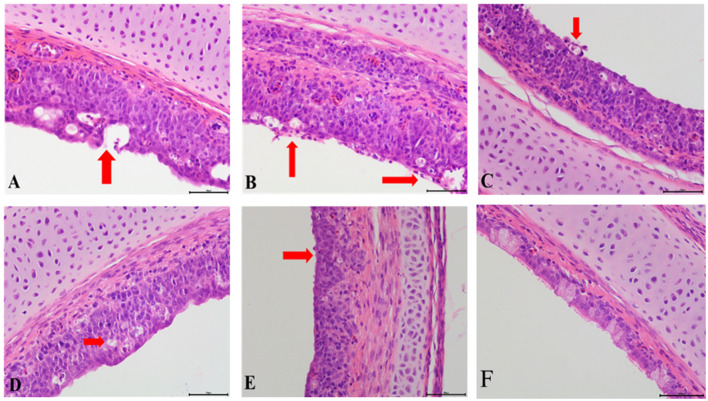
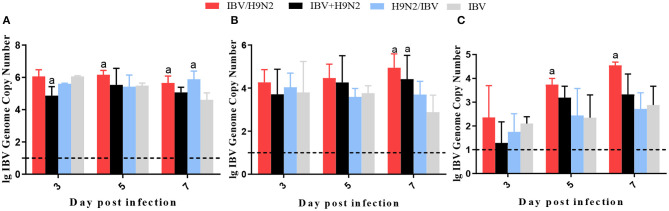
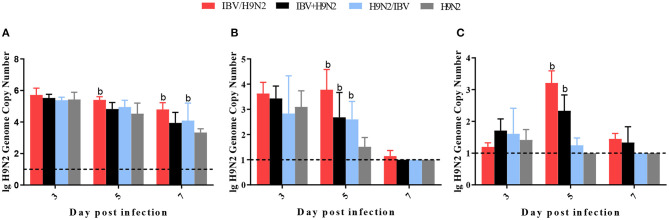
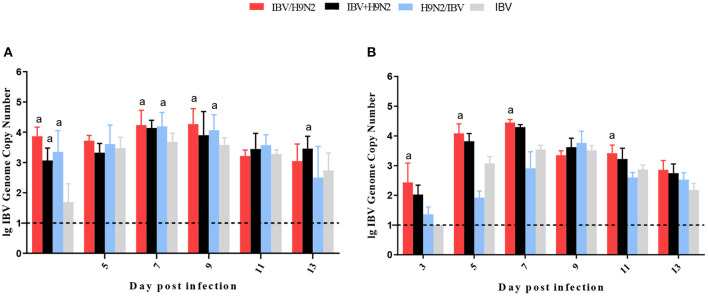
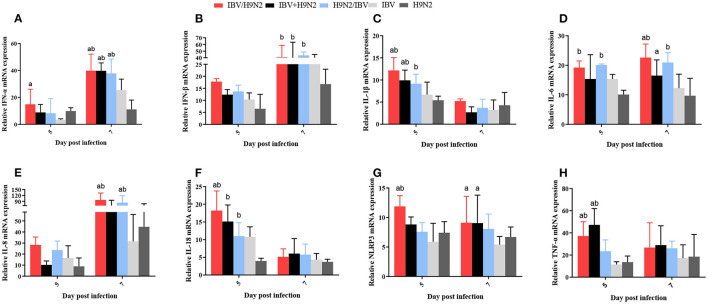
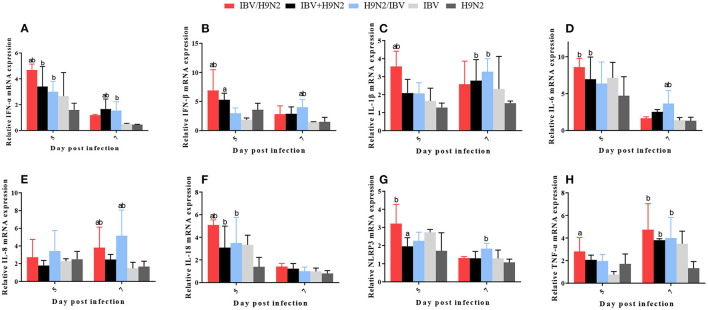
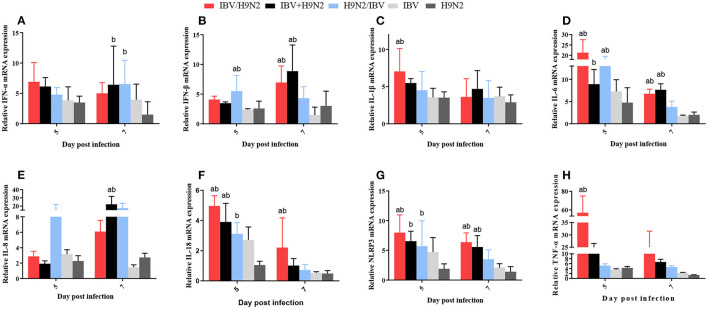
Infectious bronchitis virus (IBV) and H9N2 avian influenza virus (AIV) are frequently identified in chickens with respiratory disease. However, the role and mechanism of IBV and H9N2 AIV co-infection remain largely unknown. Specific-pathogen-free (SPF) chickens were inoculated with IBV 2 days before H9N2 virus inoculation (IBV/H9N2); with IBV and H9N2 virus simultaneously (IBV+H9N2); with H9N2 virus 2 days before IBV inoculation (H9N2/IBV); or with either IBV or H9N2 virus alone. Severe respiratory signs, pathological damage, and higher morbidity and mortality were observed in the co-infection groups compared with the IBV and H9N2 groups. In general, a higher virus load and a more intense inflammatory response were observed in the three co-infection groups, especially in the IBV/H9N2 group. The same results were observed in the transcriptome analysis of the trachea of the SPF chickens. Therefore, IBV might play a major role in the development of respiratory disease in chickens, and secondary infection with H9N2 virus further enhances the pathogenicity by inducing a severe inflammatory response. These findings may provide a reference for the prevention and control of IBV and H9N2 AIV in the poultry industry and provide insight into the molecular mechanisms of IBV and H9N2 AIV co-infection in chickens.

Keywords: H9N2 avian influenza virus; NLRP3; infectious bronchitis virus; inflammatory response; pathogenicity; transcriptome analysis.


Conflict of interest statement

The authors declare that the research was conducted in the absence of any commercial or financial relationships that could be construed as a potential conflict of interest.

Figures

Figure 1
Figure 1
Clinical signs and mortality of chickens after co-infection with IBV and H9N2 virus. (A) Clinical symptoms were observed once daily, and scored according to degree of severity. (B) Mortality rates of chickens after co-infection with IBV and H9N2 virus. IBV, infectious bronchitis virus.
Figure 2
Figure 2
Gross lesions in the kidneys. (A) IBV/H9N2 group, (B) IBV+H9N2 group, (C) H9N2/IBV group, (D) IBV group, (E) H9N2 group, and (F) control group. Black arrows point to the signs of a “spotted kidney”. IBV, infectious bronchitis virus.
Figure 3
Figure 3
Tracheal histopathology at 5 dpi. (A) IBV/H9N2 group, (B) IBV+H9N2 group, (C) H9N2/IBV group, (D) IBV group, (E) H9N2 group, and (F) Control group. Red arrows point to the lesion. Magnification 400× , scalebar 50 μM. IBV, infectious bronchitis virus.
Figure 4
Figure 4
Kidney histopathology at 7 dpi. (A) IBV/H9N2 group, (B) IBV+H9N2 group, (C) H9N2/IBV group, (D) IBV group, (E) H9N2 group, and (F) control group. Black triangles donate absence of the renal tubular lumen. White arrows donate degeneration of the renal tubular epithelial cells. Black lined arrows point to the exudation of monocytes. Solid black arrows represent the glomerulus enlargement and the absence of the renal capsule cavity. Magnification 400×, scalebar 50 μM. IBV, infectious bronchitis virus.
Figure 5
Figure 5
Viral load of IBV in chickens. To compare viral replication, certain tissues, including samples from the trachea, lungs, and kidneys, were collected at 3, 5, and 7 dpi for virus titration using one-step RT-qPCR. (A) Trachea, (B) lungs, and (C) kidneys. Data are presented as means ± SD. “a” indicates a significant difference (P < 0.05) between the three co-infection groups and the single-infection IBV group. Dashed black lines indicate the lower limit of detection. IBV, infectious bronchitis virus; RT-qPCR, quantitative reverse transcription polymerase chain reaction; SD, standard deviation.
Figure 6
Figure 6
Viral load of H9N2 virus in chickens. To compare virus replication, certain tissues, including samples from the trachea, lungs, and kidneys, were collected at 3, 5, and 7 dpi for virus titration using one-step RT-qPCR. (A) Trachea, (B) lungs, and (C) kidneys. Data are presented as means ± SD. “b” indicates a significant difference (P < 0.05) between the three co-infection groups and the single-infection H9N2 group. Dashed black lines indicate the lower limit of detection. RT-qPCR, quantitative reverse transcription polymerase chain reaction; SD, standard deviation.
Figure 7
Figure 7
Viral shedding of IBV. To investigate the viral shedding of IBV virus, oropharyngeal (A) and cloacal (B) swabs were collected for virus detection at 3, 5, 7, 9, 11, and 13 dpi using one-step RT-qPCR. Data are presented as means ± SD. “a” indicates a significant difference (P < 0.05) between the three co-infection groups and the IBV group. Dashed black lines indicate the lower limit of detection. IBV, infectious bronchitis virus; RT-qPCR, quantitative reverse transcription polymerase chain reaction; SD, standard deviation.
Figure 8
Figure 8
Viral shedding of H9N2 virus. To investigate the viral shedding of H9N2 virus, oropharyngeal (A) and cloacal (B) swabs were collected for virus detection at 3, 5, 7, 9, 11, and 13 dpi using one-step RT-qPCR. Data are presented as means ± SD. “b” indicates a significant difference (P < 0.05) between the three co-infection groups and the H9N2 group. Dashed black lines indicate the lower limit of detection. RT-qPCR, quantitative reverse transcription polymerase chain reaction; SD, standard deviation.
Figure 9
Figure 9
Effect of co-infection with IBV and H9N2 virus on inflammatory cytokines in the chicken trachea. (A) IFN-α, (B) IFN-β, (C) IL-1β, (D) IL-6, (E) IL-8, (F) IL-18, (G) NLRP3, and (H) TNF-α. Data are presented as means ± SD. “a” indicates a significant difference (P < 0.05) between the three co-infection groups and the IBV group. “b” indicates a significant difference (P < 0.05) between the three co-infection groups and the H9N2 group. “ab” indicates a significant difference (P < 0.05) between the three co-infection groups and the H9N2 group. IBV, infectious bronchitis virus; IFN, interferon; IL, interleukin; NLRP3, NLR family pyrin domain containing 3; TNF-α, tumor necrosis factor-α; SD, standard deviation.
Figure 10
Figure 10
Effect of co-infection with IBV and H9N2 virus on inflammatory cytokines in the lungs. (A) IFN-α, (B) IFN-β, (C) IL-1β, (D) IL-6, (E) IL-8, (F) IL-18, (G) NLRP3, and (H) TNF-α. Data are presented as means ± SD. “a” indicates a significant difference (P < 0.05) between the three co-infection groups and the IBV group. “b” indicates a significant difference (P < 0.05) between the three co-infection groups and the H9N2 group. “ab” indicates a significant difference (P < 0.05) between the three co-infection groups and the H9N2 group. IBV, infectious bronchitis virus; IFN, interferon; IL, interleukin; NLRP3, NLR family pyrin domain containing 3; TNF-α, tumor necrosis factor-α; SD, standard deviation.
Figure 11
Figure 11
Effect of co-infection with IBV and H9N2 virus on inflammatory cytokines in the kidneys. (A) IFN-α, (B) IFN-β, (C) IL-1β, (D) IL-6, (E) IL-8, (F) IL-18, (G) NLRP3, and (H) TNF-α. Data are presented as means ± SD. “a” indicates a significant difference (P < 0.05) between the three co-infection groups and the IBV group. “b” indicates a significant difference (P < 0.05) between the three co-infection groups and the H9N2 group. “ab” indicates a significant difference (P < 0.05) between the three co-infection groups and the H9N2 group. IBV, infectious bronchitis virus; IFN, interferon; IL, interleukin; NLRP3, NLR family pyrin domain containing 3; TNF-α, tumor necrosis factor-α; SD, standard deviation.
Figure 12
Figure 12
Effect of co-infection with IBV and H9N2 virus on the NLRP3 inflammasome. Samples from the trachea, lungs, and kidneys were collected at 5 dpi. The protein expression of NLRP3 in the trachea, lungs, and kidneys was determined using a western blot. The expression of mature IL-1β was determined using ELISA. Protein expression levels of NLRP3 in the trachea (A), lungs (B), and kidneys (C). Intensity band ratios of NLRP3 to GAPDH in the trachea (D), lungs (E), and kidneys (F). Expression levels of mature IL-1β in the trachea (G), lungs (H), and kidneys (I). Data are presented as means ± SD. “a” indicates a significant difference (P < 0.05) between the three co-infection groups and the IBV group. “b” indicates a significant difference (P < 0.05) between the three co-infection groups and the H9N2 group. IBV, infectious bronchitis virus; NLRP3, NLR family pyrin domain containing 3; ELISA, enzyme-linked immunosorbent assay; GAPDH, glyceraldehyde 3-phosphate dehydrogenase; SD, standard deviation.
Figure 13
Figure 13
Results of transcriptome analysis. (A) Statistical graph of the number of DEGs between samples. Top 20 enriched pathways based on DEGs in IBV-vs-IBV/H9N2 (B) and H9N2-vs-IBV/H9N2 (C). Rich factor is the ratio of the number of DEGs noted in the pathway terms to all gene numbers noted in this pathway term. A greater rich factor indicates higher intensiveness. Q-value is the corrected P-value ranging from 0 to 1 (green). A lower Q-value indicates higher intensiveness.

Similar articles

Cited by

References

    1. Woo PC, Lau SK, Lam CS, Lau CC, Tsang AK, Lau JH, et al. . Discovery of seven novel Mammalian and avian coronaviruses in the genus deltacoronavirus supports bat coronaviruses as the gene source of alphacoronavirus and betacoronavirus and avian coronaviruses as the gene source of gammacoronavirus and deltacoronavirus. J Virol. (2012) 86:3995–4008. 10.1128/JVI.06540-11 - DOI - PMC - PubMed
    1. da Costa VG, Moreli ML, Saivish MV. The emergence of SARS, MERS and novel SARS-2 coronaviruses in the 21st century. Arch Virol. (2020) 165:1517–26. 10.1007/s00705-020-04628-0 - DOI - PMC - PubMed
    1. Wu X, Cai Y, Huang X, Yu X, Zhao L, Wang F, et al. . Co-infection with SARS-CoV-2 and influenza A virus in patient with pneumonia, China. Emerg Infect Dis. (2020) 26:1324–6. 10.3201/eid2606.200299 - DOI - PMC - PubMed
    1. Zheng X, Wang H, Su Z, Li W, Yang D, Deng F, et al. . Co-infection of SARS-CoV-2 and influenza virus in early stage of the COVID-19 epidemic in Wuhan, China. J Infect. (2020) 81:e128–9. 10.1016/j.jinf.2020.05.041 - DOI - PMC - PubMed
    1. Hashemi SA, Safamanesh S, Ghasemzadeh-Moghaddam H, Ghafouri M, Azimian A. High prevalence of SARS-CoV-2 and influenza A virus (H1N1) coinfection in dead patients in Northeastern Iran. J Med Virol. (2020) 93:1008–12. 10.1002/jmv.26364 - DOI - PubMed

LinkOut - more resources