. 2022 Feb 8:9:830144.
doi: 10.3389/fvets.2022.830144. eCollection 2022.

Effects of 1,25-Dihydroxyvitamin D3 and 25-Hydroxyvitamin D3 on PBMCs From Dairy Cattle Naturally Infected With Mycobacterium avium subsp. paratuberculosis

Affiliations

Effects of 1,25-Dihydroxyvitamin D3 and 25-Hydroxyvitamin D3 on PBMCs From Dairy Cattle Naturally Infected With Mycobacterium avium subsp. paratuberculosis

Taylor L T Wherry et al. Front Vet Sci. .

Abstract

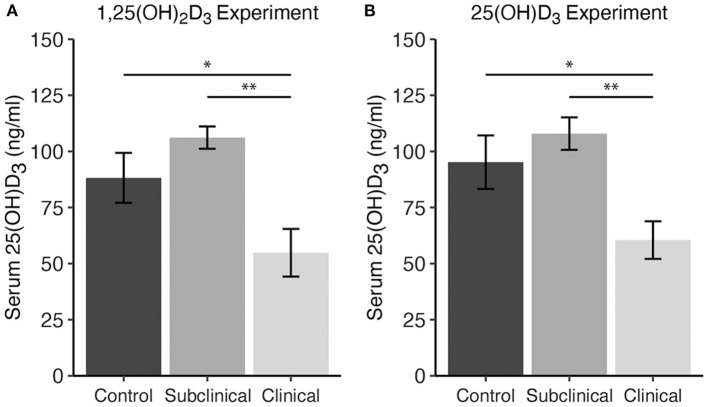
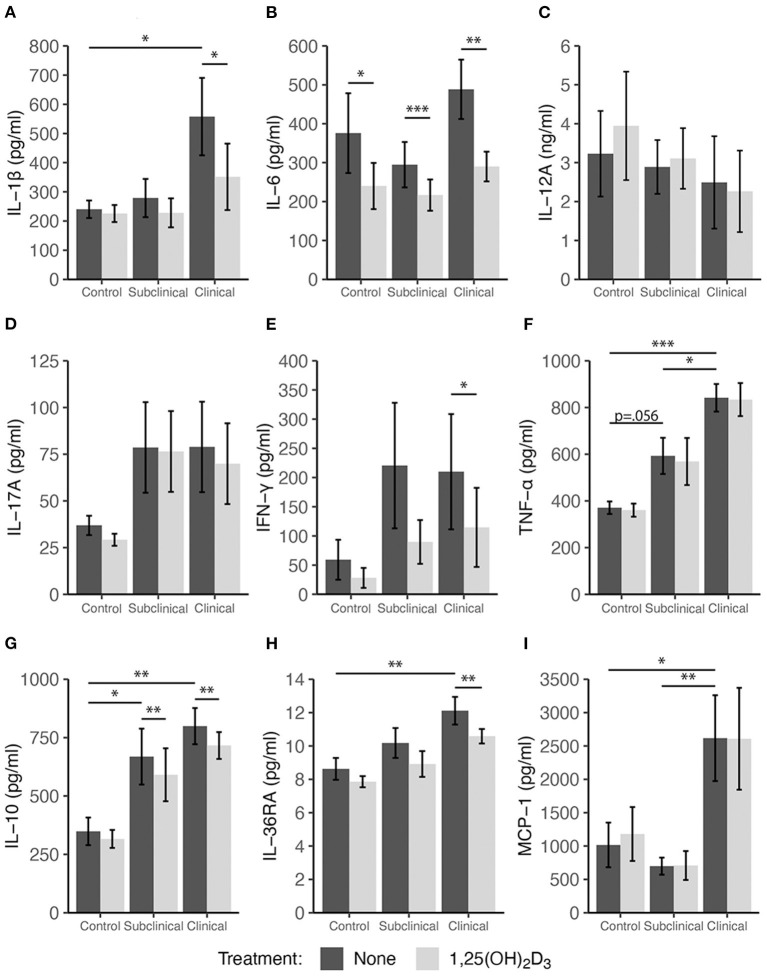
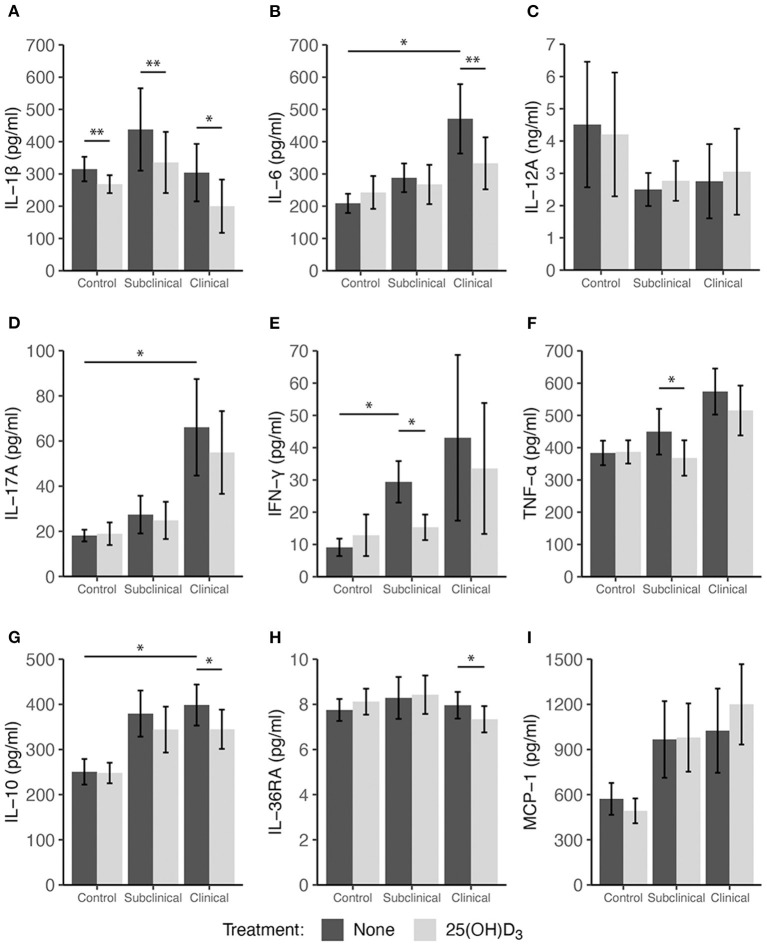
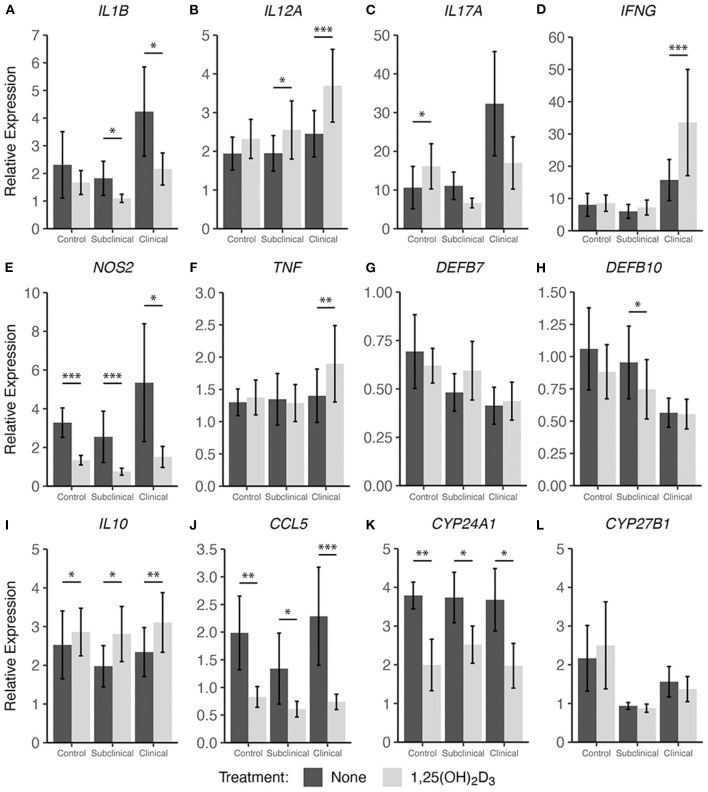
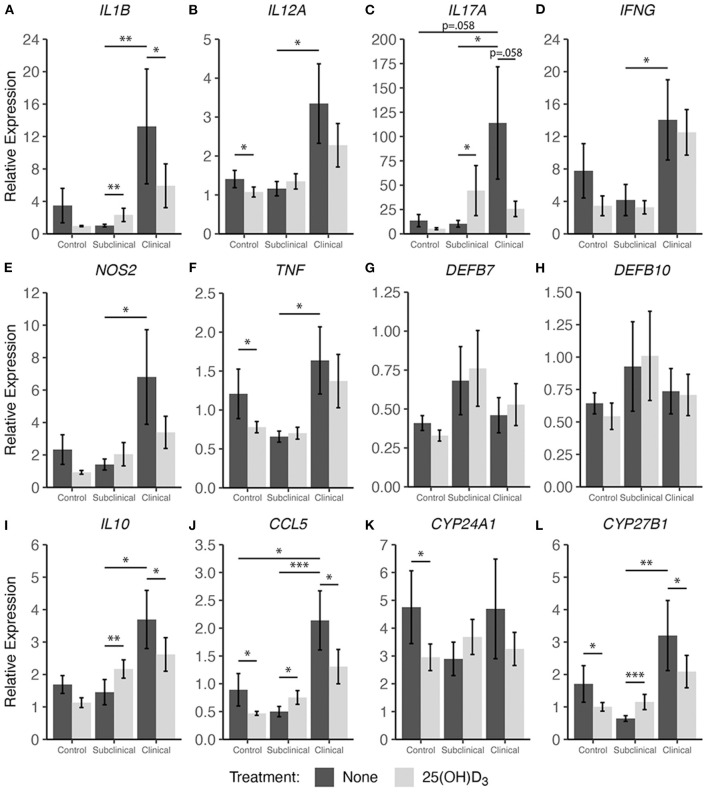
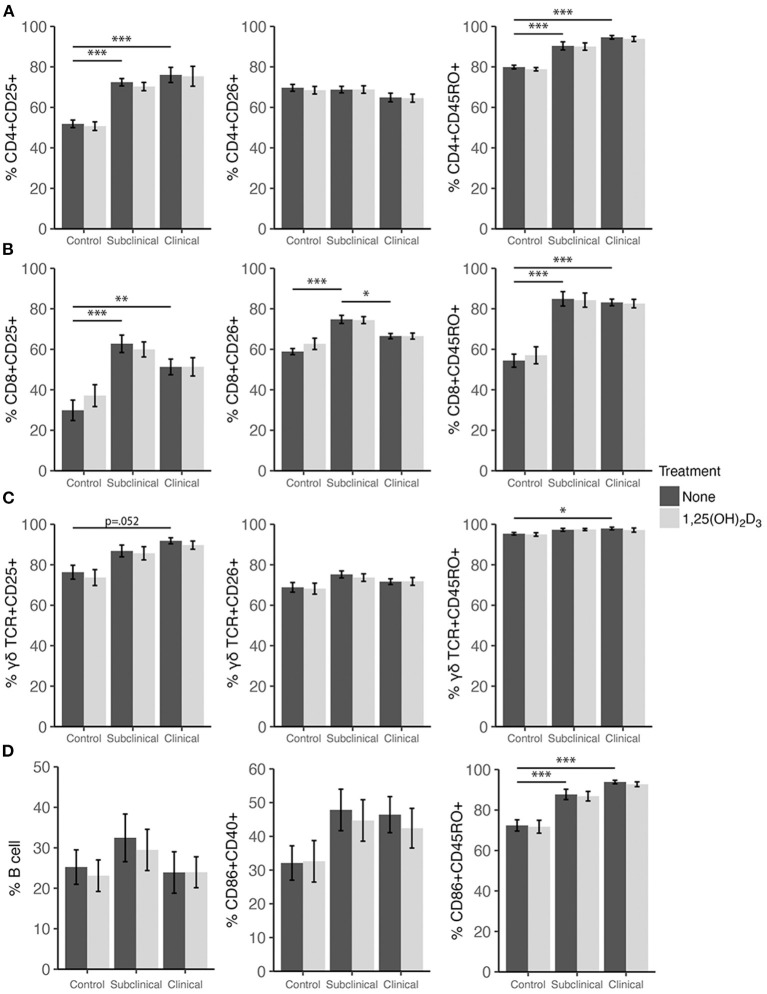
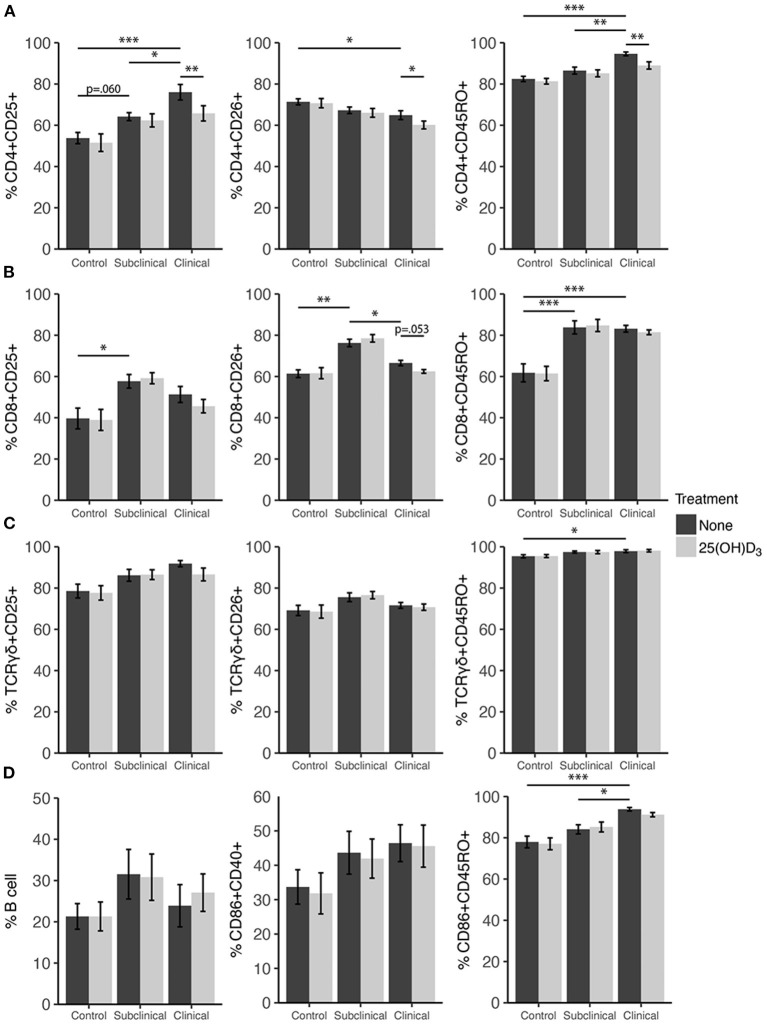
The role of vitamin D3 in modulating immune responses has been well-established for over two decades; however, its specific functions have not been extensively detailed in cattle, particularly cattle in different stages of infection with Mycobacterium avium subspecies paratuberculosis (MAP). Consistent with previous work in our lab, the present study showed that infected cattle in the clinical stage of disease have reduced serum 25-hydroxyvitamin D3 [25(OH)D3]. Additionally, effects of vitamin D3 on peripheral blood mononuclear cells (PBMCs) from naturally infected dairy cattle in subclinical (n = 8) or clinical (n = 8) stages of infection were compared to non-infected control cows (n = 8). Briefly, PBMCs were isolated and cultured in vitro with 4 ng/ml 1,25-dihydroxyvitamin D3 [1,25(OH)2D3] or 100 ng/ml 25(OH)D3. Treatment with 1,25(OH)2D3 resulted in decreased secretion for some pro-inflammatory cytokines in clinical animals, including IL-1β, IL-6, and IFN-γ. Similar responses for IL-1β and IL-6 were noted with the addition of 25(OH)D3. Additionally, pro-inflammatory cytokine gene expression tended to be upregulated in PBMCs from clinical animals after treatment with 1,25(OH)2D3. In contrast, PBMCs from clinical animals treated with 25(OH)D3 showed downregulation of pro-inflammatory cytokine gene expression, although only significant for IL1B. Following 25(OH)D3 treatment, clinical animals showed significant reduction in CD4+CD25+ T cells. CYP27B1 gene expression was notably decreased in clinical and control animals following 25(OH)D3 treatment but increased in subclinical cows. 1,25(OH)2D3 treatment reduced CYP24A1 gene expression in all groups, while 25(OH)D3 treatment only significantly reduced expression for control cows. Lastly, serum 25(OH)D3 levels were significantly lower in clinical animals. Taken together, these data show vitamin D3 modulates cytokine signaling in cattle at different stages of MAP infection and, therefore, may have implications on disease progression.

Keywords: Johne's disease; Mycobacterium avium subsp. paratuberculosis; PBMC; cattle; immune responses; vitamin D.


Conflict of interest statement

The authors declare that the research was conducted in the absence of any commercial or financial relationships that could be construed as a potential conflict of interest.

Figures

Figure 1
Figure 1
Serum 25-hydroxyvitamin D3 concentrations (ng/ml) for dairy cattle grouped by different stages of infection with Mycobacterium avium ssp. paratuberculosis for two separate experiments including either (A) 1,25(OH)2D3 or (B) 25(OH)D3 treatment. Each infection status group is comprised of n = 8. Whole blood was collected via jugular venipuncture into serum separation vacutainer tubes, allowed to clot, and centrifuged to collect serum. Data are presented as the mean ± SE and significance levels are as follows: * < 0.05, ** < 0.01.
Figure 2
Figure 2
Secretion of cytokines by PBMCs isolated from naturally infected dairy cattle (subclinical n = 8, clinical n = 8) or non-infected controls (n = 8). Peripheral blood mononuclear cells were cultured 24 h with whole cell MAP sonicate (MPS) ± 4 ng/ml 1,25(OH)2D3. Cell culture supernatants were incubated overnight with cytokine specific magnetic beads for (A) IL-1β, (B) IL-6, (D) IL-17A, (E) IFN-γ, (F) TNF-α, (G) IL-10, (H) IL-36RA, and (I) MCP-1 supplied in the Milliplex bovine multiplex assay. Fluorescence was measured using the Luminex MAGPIX xMAP instrument and cytokine concentrations were determined by standard curve. Standard ELISA was used to measure (C) IL-12A concentrations. Data are presented as the mean ± SE and significance levels are as follows: * < 0.05, ** < 0.01, *** < 0.001.
Figure 3
Figure 3
Secretion of cytokines by PBMCs isolated from naturally infected dairy cattle (subclinical n = 8, clinical n = 8) or non-infected controls (n = 8). Peripheral blood mononuclear cells were cultured 24 h with whole cell MAP sonicate (MPS) ± 100 ng/ml 25(OH)D3. Cell culture supernatants were incubated overnight with cytokine specific magnetic beads for (A) IL-1β, (B) IL-6, (D) IL-17A, (E) IFN-γ, (F) TNF-α, (G) IL-10, (H) IL-36RA, and (I) MCP-1 supplied in the Milliplex bovine multiplex assay. Fluorescence was measured using the Luminex MAGPIX xMAP instrument and cytokine concentrations were determined by standard curve. Standard ELISA was used to measure (C) IL-12A concentrations. Data are presented as the mean ± SE and significance levels are as follows: * < 0.05, ** < 0.01, *** < 0.001.
Figure 4
Figure 4
Cytokine gene expression from PBMCs isolated from naturally infected dairy cattle (subclinical n = 8 and clinical n = 8) or noninfected controls (n = 8). Cells were cultured 24 hrs with culture media or whole cell MAP sonicate (MPS) ± 4 ng/ml 1,25(OH)2D3. Extraction and purification of RNA was performed using Qiagen RNeasy Mini kits and was reverse transcribed with Superscript IV. Gene expression for (A) IL1B, (B) IL12A, (C) IL17A, (D) IFNG, (E) NOS2, (F) TNF, (G) DEFB7, (H) DEFB10, (I) IL10, (J) CCL5, (K) CYP24A1, and (L) CYP27B1 were determined using TaqMan assays and were normalized to eukaryotic 18S rRNA reference gene. Data were analyzed using the 2−ΔΔCt method and are presented as the mean relative gene expression (RQ) ± SE compared to each sample's respective non-stimulated (NS) control. Statistics were performed on ΔΔCt values and significance levels are as follows: * < 0.05, ** < 0.01, *** < 0.001.
Figure 5
Figure 5
Cytokine gene expression from PBMCs isolated from naturally infected dairy cattle (subclinical n = 8 and clinical n = 8) or noninfected controls (n = 8). Cells were cultured 24 hrs with culture media or whole cell MAP sonicate (MPS) ± 100 ng/ml 25(OH)D3. Extraction and purification of RNA was performed using Qiagen RNeasy Mini kits and was reverse transcribed with Superscript IV. Gene expression for (A) IL1B, (B) IL12A, (C) IL17A, (D) IFNG, (E) NOS2, (F) TNF, (G) DEFB7, (H) DEFB10, (I) IL10, (J) CCL5, (K) CYP24A1, and (L) CYP27B1 were determined using TaqMan assays and were normalized to eukaryotic 18S rRNA reference gene. Data were analyzed using the 2−ΔΔCt method and are presented as the mean relative gene expression (RQ) ± SE compared to each sample's respective non-stimulated (NS) control. Statistics were performed on ΔΔCt values and significance levels are as follows: * < 0.05, ** < 0.01, *** < 0.001.
Figure 6
Figure 6
Expression of activation and memory markers on the surface of (A) CD4+, (B) CD8+, (C) γδ T cells, (D) monocytes, and total B cells. Peripheral blood mononuclear cells were isolated from naturally infected dairy cattle (subclinical n = 8, clinical n = 8) or non-infected controls (n = 8) and cultured 144 h with whole cell MAP sonicate (MPS) ± 4 ng/ml 1,25(OH)2D3. Surface markers were detected using fluorescently labeled antibodies and a flow cytometer. Data are presented as the mean percentage ± SE and significance levels are as follows: * < 0.05, ** < 0.01, *** < 0.001.
Figure 7
Figure 7
Expression of activation and memory markers on the surface of (A) CD4+, (B) CD8+, (C) γδ T cells, (D) monocytes, and total B cells. Peripheral blood mononuclear cells were isolated from naturally infected dairy cattle (subclinical n = 8, clinical n = 8) or non-infected controls (n = 8) and cultured 144 h with whole cell MAP sonicate (MPS) ± 100 ng/ml 25(OH)D3. Surface markers were detected using fluorescently labeled antibodies and a flow cytometer. Data are presented as the mean percentage ± SE and significance levels are as follows: * < 0.05, ** < 0.01, *** < 0.001.

Similar articles

Cited by

References

    1. Reinhardt TA, Hustmyer FG. Role of vitamin D in the immune system. J Dairy Sci. (1987) 70:952–62. 10.3168/jds.S0022-0302(87)80099-1 - DOI - PubMed
    1. Colotta F, Jansson B, Bonelli F. Modulation of inflammatory and immune responses by vitamin D. J Autoimmun. (2017) 85:78–97. 10.1016/j.jaut.2017.07.007 - DOI - PubMed
    1. Kongsbak M, von Essen MR, Levring TB, Schjerling P, Woetmann A, Ødum N, et al. . Vitamin D-binding protein controls T cell responses to vitamin D. BMC Immunol. (2014) 15:35. 10.1186/s12865-014-0035-2 - DOI - PMC - PubMed
    1. Nelson CD, Reinhardt TA, Thacker TC, Beitz DC, Lippolis JD. Modulation of the bovine innate immune response by production of 1α,25-dihydroxyvitamin D3 in bovine monocytes. J Dairy Sci. (2010) 93:1041–9. 10.3168/jds.2009-2663 - DOI - PubMed
    1. Nelson CD, Nonnecke BJ, Reinhardt TA, Waters WR, Beitz DC, Lippolis JD. Regulation of Mycobacterium-specific mononuclear cell responses by 25-hydroxyvitamin D3. PLoS ONE. (2011) 6:e21674. 10.1371/journal.pone.0021674 - DOI - PMC - PubMed