. 2021 Jun:6:60-81.
doi: 10.1016/j.xjon.2020.09.002. Epub 2020 Sep 21.

Bioprosthetic aortic valve diameter and thickness are directly related to leaflet fluttering: Results from a combined experimental and computational modeling study

Affiliations

Bioprosthetic aortic valve diameter and thickness are directly related to leaflet fluttering: Results from a combined experimental and computational modeling study

Jae H Lee et al. JTCVS Open. 2021 Jun.

Abstract

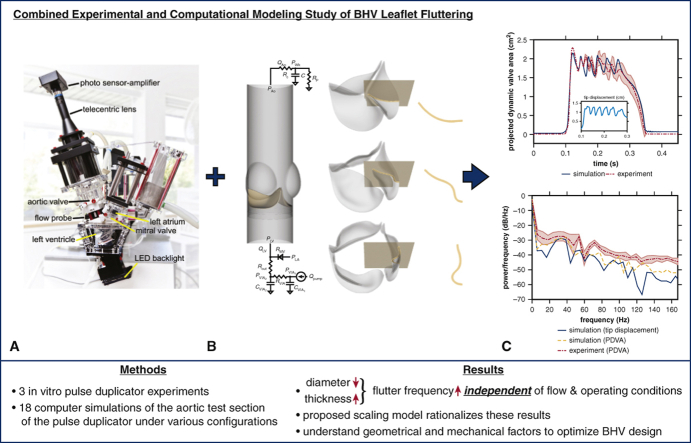
Objective: Bioprosthetic heart valves (BHVs) are commonly used in surgical and percutaneous valve replacement. The durability of percutaneous valve replacement is unknown, but surgical valves have been shown to require reintervention after 10 to 15 years. Further, smaller-diameter surgical BHVs generally experience higher rates of prosthesis-patient mismatch, which leads to higher rates of failure. Bioprosthetic aortic valves can flutter in systole, and fluttering is associated with fatigue and failure in flexible structures. The determinants of flutter in BHVs have not been well characterized, despite their potential to influence durability.

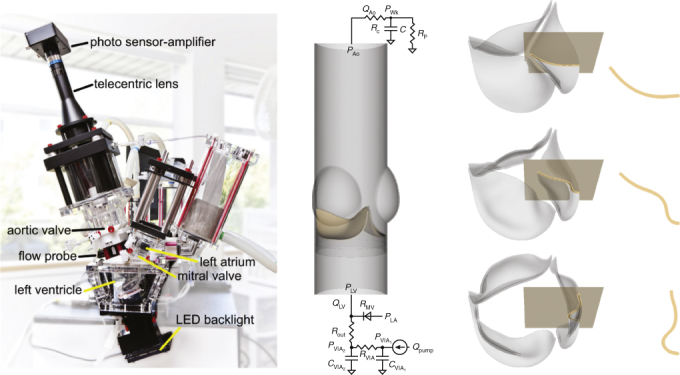
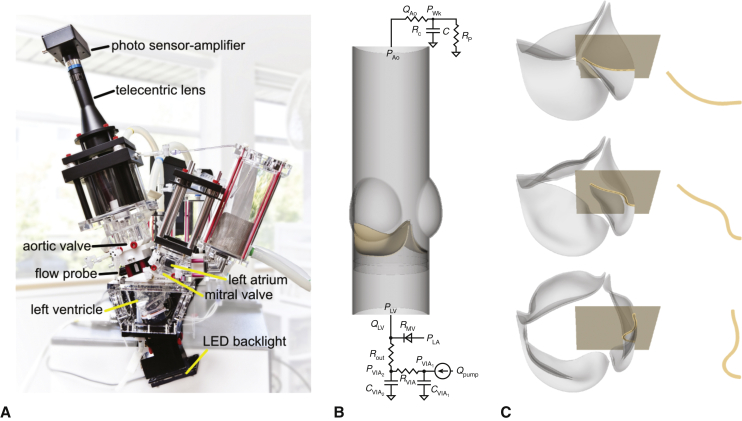
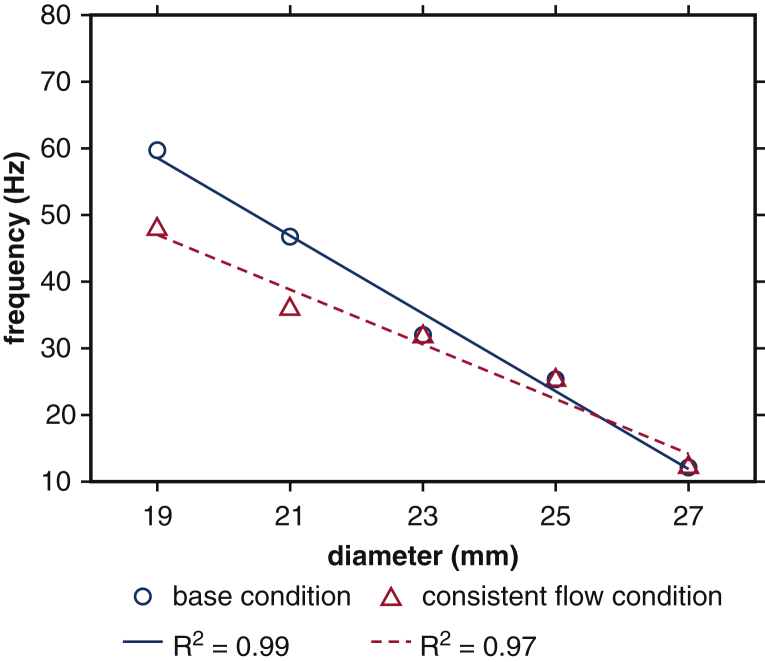
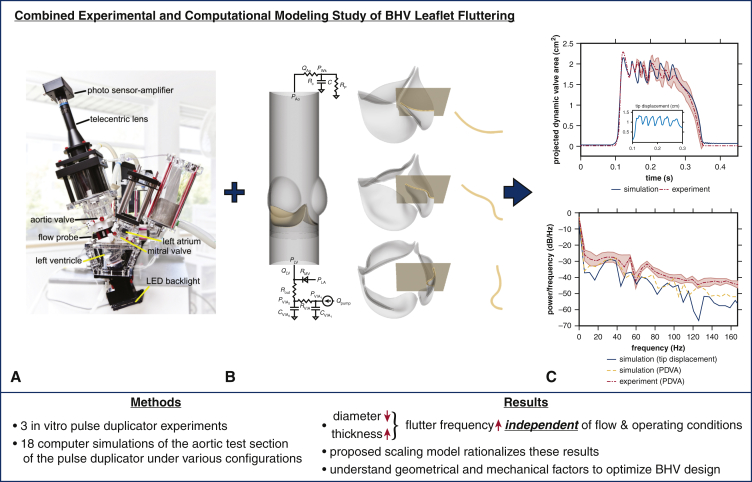
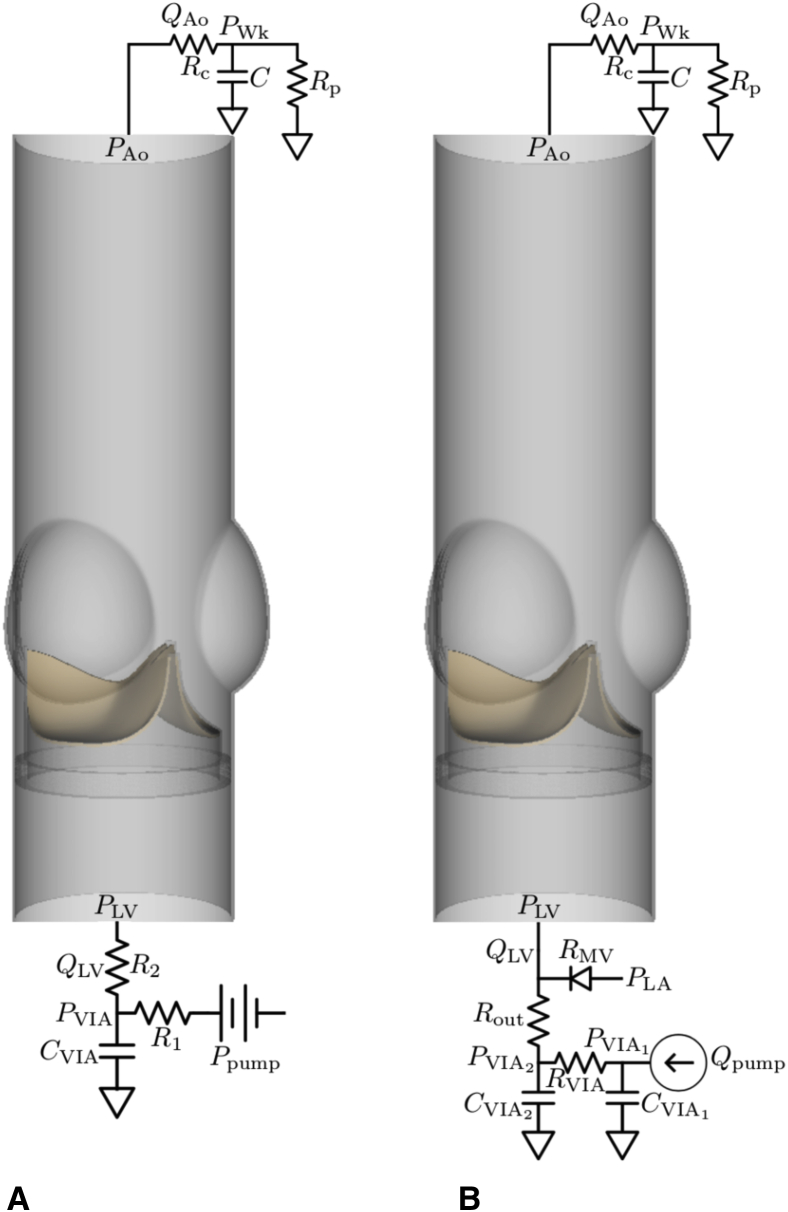
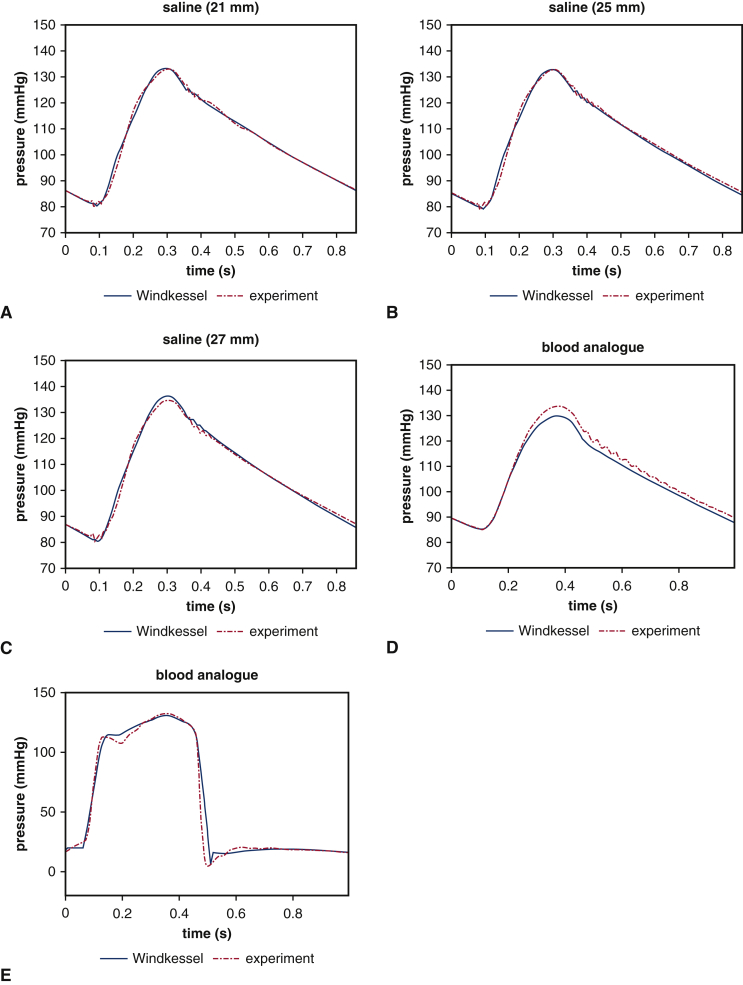
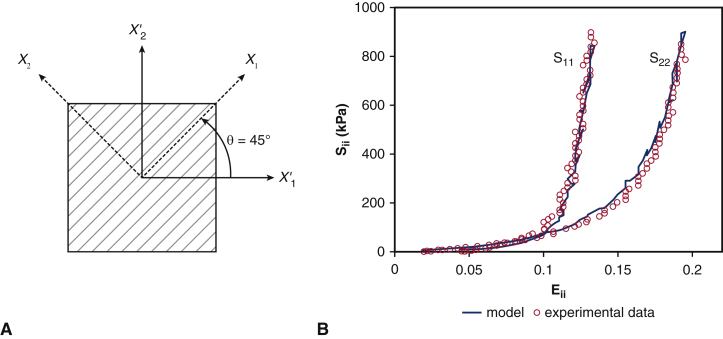
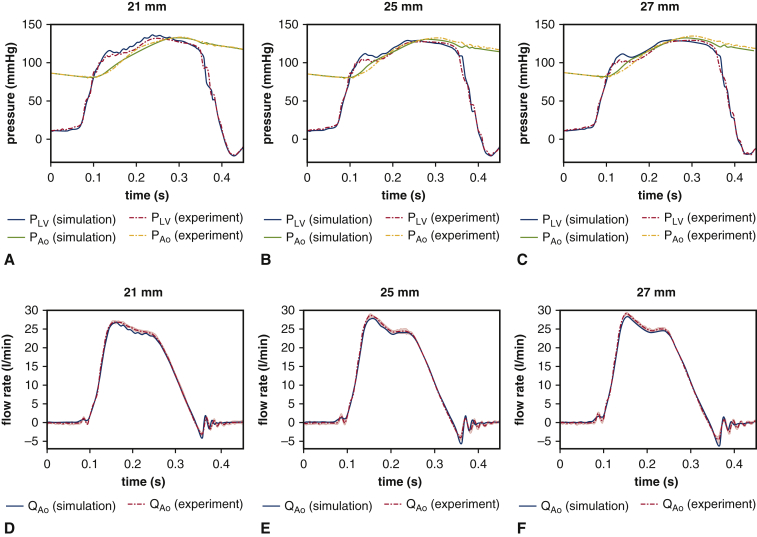
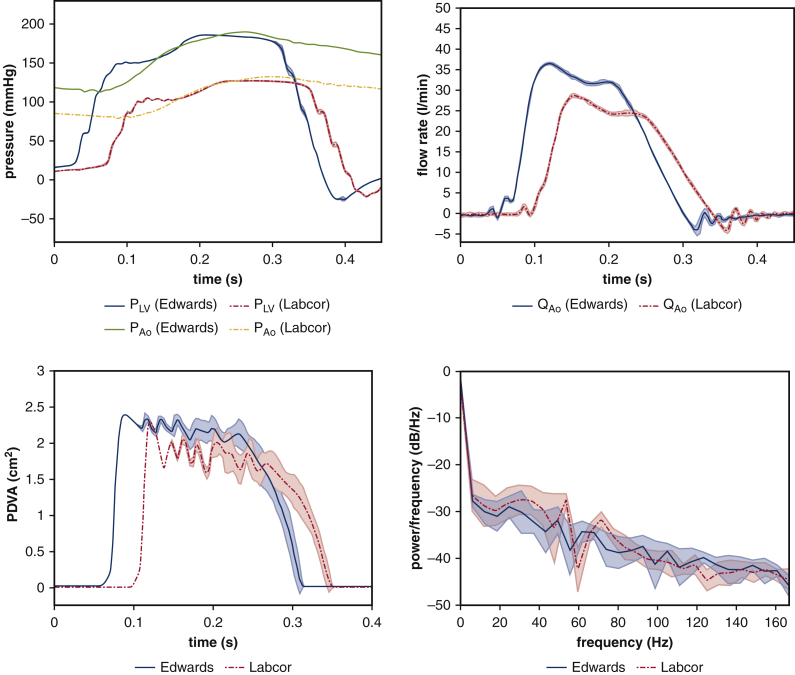
Methods: We use an experimental pulse duplicator and a computational fluid-structure interaction model of this system to study the role of device geometry on BHV dynamics. The experimental system mimics physiological conditions, and the computational model enables precise control of leaflet biomechanics and flow conditions to isolate the effects of variations in BHV geometry on leaflet dynamics.

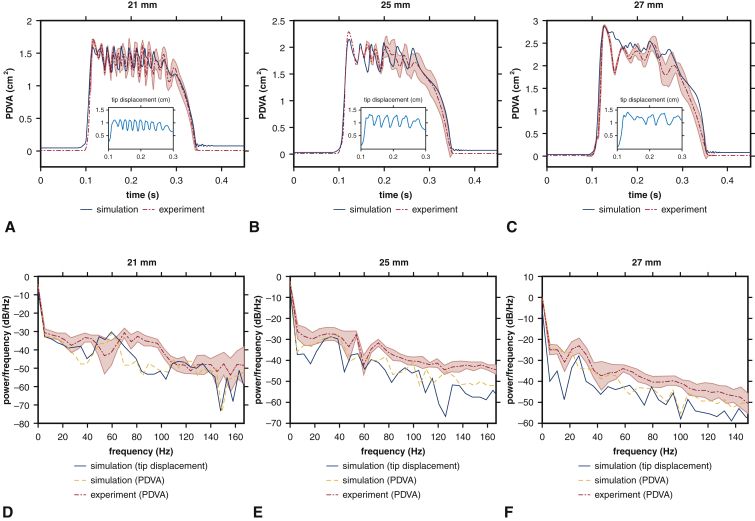
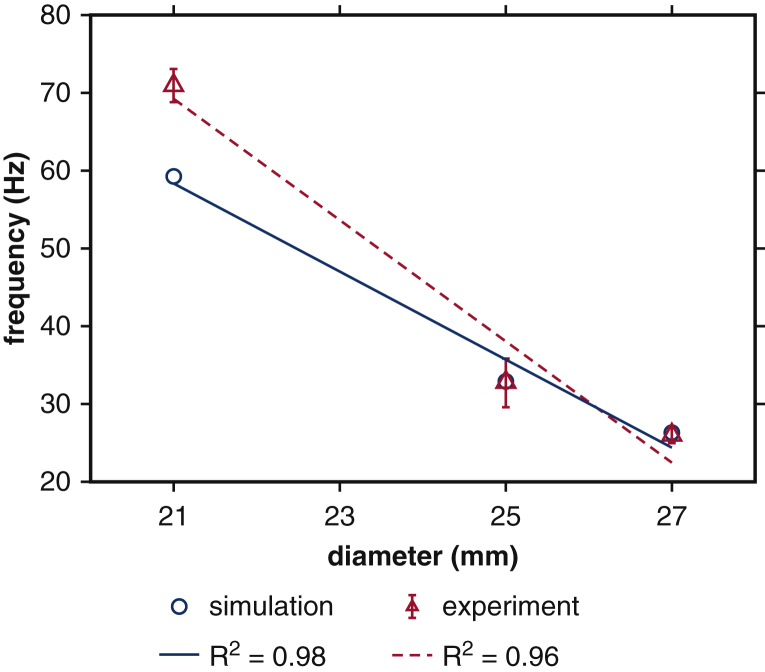
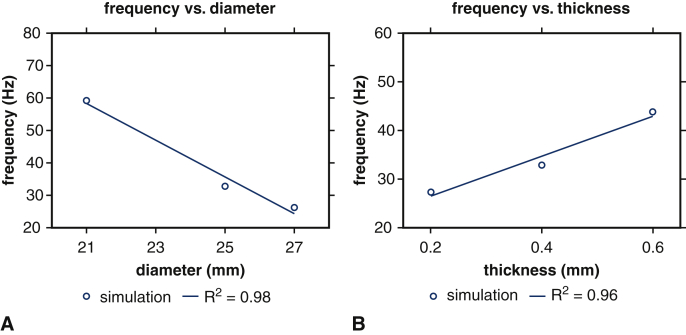
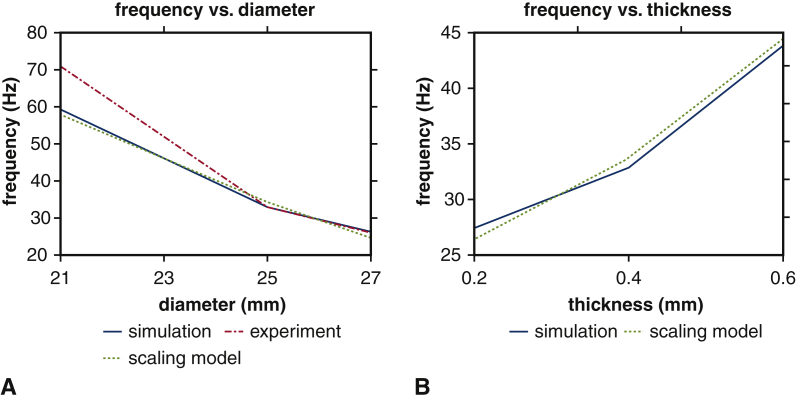
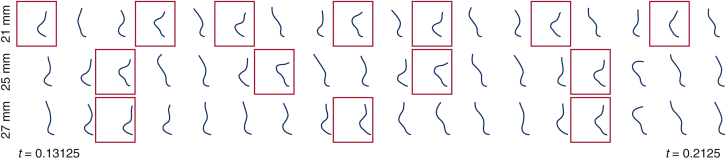
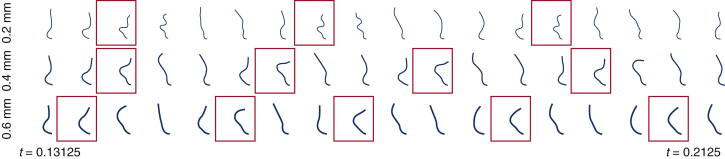
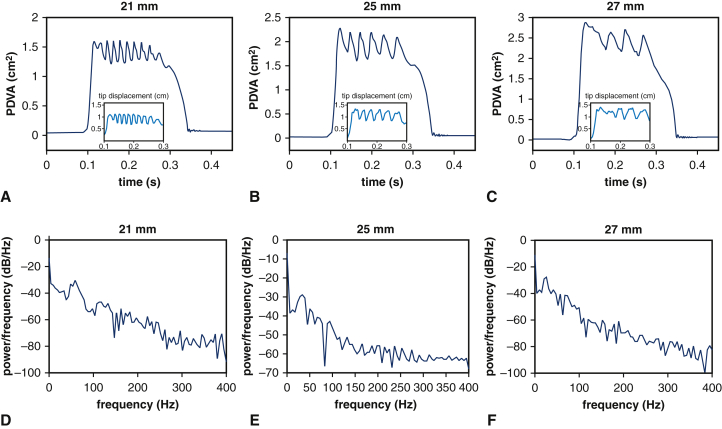
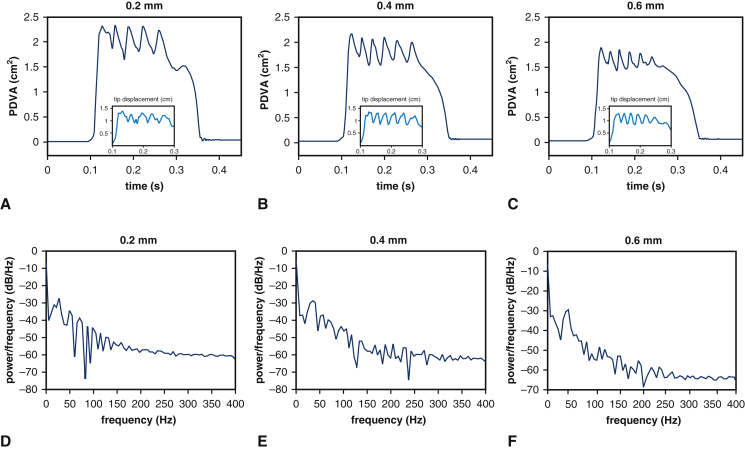
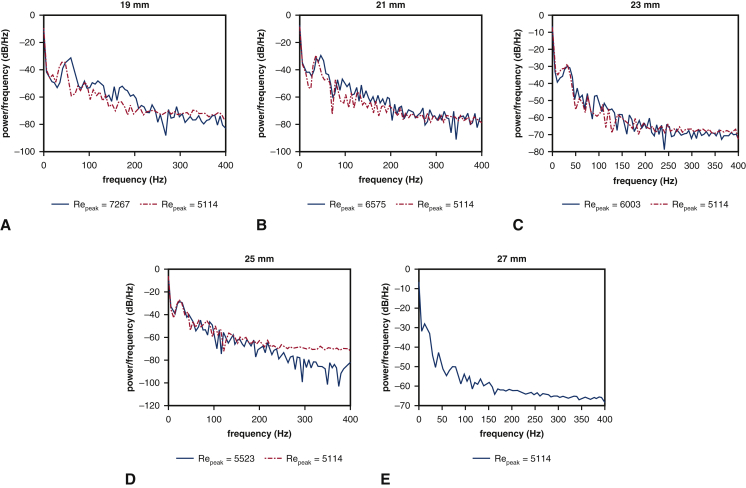
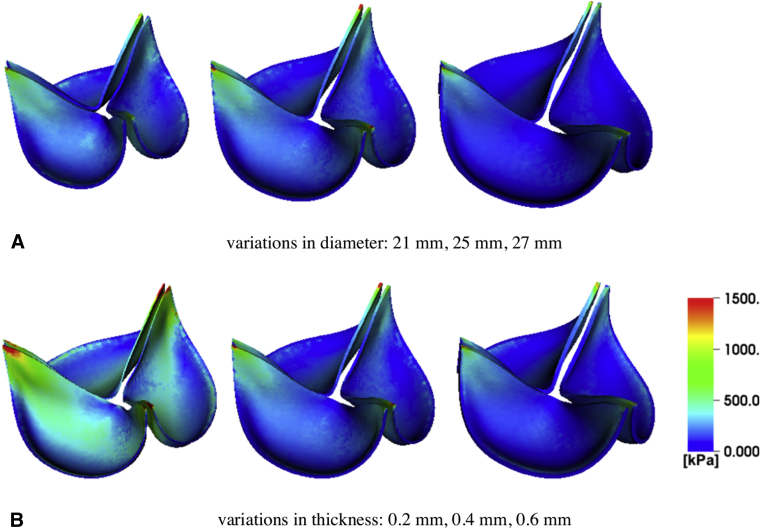
Results: Both experimental and computational models demonstrate that smaller-diameter BHVs yield markedly higher leaflet fluttering frequencies across a range of conditions. The computational model also predicts that fluttering frequency is directly related to leaflet thickness. A scaling model is introduced that rationalizes these findings.

Conclusions: We systematically characterize the influence of BHV diameter and leaflet thickness on fluttering dynamics. Although this study does not determine how flutter influences device durability, increased flutter in smaller-diameter BHVs may explain how prosthesis-patient mismatch could induce BHV leaflet fatigue and failure. Ultimately, understanding the effects of device geometry on leaflet kinematics may lead to more durable valve replacements.

Keywords: aortic valve replacement; bioprosthetic heart valves; computational fluid dynamics; computer modeling and simulation; experimental platforms for device characterization; fluid-structure interaction; valvular heart disease.


Conflict of interest statement

Conflict of Interest Statement Dr Vavalle serves as a consultant for Edwards Lifesciences. All other authors reported no conflicts of interest. The Journal policy requires editors and reviewers to disclose conflicts of interest and to decline handling or reviewing manuscripts for which they may have a conflict of interest. The editors and reviewers of this article have no conflicts of interest.

Figures

None
Graphical abstract
None
Experimental and computational models quantify influences of device geometry on valve dynamics.
Figure 1
Figure 1
Experimental and computational pulse duplicators. A, Customized pulse duplicator with electro-optical subsystem for measuring aortic valve projected dynamic valve area. B, Computer model of the aortic valve test section in the pulse duplicator with pericardial bioprosthetic heart valve (BHV) and reduced-order models of the upstream and downstream system components. C, Three-dimensional rendering of the model BHV leaflets. Leaflet kinematics are detailed on the highlighted cross-sections in Figures E5 and E6.
Figure 2
Figure 2
Analysis of experimental and computational leaflet kinematics. Experimental measurements show variations over 10 consecutive cycles, with shaded regions showing where 95% of the data fall. For each available valve diameter, the computer model matches the experimental operating conditions, which are different for each valve. Panels A through C compare simulated results to the experimental data for projected dynamic valve area (PDVA), and insets show the simulated displacement of the leaflet tip from the center of the valve. Panels D through F show frequency analyses. Dominant fluttering frequencies from experimental and simulated PDVA signals and simulated tip displacement signals are, respectively, D, 70.97 ± 2.11 Hz, 59.63 Hz, 59.26 Hz; E, 32.74 ± 3.14 Hz, 38.62 Hz, 32.88 Hz; and F, 26.03 ± 1.04 Hz, 21.05 Hz, 26.32 Hz. Smaller valves clearly show markedly higher fluttering frequencies.
Figure 3
Figure 3
Comparison of linear regressions of fluttering frequency versus valve diameter between simulations and experiments. Blue circles represent dominant fluttering frequency data from simulations that match the different experimental operating conditions of each device. Red triangles represent dominant fluttering frequency data with respect to valve diameters obtained from experimental projected dynamic valve area measurements. Linear regressions demonstrate that both simulation and experiment show negative relations between frequency response and valve diameter, with proportionality coefficients –5.65 Hz/mm and –7.79 Hz/mm, respectively, for simulation (blue solid) and experiment (red dashed).
Figure 4
Figure 4
Linear regressions of fluttering frequency versus valve diameter and leaflet thickness under consistent operating conditions. Blue circles represent dominant fluttering frequency data from simulations with respect to (A) valve diameter and (B) leaflet thickness under consistent operating conditions. Linear regressions demonstrate that simulations show (A) negative relations between frequency response and valve diameter, with proportionality coefficient –5.65 Hz/mm, and (B) positive relations between frequency response and leaflet thickness, with proportionality coefficient 41.1 Hz/mm.
Figure 5
Figure 5
Comparison of leaflet fluttering frequency versus scaling model for different bioprosthetic heart valve (BHV) diameters and leaflet thicknesses. Panel A compares fluttering frequencies obtained for different BHV diameters to frequencies determined from the scaling law. Panel B compares fluttering frequencies obtained for different BHV leaflet thicknesses to frequencies determined from the scaling law. The results are consistent in both cases.
Figure 6
Figure 6
Linear regression of fluttering frequency versus valve diameter at physiological Reynolds numbers with consistent operating and flow conditions. Blue circles represent dominant fluttering frequency data with respect to valve diameters obtained for a fixed operating condition but varying flow conditions (quantified by Reynolds number). Red triangles represent dominant fluttering frequency data with respect to valve diameters in which the driving condition is modified to match Reynolds number. Linear regressions show negative relations between frequency response and valve diameter, with proportionality coefficients –5.83 Hz/mm (blue solid) and –4.10 Hz/mm (red dashed) for consistent operating conditions and flow conditions, respectively.
Figure 7
Figure 7
Graphical abstract that summarizes methodology, main results, and clinical implications. We leverage both (A) experimental and (B) computational platforms (C) to analyze the dominant leaflet flutter frequency. Our main results suggest that as valve diameter decreases and leaflet thickness increases the flutter frequency increases independent of flow and operating conditions. Our proposed scaling model rationalizes these results. This study may help us better understand geometrical and mechanical factors to optimize bioprosthetic heart valve (BHV) design.
Figure E1
Figure E1
Reduced-order models that provide driving and loading conditions. Three-element Windkessel (R-C-R) models are used at the downstream (outlet) for both cases. A, A three-element Windkessel model is used at the upstream (inlet) for simulations that use saline as test fluid. B, A more detailed upstream model is used at the upstream for simulations that use glycerin-based blood analog as test fluid. Because pump flow rate data are available for the experiments that used a glycerin-based blood analog, we are able to modify the pump flow rate to impose consistent flow conditions necessary for the study reported in Figure 7.
Figure E2
Figure E2
Reduced-order model fits of the experimental pressure data for the saline and glycerin-based analog cases. Panels A through D show the fits of the experimental downstream pressure data for both saline and glycerin-based blood analog cases. These fits are obtained using the nonlinear optimization routine fmincon in MATLAB by comparing experimental values of downstream pressure to the computed downstream pressure from the reduced-order model with experimental values of downstream flow rate as inputs to the model. Panel E shows the experimental upstream pressure data for glycerin-based blood analog case. The fit is obtained by comparing experimental values of upstream pressure to the computed upstream pressure from the reduced-order model with experimental values of left atrial pressure and pump flow rate as inputs to the model.
Figure E3
Figure E3
Parameter fitting for the valve material models. A, Schematic of the biaxial tensile tests of Kim and colleagues for bovine pericardium tissue specimens to study their material response. X1 is the preferred mean fiber direction, also shown by gray lines, X2 is the cross-preferred fiber direction, and X1 and X2 are the directions in which forces were applied. B, Parameter fitting for the bovine pericardial valve using the equibiaxial data from Kim and colleagues compared with the plot using parameters determined by Kim and colleagues, who used a finite element model of the biaxial test.
Figure E4
Figure E4
Analysis of experimental and computational pressure and volumetric flow rates. Experimental measurements show variations over 10 consecutive cycles, with shaded regions showing where 95% of the data fall. For each available valve diameter, the computer model matches the experimental operating conditions, which are different for each valve. We compare simulated (A through C) pressure waveforms and (D through F) flow rates to the experimental data. The simulated pressure and flow rates are in excellent agreement with the experimental data.
Figure E5
Figure E5
Detailed leaflet kinematics obtained from the computer model with different valve diameters. Time series of leaflet cross sections (see Figure 1, C) for different valve diameters described in Figure 2. Red boxes indicate the times when the peak tip displacement of the leaflet occurs. Note that complex flow patterns result in only quasiperiodic leaflet kinematics. The smaller-diameter valve (21 mm) shows more frequent leaflet bending than the larger-diameter valve (27 mm).
Figure E6
Figure E6
Detailed leaflet kinematics obtained from the computational model with different leaflet thicknesses. Time series of leaflet cross sections (see Figure 1, C) for different valve thicknesses for a fixed valve diameter (25 mm) described in Figure 6. Red boxes indicate the times when the peak tip displacement of the leaflet occurs. The valve with the thickest leaflets (0.6 mm) shows more frequent leaflet bending than the thinnest leaflets (0.2 mm).
Figure E7
Figure E7
Analysis of simulated leaflet kinematics for valves with different diameters under consistent operating conditions. A through C, projected dynamic valve area (PDVA) and tip displacements are obtained from the computational models for each valve diameter using volumetric flow rates and pressure loads corresponding to the 21 mm valve in Figure 2, A. D through F, Frequency analyses quantify dominant fluttering frequencies: D, 59.26 Hz; E, 32.88 Hz; and F, 26.32 Hz. These frequencies are identical to those reported in Figure 2.
Figure E8
Figure E8
Analysis of simulated leaflet kinematics for valves with different leaflet thicknesses under consistent operating condition. A though C, Projected dynamic valve area (PDVA) and tip displacements are obtained from the computational models using the operating condition for the 25 mm valve but with varying leaflet thicknesses. D though F, Frequency analyses quantify the dominant fluttering frequencies: D, 27.40 Hz (0.2 mm); E, 32.88 Hz (0.4 mm); and F, 43.84 Hz (0.6 mm). These results suggest that at a fixed diameter, valves with thinner leaflets flutter at lower frequencies.
Figure E9
Figure E9
Analysis of simulated leaflet kinematics for valves with different diameters at physiological Reynolds numbers with consistent operating and flow conditions. A though E, frequency analyses of leaflet fluttering obtained using a glycerin-based blood analog. Blue solid lines represent the simulation results obtained for a fixed operating condition but varying flow conditions (quantified by Reynolds number [Repeak]). Red dashed lines represent results in which the driving condition is modified to match Repeak. The dominant fluttering frequencies for different Reynolds number cases are: A, 59.70 and 47.86 Hz; B, 46.75 and 35.82 Hz; C, 32.00 and 31.75 Hz; D, 25.32 and 25.24 Hz; and E, 12.12 Hz. Smaller-diameter valves show higher frequency leaflet fluttering.
Figure E10
Figure E10
Stress analyses for 25 mm valves with different leaflet thicknesses. A, Comparison of von Mises stress between valves with a fixed thickness (0.4 mm) and different diameters (21 mm, 25 mm, 27 mm). B, Comparison of von Mises stress between valves with a fixed diameter (25 mm) and different thicknesses (0.2 mm, 0.4 mm, 0.6 mm). The results in panel A indicate that for a fixed thickness, the larger valve experiences smaller stress on the leaflets during diastole. This suggests that larger diameter valves may have an advantage in durability both during systole and diastole. The results in panel B indicate that for a fixed diameter, the thinner valve leaflets experience higher stress loads.
Figure E11
Figure E11
Comparison of leaflet kinematics of 25 mm DKA (Labcor Laboratórios Ltd, Belo Horizonte, Brazil) versus Perimount (Edwards Lifesciences, Irvine, Calif) valves. Experimental measurements show variations over 10 consecutive cycles, with shaded regions showing where 95% of the data fall for both valves. We quantify the dominant fluttering frequencies from the experimental projected dynamic valve area (PDVA) signals: 32.74 ± 3.14 Hz for the Labcor valve and 29.62 ± 4.7 Hz for the Edwards valve.

Comment in

References

    1. Nishimura R.A., Otto C.M., Bonow R.O., Carabello B.A., Erwin J.P., III, Guyton R.A., et al. 2014 AHA/ACC guideline for the management of patients with valvular heart disease: executive summary: a report of the American College of Cardiology/American Heart Association task force on practice guidelines. Circulation. 2014;129:2440–2492. - PubMed
    1. Dvir D., Bourguignon T., Otto C.M., Hahn R.T., Rosenhek R., Webb J.G., et al. Standardized definition of structural valve degeneration for surgical and transcatheter bioprosthetic aortic valves. Circulation. 2018;137:388–399. - PubMed
    1. Mack M.J., Leon M.B., Thourani V.H., Makkar R.R., Kodali S.K., Russo M., et al. Transcatheter aortic-valve replacement with a balloon-expandable valve in low-risk patients. N Engl J Med. 2019;380:1695–1705. - PubMed
    1. Alam M., Lakier J.B., Goldstein S. Echocardiographic evaluation of porcine bioprosthetic valve degeneration. Henry Ford Hosp Med J. 1982;30:124–127. - PubMed
    1. Peacock J.A. An in vitro study of the onset of turbulence in the sinus of valsalva. Circ Res. 1990;67:448–460. - PubMed

Appendix References

    1. Griffith B.E., Luo X.Y. Hybrid finite difference/finite element immersed boundary method. Int J Numer Meth Biomed Eng. 2017;33:e2888. - PMC - PubMed
    1. Zhang L.T., Gay M. Immersed finite element method for fluid-structure interactions. J Fluids Struct. 2007;23:839–857. - PMC - PubMed
    1. Wang X., Zhang L.T. Interpolation functions in the immersed boundary and finite element methods. Comput Method Appl Mech Eng. 2010;45:321–334.
    1. Liu W.K., Liu Y., Farrell D., Zhang L., Wang X.S., Fukui Y., et al. Immersed finite element method and its applications to biological systems. Comput Methods Appl Mech Eng. 2006;195:1722–1749. - PMC - PubMed
    1. Zhang L., Gerstenberger A., Wang X., Liu W.K. Immersed finite element method. Comput Methods Appl Mech Engrg. 2004;193:2051–2067.