. 2021 Jun;2(6):e340-e351.
doi: 10.1016/s2666-7568(21)00089-1. Epub 2021 May 21.

The state of diabetes treatment coverage in 55 low-income and middle-income countries: a cross-sectional study of nationally representative, individual-level data in 680 102 adults

Affiliations

The state of diabetes treatment coverage in 55 low-income and middle-income countries: a cross-sectional study of nationally representative, individual-level data in 680 102 adults

David Flood et al. Lancet Healthy Longev. 2021 Jun.

Abstract

Background: Approximately 80% of the 463 million adults worldwide with diabetes live in low- and middle-income countries (LMICs). A major obstacle to designing evidence-based policies to improve diabetes outcomes in LMICs is the limited nationally representative data on the current patterns of treatment coverage. The objectives of this study are (1) to estimate the proportion of adults with diabetes in LMICs who receive coverage of recommended pharmacological and non-pharmacological diabetes treatment and (2) to describe country-level and individual-level characteristics that are associated with treatment.

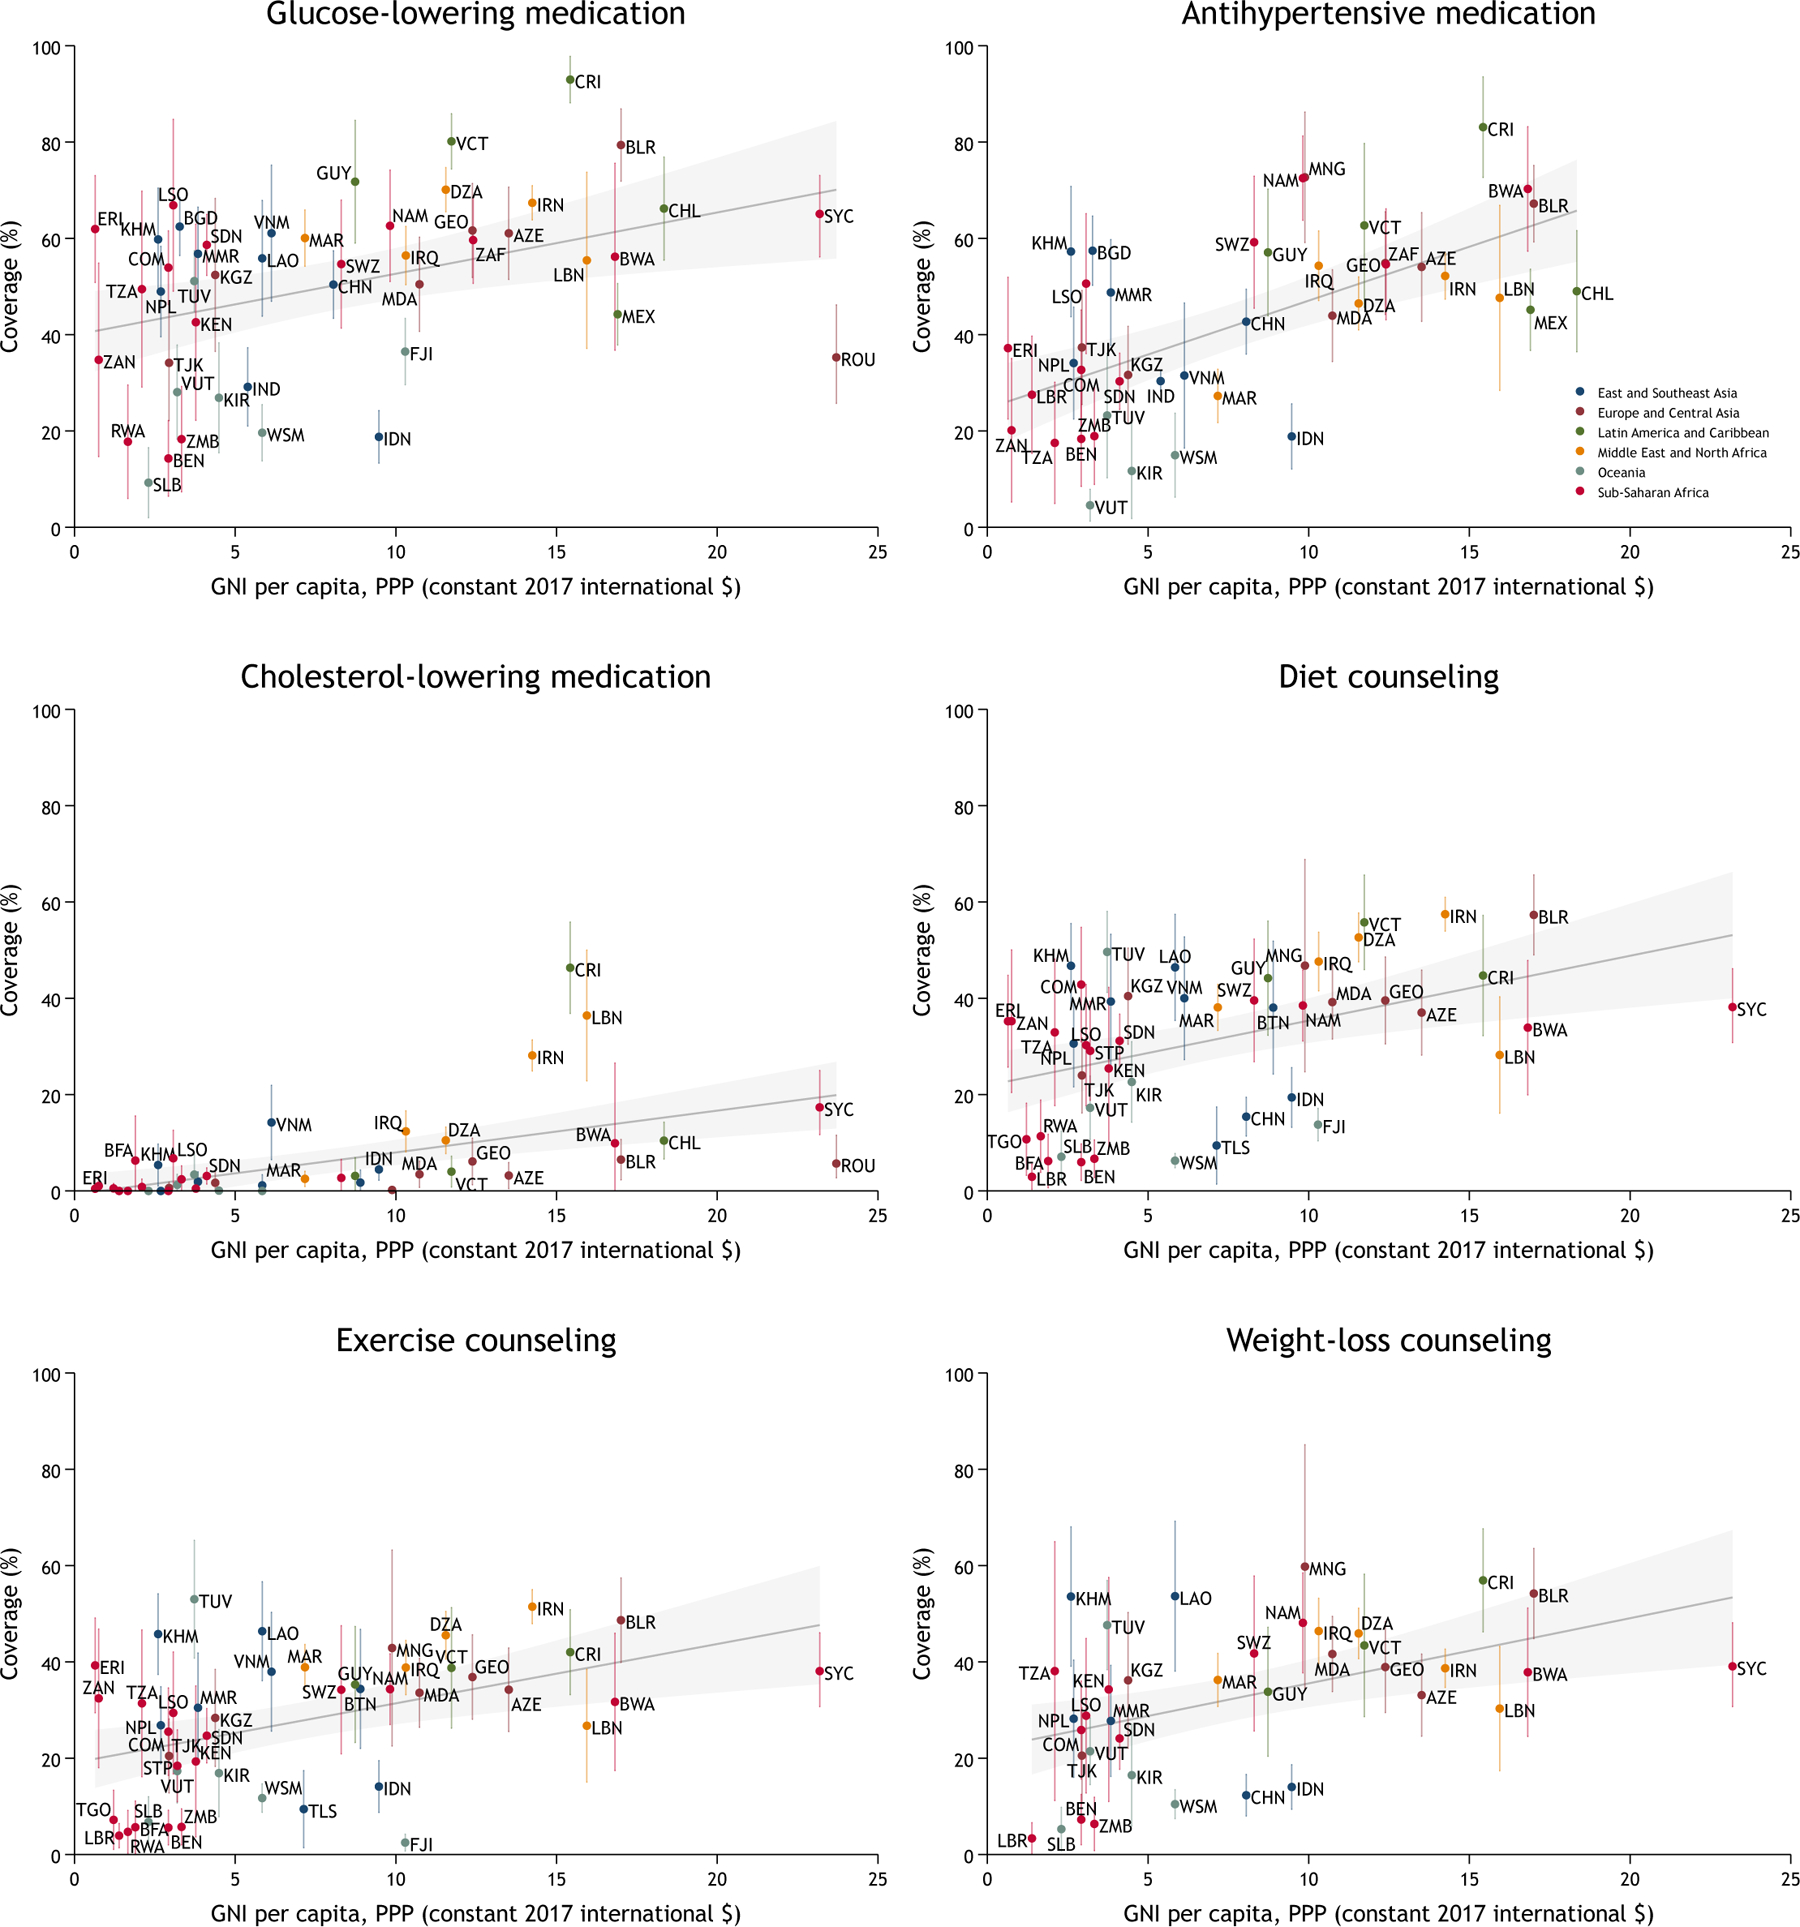
Methods: We conducted a cross-sectional analysis of pooled, individual data from 55 nationally representative surveys in LMICs. Our primary outcome of self-reported diabetes treatment coverage was based upon population-level monitoring indicators recommended in the 2020 World Health Organization Package of Essential Noncommunicable Disease Interventions. We assessed coverage of three pharmacological and three non-pharmacological treatments among people with diabetes. At the country level, we estimated the proportion of individuals reporting coverage by per-capita gross national income and geographic region. At the individual level, we used logistic regression models to assess coverage along several key individual characteristics including sex, age, BMI, wealth quintile, and educational attainment. In the primary analysis, we scaled sample weights such that countries were weighted equally.

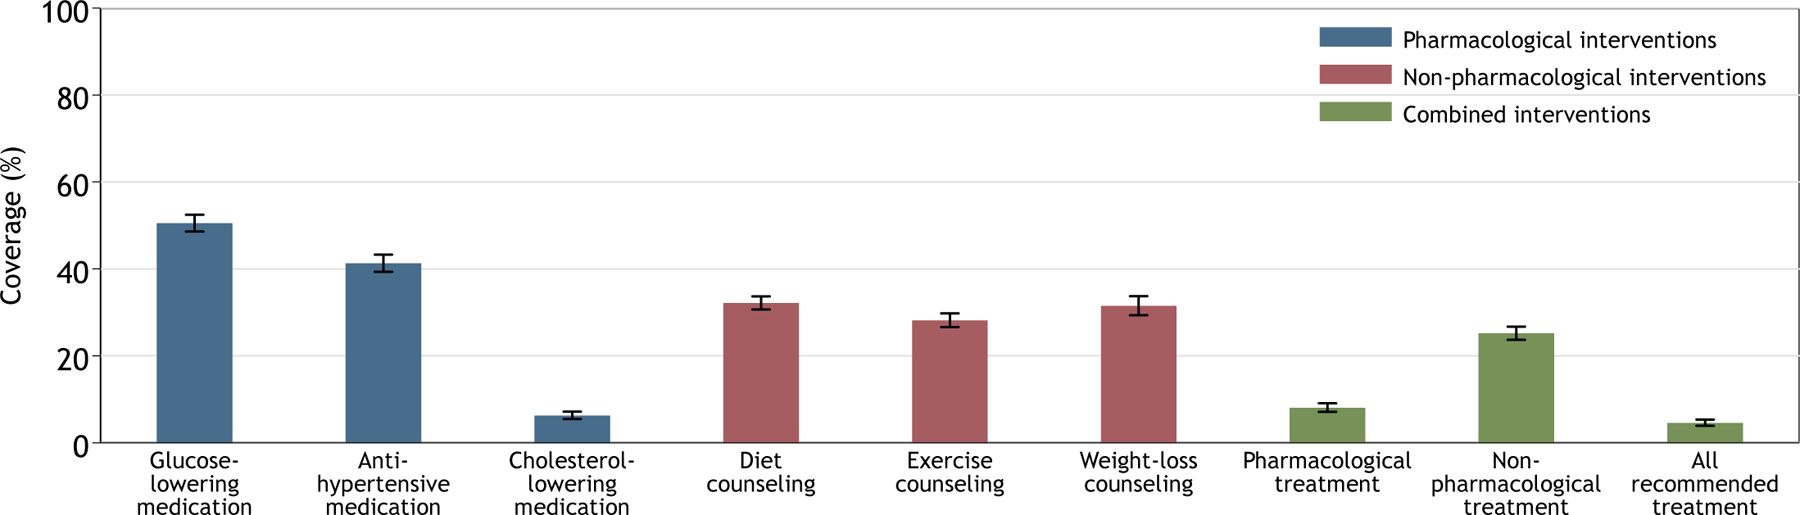
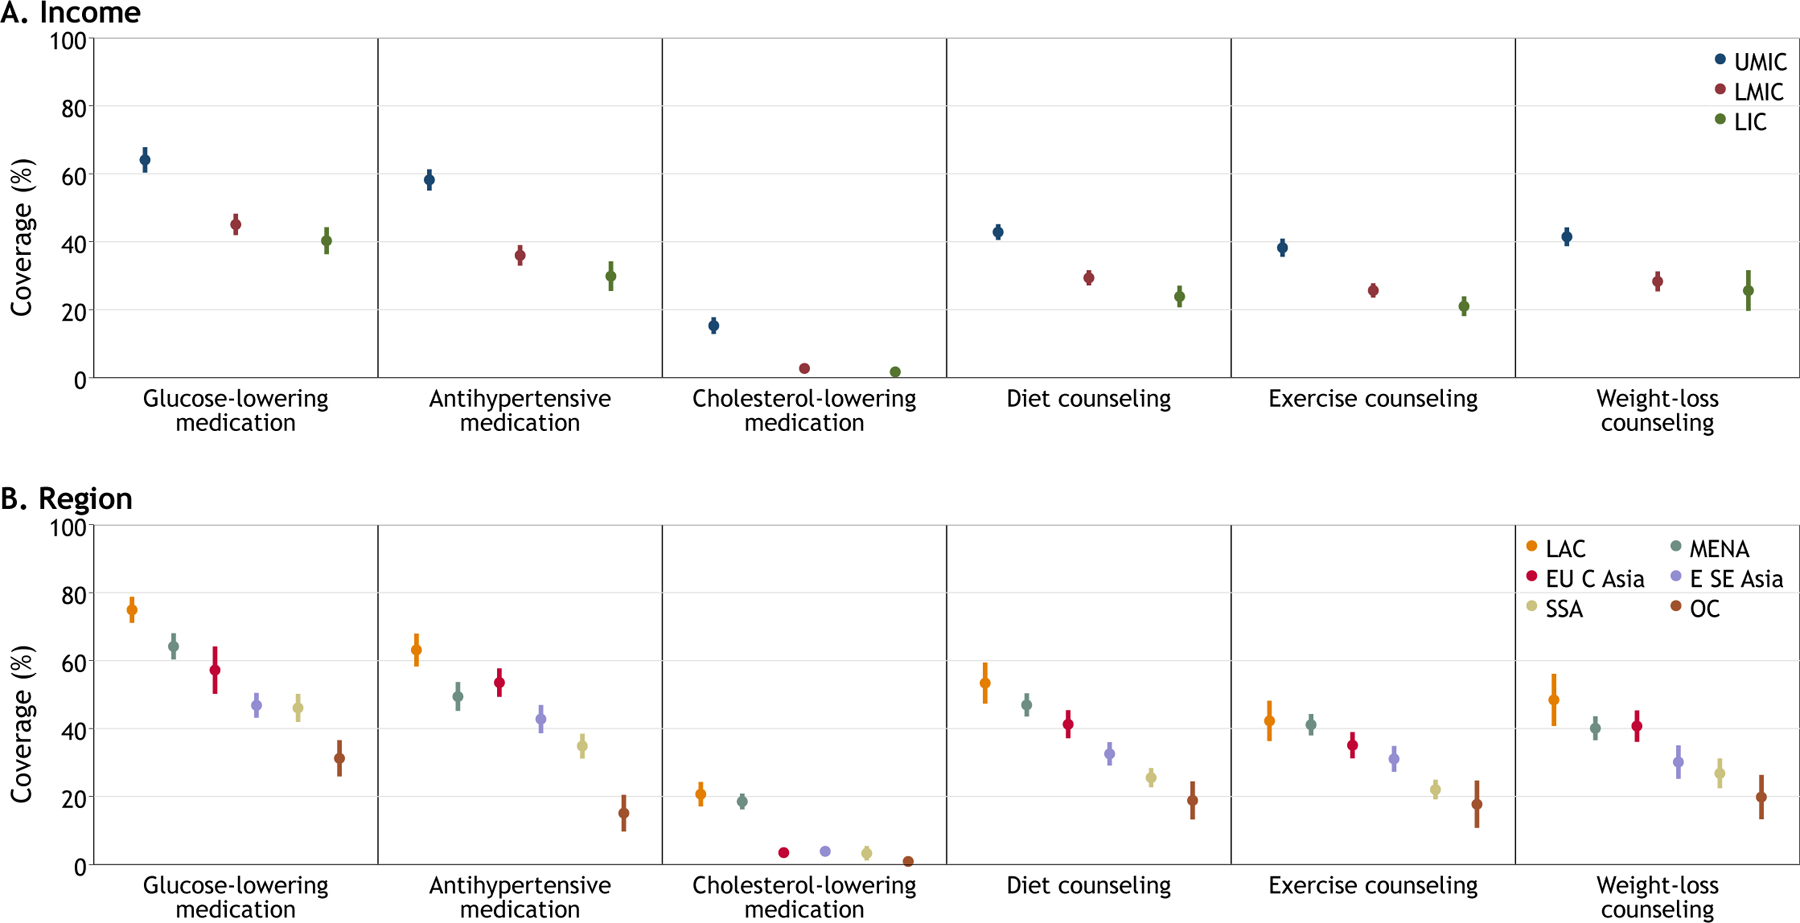
Findings: The final pooled sample from the 55 LMICs included 680,102 total individuals and 37,094 individuals with diabetes. Using equal weights for each country, diabetes prevalence was 9.0% (95% confidence interval [CI], 8.7-9.4), with 43.9% (95% CI, 41.9-45.9) reporting a prior diabetes diagnosis. Overall, 4.6% (95% CI, 3.9-5.4) of individuals with diabetes self-reported meeting need for all treatments recommended for them. Coverage of glucose-lowering medication was 50.5% (95% CI, 48.6-52.5); antihypertensive medication, 41.3% (95% CI, 39.3-43.3); cholesterol-lowering medication, 6.3% (95% CI, 5.5-7.2); diet counseling, 32.2% (95% CI, 30.7-33.7); exercise counseling, 28.2% (95% CI, 26.6-29.8); and weight-loss counseling, 31.5% (95% CI, 29.3-33.7). Countries at higher income levels tended to have greater coverage. Female sex and higher age, BMI, educational attainment, and household wealth were also associated with greater coverage.

Interpretation: Fewer than one in ten people with diabetes in LMICs receive coverage of guideline-based comprehensive diabetes treatment. Scaling-up the capacity of health systems to deliver treatment not only to lower glucose but also to address cardiovascular disease risk factors such as hypertension and high cholesterol are urgent global diabetes priorities.


Conflict of interest statement

Declaration of interests D.J.W. reports serving on a data-monitoring committee for Novo Nordisk.

Figures

Figure 1:
Figure 1:. Diabetes treatment coverage in 55 low- and middle-income countries.
This figure displays coverage, or the proportion of eligible individuals receiving diabetes treatment, in 55 low-and middle-income countries. Each treatment is a core recommendation for people with type 2 diabetes in the 2020 World Health Organization Package of Essential Noncommunicable Disease Interventions. For the combined interventions, the denominator was all individuals who needed coverage for at least one treatment within the category; the numerator was the number of individuals self-reporting coverage for all treatments indicated for that individual within the category. For example, if an individual was defined to need glucose-lowering medication but not antihypertensive or cholesterol-lowering medication, the individual would be classified as having coverage for the pharmacological treatments if they self-reported use of the glucose-lowering medication (i.e., one out of only one indicated treatment). Conversely, if an individual was defined to need both glucose-lowering therapy and antihypertensive therapy, the individuals would not be classified as having coverage for the pharmacological treatments if the individual only self-reported use of the glucose-lowering medication (i.e., one out of two indicated interventions). Estimates account for clustering at the country level and equal weights by country. Error bars indicate 95% confidence intervals.
Figure 2:
Figure 2:. Diabetes treatment coverage by country income group and geographic region.
Data are percent with 95% confidence intervals accounting for clustering at the country level and equal weights by country. Income categories represent the World Bank’s classification in the year the survey was conducted. Geographical regions were categorized according to the NCD Risk Factor Collaboration. E SE Asia=East and Southeast Asia. EU C Asia=Europe and Central Asia. LAC=Latin America and Caribbean. LIC=low-income country. LMIC=lower-middle-income country. MENA=Middle East and North Africa. OC=Oceania. SSA=Sub-Saharan Africa. UMIC=upper-middle-income country.
Figure 3:
Figure 3:. Diabetes treatment coverage by per capita gross national income among individuals 25–64 years of age.
The gray shaded area represents the 95% linear prediction interval. The vertical bars represent 95% CIs around point estimates for a given country. The estimates account for weighting and survey design. Only countries with at least 50 individuals are included in this plot; results for all countries are depicted in appendix p 68-70. Gross national income (GNI) per capita is in constant 2017 international dollars as calculated by the World Bank for the year in which the survey was conducted. For countries with unavailable GNI data in the survey year, we used per-capita gross domestic product in constant 2017 international dollars. For Eritrea, we used per-capita GDP at current prices in 2011. For Zanzibar, we used estimates using constant 2015 international dollars as published by the Office of the Chief Government Statistician of Zanzibar. Some labels in the cholesterol-lowering medication plot are omitted due to space limitations. AZE=Azerbaijan, BEN=Benin, BFA=Burkina Faso, BGD=Bangladesh, BLR=Belarus, BTN=Bhutan, BWA=Botswana, CHL=Chile, CHN=China, COM=Comoros, CRI=Costa Rica, DZA=Algeria, ERI=Eritrea, FJI=Fiji, GEO=Georgia, GUY=Guyana, IDN=Indonesia, IND=India, IRN=Iran, IRQ=Iraq, KEN=Kenya, KGZ=Kyrgyzstan, KHM=Cambodia, KIR=Kiribati, LAO=Laos, LBN=Lebanon, LBR=Liberia, LSO=Lesotho, MAR=Morocco, MDA=Moldova, MEX=Mexico, MMR=Myanmar, MNG=Mongolia, NAM=Namibia, NPL=Nepal, ROU=Romania, RWA=Rwanda, SDN=Sudan, SLB=Solomon Islands, STP=Sao Tome and Principe, SWZ=Eswatini, SYC=Seychelles, TGO=Togo, TJK=Tajikistan, TLS=Timor Leste, TUV=Tuvalu, TZA=Tanzania, UGA=Uganda, VCT=St. Vincent & the Grenadines, VNM=Vietnam, VUT=Vanuatu, WSM=Samoa, ZAF=South Africa, ZAN=Zanzibar, ZMB=Zambia.

Comment in

Similar articles

Cited by

References

    1. Murray CJL, Aravkin AY, Zheng P, et al. Global burden of 87 risk factors in 204 countries and territories, 1990–2019: a systematic analysis for the Global Burden of Disease Study 2019. The Lancet 2020; 396(10258): 1223–49. - PMC - PubMed
    1. International Diabetes Federation. IDF Diabetes Atlas, 9th edition: International Diabetes Federation, 2019.
    1. Anjana RM, Mohan V, Rangarajan S, et al. Contrasting Associations Between Diabetes and Cardiovascular Mortality Rates in Low-, Middle-, and High-Income Countries: Cohort Study Data From 143,567 Individuals in 21 Countries in the PURE Study. Diabetes Care 2020. - PMC - PubMed
    1. Kruk ME, Gage AD, Joseph NT, Danaei G, García-Saisó S, Salomon JA. Mortality due to low-quality health systems in the universal health coverage era: a systematic analysis of amenable deaths in 137 countries. The Lancet 2018; 392(10160): 2203–12. - PMC - PubMed
    1. NCD Countdown 2030: pathways to achieving Sustainable Development Goal target 3.4. The Lancet 2020; 396(10255): 918–34. - PMC - PubMed

Publication types

LinkOut - more resources