

Plasmodium falciparum parasite prevalence in East Africa: Updating data for malaria stratification
- PMID: 35211700
- PMCID: PMC7612417
- DOI: 10.1371/journal.pgph.0000014
Plasmodium falciparum parasite prevalence in East Africa: Updating data for malaria stratification
Abstract
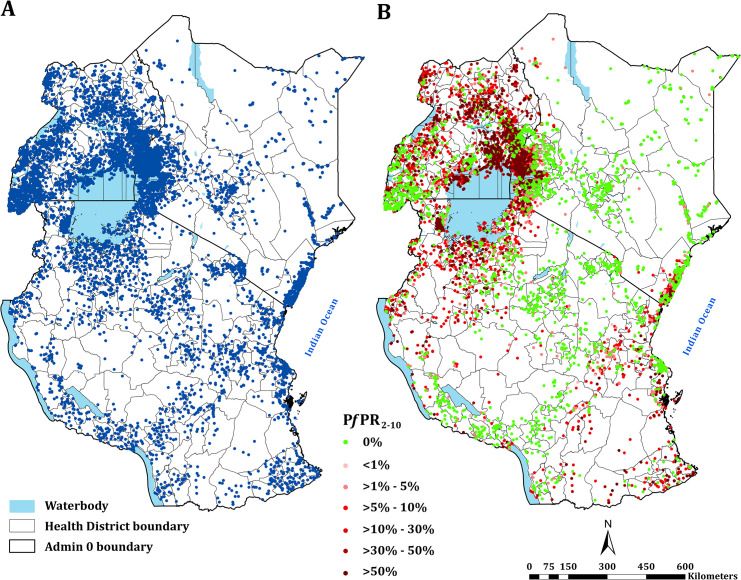
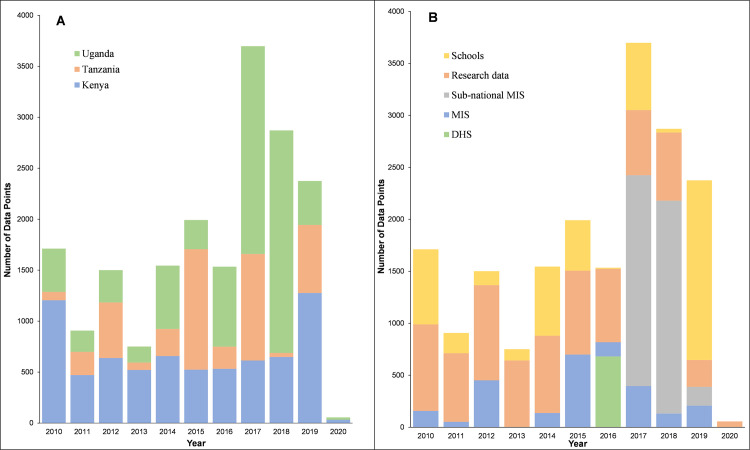
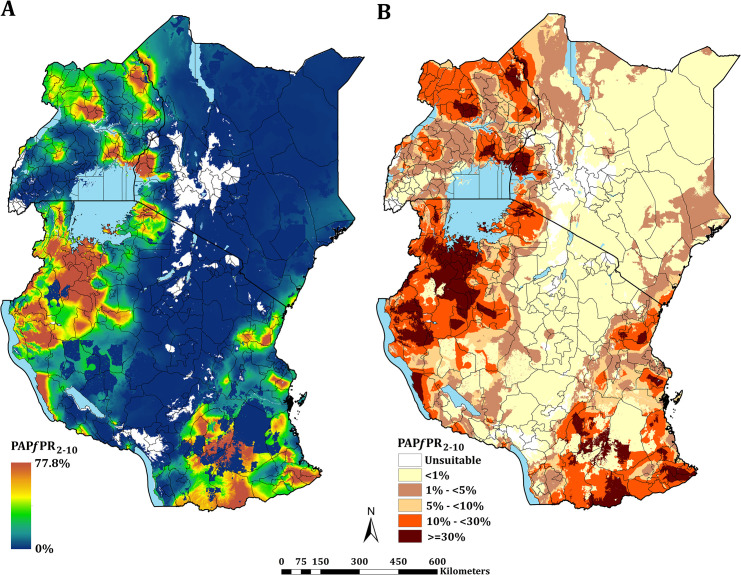
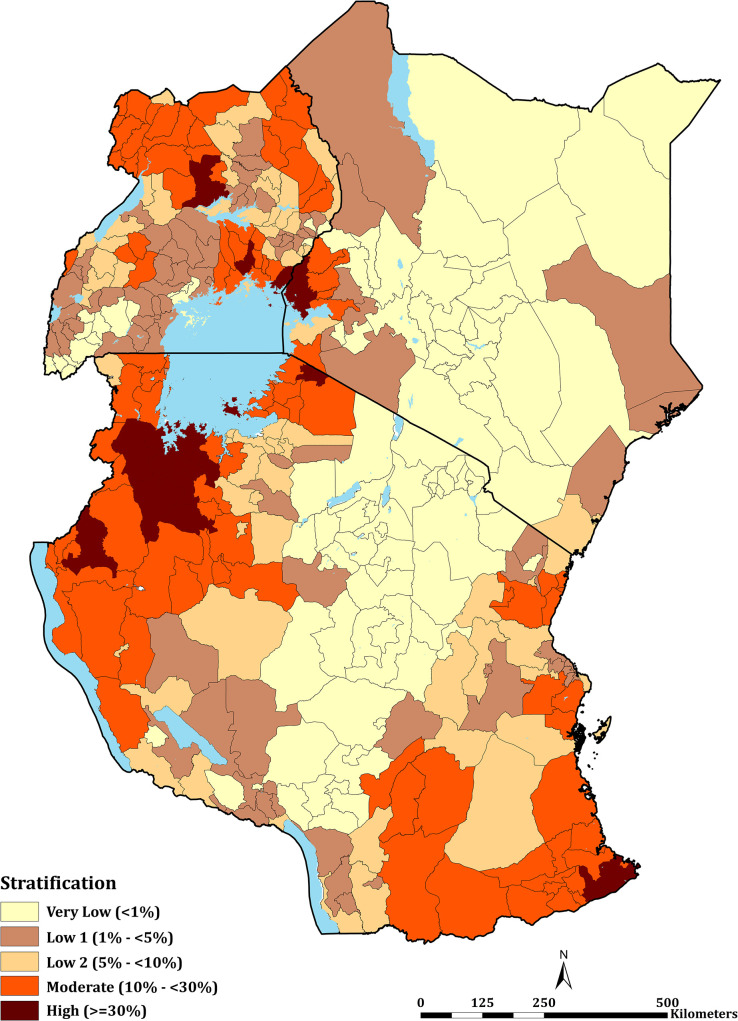
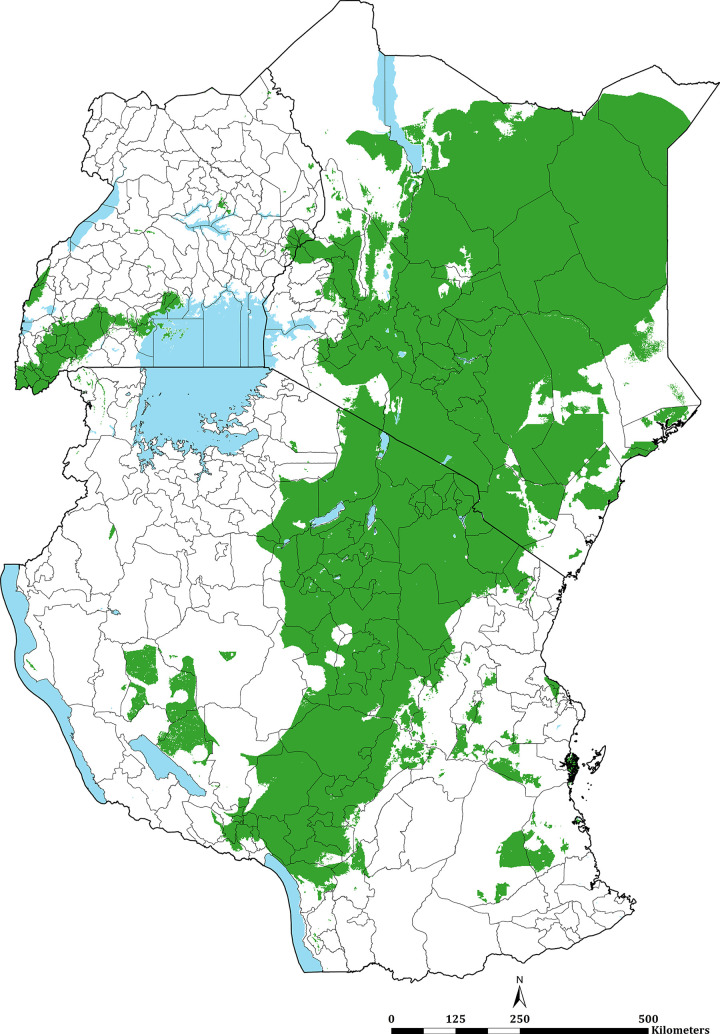
The High Burden High Impact (HBHI) strategy for malaria encourages countries to use multiple sources of available data to define the sub-national vulnerabilities to malaria risk, including parasite prevalence. Here, a modelled estimate of Plasmodium falciparum from an updated assembly of community parasite survey data in Kenya, mainland Tanzania, and Uganda is presented and used to provide a more contemporary understanding of the sub-national malaria prevalence stratification across the sub-region for 2019. Malaria prevalence data from surveys undertaken between January 2010 and June 2020 were assembled form each of the three countries. Bayesian spatiotemporal model-based approaches were used to interpolate space-time data at fine spatial resolution adjusting for population, environmental and ecological covariates across the three countries. A total of 18,940 time-space age-standardised and microscopy-converted surveys were assembled of which 14,170 (74.8%) were identified after 2017. The estimated national population-adjusted posterior mean parasite prevalence was 4.7% (95% Bayesian Credible Interval 2.6-36.9) in Kenya, 10.6% (3.4-39.2) in mainland Tanzania, and 9.5% (4.0-48.3) in Uganda. In 2019, more than 12.7 million people resided in communities where parasite prevalence was predicted ≥ 30%, including 6.4%, 12.1% and 6.3% of Kenya, mainland Tanzania and Uganda populations, respectively. Conversely, areas that supported very low parasite prevalence (<1%) were inhabited by approximately 46.2 million people across the sub-region, or 52.2%, 26.7% and 10.4% of Kenya, mainland Tanzania and Uganda populations, respectively. In conclusion, parasite prevalence represents one of several data metrics for disease stratification at national and sub-national levels. To increase the use of this metric for decision making, there is a need to integrate other data layers on mortality related to malaria, malaria vector composition, insecticide resistance and bionomic, malaria care-seeking behaviour and current levels of unmet need of malaria interventions.
Conflict of interest statement
Competing interests: All authors declare no competing interests
Figures
References
-
- World Health Organization. World malaria report 2020: 20 years of global progress and challenges. Geneva: WHO, 2020. 9240015795. Available from: https://apps.who.int/iris/bitstream/handle/10665/337660/9789240015791-en...
-
- World Health Organization, Roll Back Malaria. High burden to high impact: a targeted malaria response. Geneva: World Health Organization and RBM Partneship to End Malaria. 2018. Available from: http://apps.who.int/iris/bitstream/handle/10665/275868/WHO-CDS-GMP-2018....
-
- World Health Organization. WHO technical brief for countries preparing malaria funding requests for the Global Fund (2020–2022). Geneva: WHO, 2020. Available from: https://www.who.int/publications/i/item/9789240004139
Grants and funding
LinkOut - more resources
Full Text Sources