

Lewis acid protection turns cyanide containing [FeFe]-hydrogenase mimics into proton reduction catalysts
- PMID: 35212328
- PMCID: PMC8939051
- DOI: 10.1039/d1dt03896f
Lewis acid protection turns cyanide containing [FeFe]-hydrogenase mimics into proton reduction catalysts
Abstract
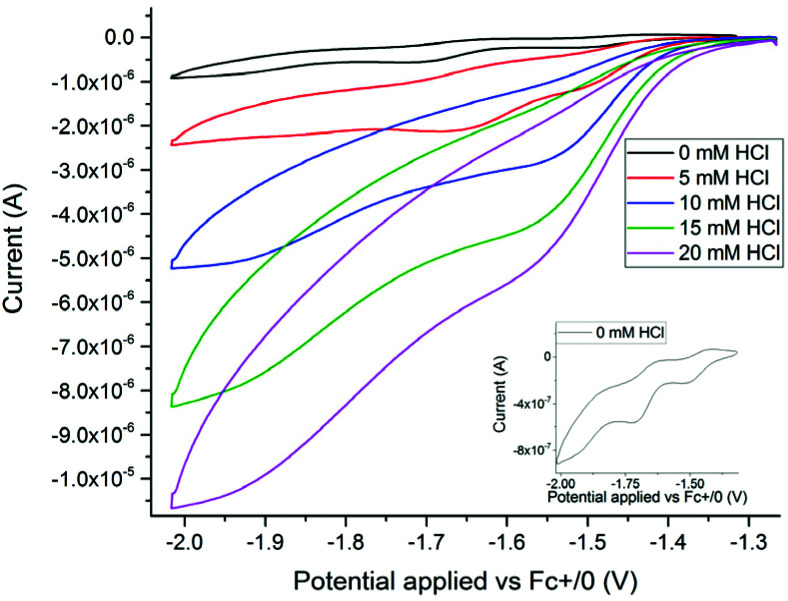
Sustainable sources of hydrogen are a vital component of the envisioned energy transition. Understanding and mimicking the [FeFe]-hydrogenase provides a route to achieving this goal. In this study we re-visit a molecular mimic of the hydrogenase, the propyl dithiolate bridged complex [Fe2(μ-pdt)(CO)4(CN)2]2-, in which the cyanide ligands are tuned via Lewis acid interactions. This system provides a rare example of a cyanide containing [FeFe]-hydrogenase mimic capable of catalytic proton reduction, as demonstrated by cyclic voltammetry. EPR, FTIR, UV-vis and X-ray absorption spectroscopy are employed to characterize the species produced by protonation, and reduction or oxidation of the complex. The results reveal that biologically relevant iron-oxidation states can be generated, potentially including short-lived mixed valent Fe(I)Fe(II) species. We propose that catalysis is initiated by protonation of the diiron complex and the resulting di-ferrous bridging hydride species can subsequently follow two different pathways to promote H2 gas formation depending on the applied reduction potential.
Conflict of interest statement
There are no conflicts to declare.
Figures


Similar articles
-
The Molecular Proceedings of Biological Hydrogen Turnover.Acc Chem Res. 2018 Aug 21;51(8):1755-1763. doi: 10.1021/acs.accounts.8b00109. Epub 2018 Jul 12. Acc Chem Res. 2018. PMID: 30001117
-
Diiron azadithiolates as models for the [FeFe]-hydrogenase active site and paradigm for the role of the second coordination sphere.Acc Chem Res. 2015 Jul 21;48(7):2107-16. doi: 10.1021/acs.accounts.5b00177. Epub 2015 Jun 16. Acc Chem Res. 2015. PMID: 26079848 Free PMC article.
-
Proton Transfer Mechanisms in Bimetallic Hydrogenases.Acc Chem Res. 2021 Jan 5;54(1):232-241. doi: 10.1021/acs.accounts.0c00651. Epub 2020 Dec 16. Acc Chem Res. 2021. PMID: 33326230
-
Modeling the active sites in metalloenzymes. 3. Density functional calculations on models for [Fe]-hydrogenase: structures and vibrational frequencies of the observed redox forms and the reaction mechanism at the Diiron Active Center.J Am Chem Soc. 2001 Apr 25;123(16):3734-42. doi: 10.1021/ja000116v. J Am Chem Soc. 2001. PMID: 11457105
-
Approaches to efficient molecular catalyst systems for photochemical H2 production using [FeFe]-hydrogenase active site mimics.Dalton Trans. 2011 Dec 28;40(48):12793-800. doi: 10.1039/c1dt11166c. Epub 2011 Oct 10. Dalton Trans. 2011. PMID: 21983599 Review.
Cited by
-
Facile electrocatalytic proton reduction by a [Fe-Fe]-hydrogenase bio-inspired synthetic model bearing a terminal CN- ligand.Chem Sci. 2024 Jan 1;15(6):2167-2180. doi: 10.1039/d3sc05397k. eCollection 2024 Feb 7. Chem Sci. 2024. PMID: 38332837 Free PMC article.
-
Fully Oxidized State of the Oxygen-Tolerant [NiFe] Hydrogenase from Hydrogenophilus thermoluteolus SH: A Quantum Mechanics Cluster and Quantum Mechanics/Molecular Mechanics Study.Inorg Chem. 2025 May 19;64(19):9558-9570. doi: 10.1021/acs.inorgchem.5c00503. Epub 2025 May 7. Inorg Chem. 2025. PMID: 40334073 Free PMC article.
-
Probing Substrate Transport Effects on Enzymatic Hydrogen Catalysis: An Alternative Proton Transfer Pathway in Putatively Sensory [FeFe] Hydrogenase.ACS Catal. 2023 Jul 26;13(15):10435-10446. doi: 10.1021/acscatal.3c02314. eCollection 2023 Aug 4. ACS Catal. 2023. PMID: 37560193 Free PMC article.
References
-
- Land H. Senger M. Berggren G. Stripp S. T. ACS Catal. 2020;10:7069–7086. doi: 10.1021/acscatal.0c01614. - DOI
LinkOut - more resources
Full Text Sources
Research Materials