

Characterisation of the Circulating Transcriptomic Landscape in Inflammatory Bowel Disease Provides Evidence for Dysregulation of Multiple Transcription Factors Including NFE2, SPI1, CEBPB, and IRF2
- PMID: 35212366
- PMCID: PMC9426667
- DOI: 10.1093/ecco-jcc/jjac033
Characterisation of the Circulating Transcriptomic Landscape in Inflammatory Bowel Disease Provides Evidence for Dysregulation of Multiple Transcription Factors Including NFE2, SPI1, CEBPB, and IRF2
Abstract
Aim: To assess the pathobiological and translational importance of whole-blood transcriptomic analysis in inflammatory bowel disease [IBD].
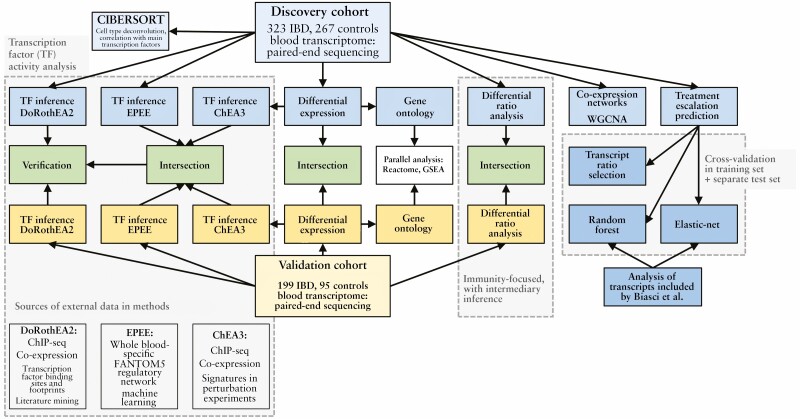
Methods: We analysed whole-blood expression profiles from paired-end sequencing in a discovery cohort of 590 Europeans recruited across six countries in the IBD Character initiative (newly diagnosed patients with Crohn's disease [CD; n = 156], ulcerative colitis [UC; n = 167], and controls [n = 267]), exploring differential expression [DESeq2], co-expression networks [WGCNA], and transcription factor involvement [EPEE, ChEA, DoRothEA]. Findings were validated by analysis of an independent replication cohort [99 CD, 100 UC, 95 controls]. In the discovery cohort, we also defined baseline expression correlates of future treatment escalation using cross-validated elastic-net and random forest modelling, along with a pragmatic ratio detection procedure.
Results: Disease-specific transcriptomes were defined in IBD [8697 transcripts], CD [7152], and UC [8521], with the most highly significant changes in single genes, including CD177 (log2-fold change [LFC] = 4.63, p = 4.05 × 10-118), MCEMP1 [LFC = 2.45, p = 7.37 × 10-109], and S100A12 [LFC = 2.31, p = 2.15 × 10-93]. Significantly over-represented pathways included IL-1 [p = 1.58 × 10⁻¹¹], IL-4, and IL-13 [p = 8.96 × 10⁻⁹]. Highly concordant results were obtained using multiple regulatory activity inference tools applied to the discovery and replication cohorts. These analyses demonstrated central roles in IBD for the transcription factors NFE2, SPI1 [PU.1], CEBPB, and IRF2, all regulators of cytokine signalling, based on a consistent signal across cohorts and transcription factor ranking methods. A number of simple transcriptome-based models were associated with the need for treatment escalation, including the binary CLEC5A/CDH2 expression ratio in UC (hazard ratio = 23.4, 95% confidence interval [CI] 5.3-102.0).
Conclusions: Transcriptomic analysis has allowed for a detailed characterisation of IBD pathobiology, with important potential translational implications.
Keywords: Crohn’s disease; Inflammatory bowel disease; transcription factor; transcriptome; ulcerative colitis.
© The Author(s) 2022. Published by Oxford University Press on behalf of European Crohn’s and Colitis Organisation.
Figures


References
-
- Ng SC, Shi HY, Hamidi N, et al. Worldwide incidence and prevalence of inflammatory bowel disease in the 21st century: a systematic review of population-based studies. Lancet 2018;390:2769–78. - PubMed
-
- Sandborn WJ, Su C, Sands BE, et al. ; OCTAVE Induction 1, OCTAVE Induction 2, and OCTAVE Sustain Investigators. Tofacitinib as induction and maintenance therapy for ulcerative colitis. N Engl J Med 2017;376:1723–36. - PubMed
-
- Sands BE, Sandborn WJ, Panaccione R, et al. ; UNIFI Study Group. Ustekinumab as induction and maintenance therapy for ulcerative colitis. N Engl J Med 2019;381:1201–14. - PubMed
MeSH terms
Substances
Grants and funding
LinkOut - more resources
Full Text Sources
Medical
Research Materials
Miscellaneous
