. 2022 Jun 24;50(11):e63.
doi: 10.1093/nar/gkac134.

Single-cell genome-wide concurrent haplotyping and copy-number profiling through genotyping-by-sequencing

Affiliations

Single-cell genome-wide concurrent haplotyping and copy-number profiling through genotyping-by-sequencing

Heleen Masset et al. Nucleic Acids Res. .

Erratum in

Abstract

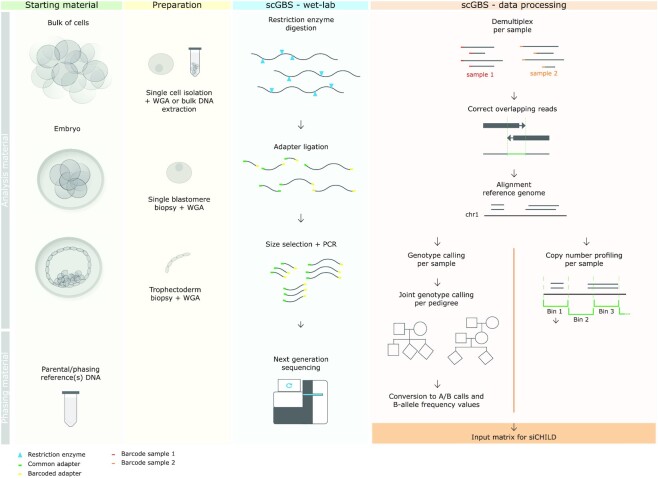
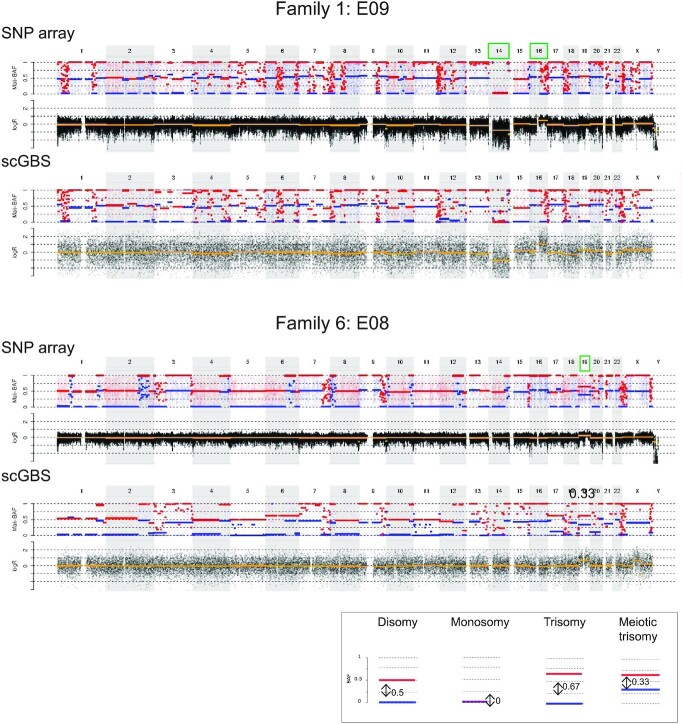
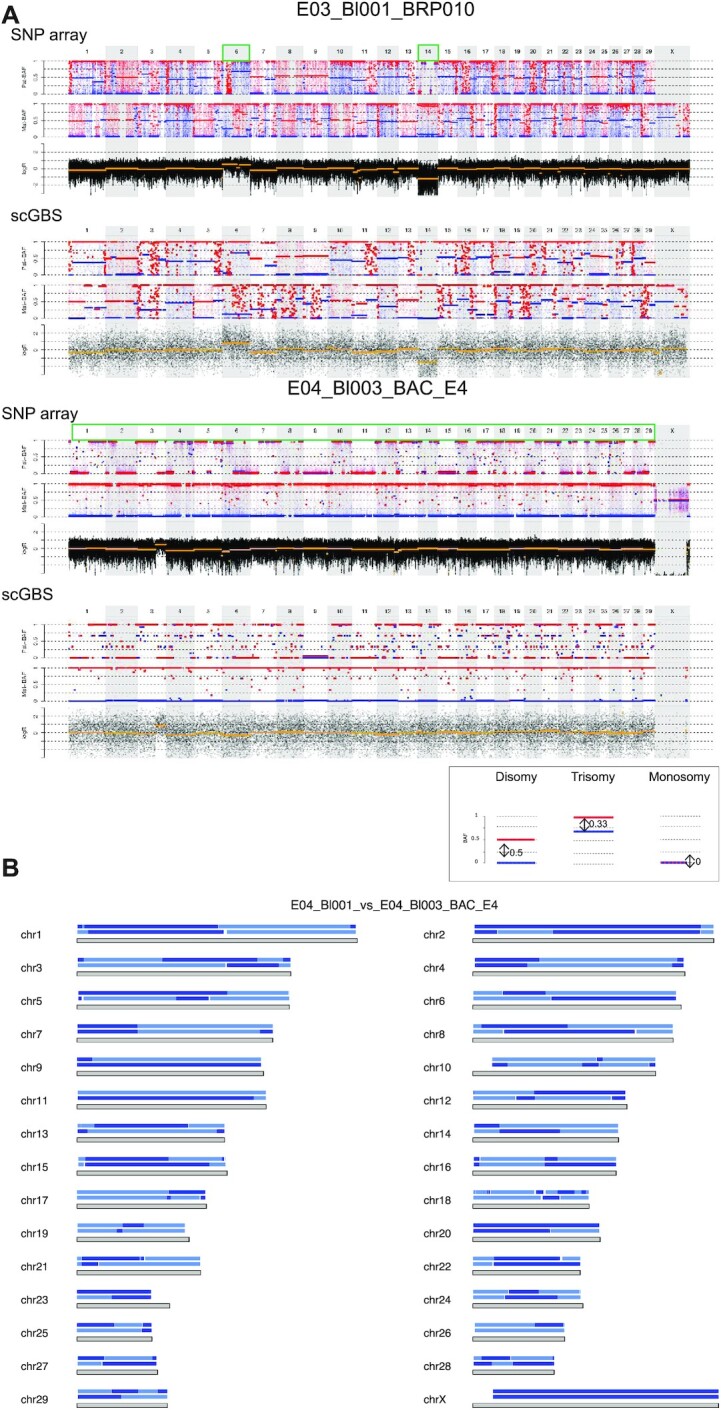
Single-cell whole-genome haplotyping allows simultaneous detection of haplotypes associated with monogenic diseases, chromosome copy-numbering and subsequently, has revealed mosaicism in embryos and embryonic stem cells. Methods, such as karyomapping and haplarithmisis, were deployed as a generic and genome-wide approach for preimplantation genetic testing (PGT) and are replacing traditional PGT methods. While current methods primarily rely on single-nucleotide polymorphism (SNP) array, we envision sequencing-based methods to become more accessible and cost-efficient. Here, we developed a novel sequencing-based methodology to haplotype and copy-number profile single cells. Following DNA amplification, genomic size and complexity is reduced through restriction enzyme digestion and DNA is genotyped through sequencing. This single-cell genotyping-by-sequencing (scGBS) is the input for haplarithmisis, an algorithm we previously developed for SNP array-based single-cell haplotyping. We established technical parameters and developed an analysis pipeline enabling accurate concurrent haplotyping and copy-number profiling of single cells. We demonstrate its value in human blastomere and trophectoderm samples as application for PGT for monogenic disorders. Furthermore, we demonstrate the method to work in other species through analyzing blastomeres of bovine embryos. Our scGBS method opens up the path for single-cell haplotyping of any species with diploid genomes and could make its way into the clinic as a PGT application.


Figures

Figure 1.
Figure 1.
scGBS can be performed on DNA extracted from multiple cells, e.g. a cell line, or single cells, e.g. from embryos samples. Parental DNA and DNA from family members, such as grandparents or siblings, with respect to the analysis sample(s), is used for haplotyping. Preparation for scGBS consists of isolation of a single cell or multiple cells followed by a whole genome amplification (WGA) by multiple displacement amplification (MDA). Subsequently, the amplified genomic DNA is digested by a restriction enzyme followed by adapter ligation, size selection and a PCR. Multiplexing of samples is performed after adapter ligation. Processing of scGBS data consists of demultiplexing raw sequencing reads per sample, correction of overlapping reads by FLASH (40) and alignment of the corrected reads to the reference genome with BWA MEM (42). Next, GATK Haplotypecaller is applied to each sample separately and GATK GenotypeGVCFS allows for joint genotype calling per pedigree with samples to analyze combined with parental and phasing reference samples (43). A customized conversion is applied to obtain the desired input for siCHILD analysis such as A/B calling and B-allele frequency (BAF). In parallel, after the alignment step a copy-number profiling is performed per sample with QDNAseq (46). Finally, discrete genotypes, BAF and logR values are combined into one input matrix for siCHILD analysis.
Figure 2.
Figure 2.
scGBS haplotyping and copy-number profiling on HapMap cell lines. (A) Genotypes from joint genotyping individuals GM12877 (father) and GM12878 (mother) were compared to heterozygote SNV calls from the Platinum Genomes (Illumina Inc., USA) and both accuracy (blue line = mean ± standard deviation) and the total number (red line = mean ± standard deviation) of the genotypes were evaluated against the minimum coverage of the genotype calls in order to select a coverage threshold. The gray line represents the coverage of 7×, which was applied as a threshold to bulk samples in subsequent analyses. (B) Genotypes from single cells of siblings GM12882 and GM12887 were compared to heterozygote SNV calls from its respective bulk sample with a threshold applied of 7× coverage. The accuracy (blue line = mean ± standard deviation) and the total number (red line = mean ± standard deviation) of the calls were evaluated against the minimum coverage of the genotype calls. The gray line represents the coverage of 11×, which was applied as a threshold to single-cell samples in subsequent analyses. (C) For each chromosome an ideogram together with the haplotype blocks after SNP array (top) and scGBS (bottom) is shown. Dark and light blue represent paternal haplotyping, whereas red and light red represent maternal haplotyping. Transition from dark to light color or vice versa represents an homologous recombination site. Genome-wide haplotype block comparison of scGBS- and SNP-array-based haplotyping results for a single blastomere biopsy sample from GM12882 from the HapMap pedigree (GM12882_sc37) are shown. Phasing occurred via sibling GM12887, which results in the availability of both maternal and paternal haplotypes. (D) An example of the genome-wide comparison between scGBS- and SNP-array-based copy-number profiling is shown for two samples from the HapMap pedigree; one bulk (GM12887_MC) and one single-cell (GM12887_sc04). Both genome-wide maternal and paternal haplarithm (Mat-BAF and Pat-BAF tracks) plots together with a copy-number values (logR track) plot for chromosome 1 to X are displayed. Haplarithm plots serve as the visualization of the haplotyping process by haplarithmisis (Supplementary Figure S1). Haplotyping was performed with a sibling (GM12882) and thus, both maternal and paternal haplarithm can be displayed. For the first sample (GM12887_MC), interpretation of the logR profile identified a mosaic paternal trisomy for chromosome X (green box), which was not reported in the karyotype of the cell line. In the single-cell sample, GM12887_sc04, the pure trisomy for chromosome X is present. Copy-number analysis with a combination of haplarithm and logR profiles allows to specify parental origin for the aberrations. In case of disomic chromosomes, red and blue lines for maternal and/or paternal haplarithms are spaced with a distance of 0.5 apart (see legend bottom right). The pure paternal trisomy X in the single cell is indicated indirectly by the increased distance (= 0.67) between the maternal red and blue lines, which represents a lower fraction of maternal compared to paternal chromosomes. Here, the presence of a paternal trisomy for chromosome X in a mosaic state is indicated by a distance of <0.67 between the red and blue lines of the maternal haplarithm. These findings show concordant between scGBS and SNP array.
Figure 3.
Figure 3.
Haplotyping results of the disease loci associated chromosome are shown after scGBS and SNP array processing of the sample. Samples represent a single blastomere biopsied from a day 3 embryo for all except in (D), which represents a trophectoderm biopsy (on average 5 cells from a day-5 blastocyst). Each subfigure consists of a family pedigree with haplotype inheritance information and the haplotyping result (haplotype blocks) of one or two embryos per family. The embryo number is indicated in green or red for a haplotyping analysis result which deemed the embryo eligible or not for transfer, respectively. Haplotype blocks with blue or red coloring are shown for each embryo and methodology (scGBS versus SNP array) and indicate paternal or maternal haplotype inheritance, respectively. Additionally, in (B) a maternal haplarithm, i.e. segmented maternal BAF values track, is shown under the haplotype block. From this haplarithm track, besides the haplotype blocks, also the number of copies per haplotype block can be deduced. In this specific track, the red dotted line shows segmented values of the M1 SNPs and the blue dotted line represents segmented values of M2 SNPs, each a distinct category of maternal SNPs. The distance between the two categories should be 0.5 for a chromosome in a disomic state (1 maternal and 1 paternal) and 0 for the inheritance of only one chromosome (monosomy). The locus of interest is indicated by an orange dashed line corresponding to the position along the chromosome ideogram. (A) Autosomal dominant inheritance linked to the (grand)maternal haplotype. Embryo 1 (E01) inherited the grandpaternal haplotype (red) and is unaffected for the monogenic disorder. Embryo 2 (E02) inherited the grandmaternal haplotype (pink) and is affected for the monogenic disorder. (B) X-linked recessive mutation inheritance linked to the (grand)maternal haplotype of the X-chromosome. Both mother and grandmother of the embryos are a carrier for this mutation. Embryo 1 (E01) inherited the grandmaternal haplotype (pink). Information from the maternal haplarithm shows chrX to be present in a disomic state and hence, an unaffected chrX is inherited from the father of the embryo resulting E01 to be a carrier female. Embryo 2 (E02) inherited the grandmaternal haplotype (pink). The maternal haplarithm profile shows only one chrX to be present and hence, no additional chrX is inherited from the father, but a Y-chromosome instead (not shown). Therefore, E02 results in an affected male. (C) Autosomal recessive inheritance linked to the maternal and paternal haplotypes carried by the affected sibling. Embryo 8 (E08) inherited the same paternal haplotype as the sibling (blue) and consequently the paternal mutation. The maternal haplotype is flanked by a homologous recombination site, which is too close to the locus of interest (orange dashed line) to allow distinguishing inheritance of the same or opposite haplotype compared to the sibling. Hence, haplotyping results for E08 are found inconclusive. Embryo 10 (E10) inherited the same paternal haplotype (blue) as the sibling and the opposite for the maternal haplotype (pink). E10 is thus an unaffected carrier of the paternal mutation. (D) Autosomal dominant inheritance linked to the maternal (grandpaternal) haplotype in red. Embryo 4 (E04) inherited the grandmaternal haplotype (pink) and hence, is unaffected for the monogenic disorder.
Figure 4.
Figure 4.
For each chromosome an ideogram together with the haplotype blocks after SNP array (top) and scGBS (bottom) is shown. Dark and light blue represent paternal haplotyping, whereas red and light red represent maternal haplotyping. Transition from dark to light color or vice versa represents an homologous recombination site. (A) Genome-wide haplotype block comparison of scGBS- and SNP array-based haplotyping results for a single blastomere biopsy sample from family 4. Phasing occurred via an affected sibling, which results in the availability of both maternal and paternal haplotypes. (B) Genome-wide haplotype block comparison of scGBS- and SNP array-based haplotyping results for a trophectoderm biopsy sample from family 5. Phasing occurred via maternal grandparents, hence only maternal haplotypes are drawn.
Figure 5.
Figure 5.
An example of the genome-wide comparison between scGBS- and SNP-array-based copy-number profiling is shown for two embryo biopsies from two families. Only the genome-wide maternal haplarithm (Mat-BAF) track together with a copy-number values (logR) track are displayed both for SNP array and scGBS data. A legend is provided in the bottom right of the displayed haplarithm profiles in case of disomy and/or deviations from the disomic state from the maternal information according to the principles of haplarithmisis in Figure S1. In both families haplotyping was performed with maternal grandparents and thus, only the maternal haplarithm can be displayed. For the first embryo biopsy (E09 of family 1), interpretation of the logR profile identified a monosomy for chromosome 14 and a segmental trisomy for chromosome 16. In the second embryo biopsy, embryo 8 of family 2, a single trisomy for chromosome 19 is present. Copy-number analysis with a combination of haplarithm and logR profiles allows to specify parental origin for the aberrations. In case of disomic chromosomes, red and blue lines for maternal and/or paternal haplarithms are spaced with a distance of 0.5 apart. Here, in the first embryo, the presence of a maternal monosomy for chromosome 14 (only the maternal copy is remaining) is indicated by a distance of 0 between the red and blue lines of the maternal haplarithm. The segmental trisomy for chromosome 16 is of paternal origin, which is indicated indirectly by the increased distance (= 0.67) between the maternal red and blue lines, which represents a lower fraction of maternal compared to paternal chromosomes. For the second embryo, a meiotic maternal trisomy can be elucidated, since a decreased distance of 0.33 on the maternal haplarithm can be seen. The red and blue lines are centered around 0.5, which indicates the presence of two different haplotypes along the chromosome and hence, corresponds with a meiosis I error. The aberrations were concordant between scGBS and SNP array.
Figure 6.
Figure 6.
scGBS applied to bovine single blastomeres. Examples of haplotyping and copy-number profiling results from bovine single blastomeres are shown. (A) For each chromosome the length is characterized by a grey block with the haplotype blocks of E04_Bl001 (top) and E04_Bl003 (bottom) from family BAC_E4 is shown. Dark and light blue represent paternal haplotyping. Transition from dark to light color or vice versa represents an homologous recombination site. Genome-wide paternal haplotype block comparison of the two single blastomeres from the same embryo reveals multiple different homologous recombination sites indicating two differential paternal genomes present in the same embryo. (B) Genome-wide comparison between scGBS- and SNP array-based haplotype and copy-number profiling is shown for two bovine embryo biopsies from two families. The genome-wide maternal and paternal haplarithm (Mat-BAF and Pat-BAF, respectively) tracks together with a copy-number values (logR) track are displayed. In both families haplotyping was performed with a sibling embryo, which results in the display of both maternal and paternal haplarithm. A legend is present below the figure to highlight a disomic profile and the specific haplarithm profile for the parent-specific aberration. In case of disomic chromosomes, red and blue lines for maternal and/or paternal haplarithms are spaced with a distance of 0.5 apart. In E03_Bl001_BRP010, comprehensive analysis by using haplotyping and copy-number profiling results in the detection two single aneuploidies, i.e. a paternal trisomy of chromosome 6 (distance Pat-BAF = 0.33 and Mat-BAF = 0.67) and a paternal monosomy for chromosome 14 (distance Pat-BAF = 0 and Mat-BAF = 1). In a second example, a single blastomere from a separate embryo, E04_Bl003_BAC_E4, combined analysis of haplotyping and logR results in the identification of only paternal chromosomes genome-wide, with a segmental gain for chromosome 3. Analysis of logR profile alone would have resulted in the interpretation of a segmental trisomy for chromosome 3. However, the distance of the red and blue lines on the Pat-BAF profile is 0 (Pat-BAF) and 1 for the Mat-BAF profile reveals the more complex genomic constitution of the single blastomere.

References

    1. Navin N., Kendall J., Troge J., Andrews P., Rodgers L., McIndoo J., Cook K., Stepansky A., Levy D., Esposito D.et al. .. Tumour evolution inferred by single-cell sequencing. Nature. 2011; 472:90–94. - PMC - PubMed
    1. Voet T., Kumar P., Van Loo P., Cooke S.L., Marshall J., Lin M.-L., Zamani Esteki M., Van der Aa N., Mateiu L., McBride D.J.et al. .. Single-cell paired-end genome sequencing reveals structural variation per cell cycle. Nucleic Acids Res. 2013; 41:6119–6138. - PMC - PubMed
    1. Chen X., Love J.C., Navin N.E., Pachter L, Stubbington M.J.T., Svensson V., Sweedler J.V., Teichmann S.A.. Single-cell analysis at the threshold. Nat. Biotechnol. 2016; 34:1111–1118. - PubMed
    1. Vermeesch J.R., Voet T., Devriendt K.. Prenatal and pre-implantation genetic diagnosis. Nat. Rev. Genet. 2016; 17:643–656. - PubMed
    1. Natesan S.A., Bladon A.J., Coskun S., Qubbaj W., Prates R., Munne S., Coonen E., Dreesen J.C.F.M., Stevens S.J.C., Paulussen A.D.C.et al. .. Genome-wide karyomapping accurately identifies the inheritance of single-gene defects in human preimplantation embryos in vitro. Genet. Med. 2014; 16:838–845. - PMC - PubMed

Publication types