. 2022 Feb 25:11:e71994.
doi: 10.7554/eLife.71994.

Signature-scoring methods developed for bulk samples are not adequate for cancer single-cell RNA sequencing data

Affiliations

Signature-scoring methods developed for bulk samples are not adequate for cancer single-cell RNA sequencing data

Nighat Noureen et al. Elife. .

Abstract

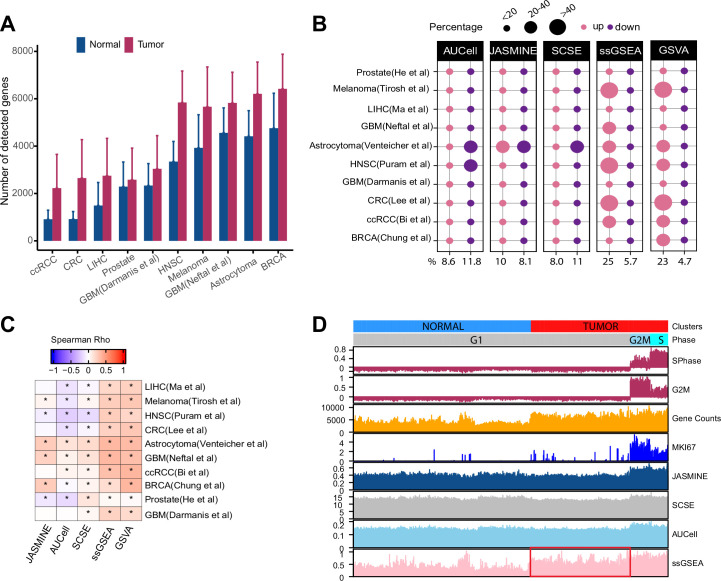
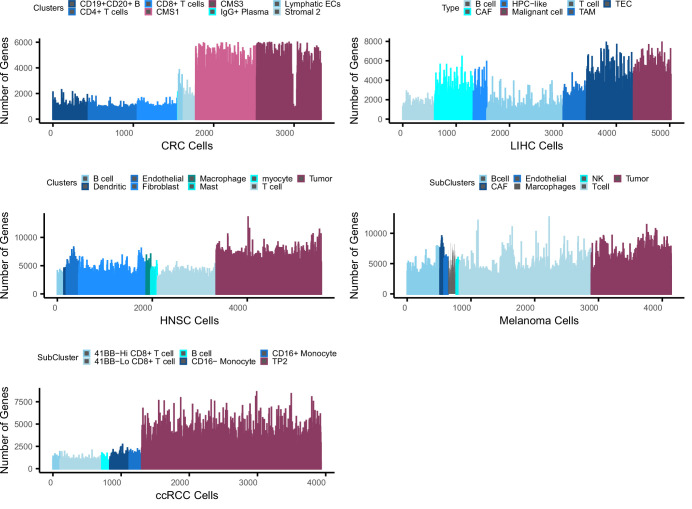
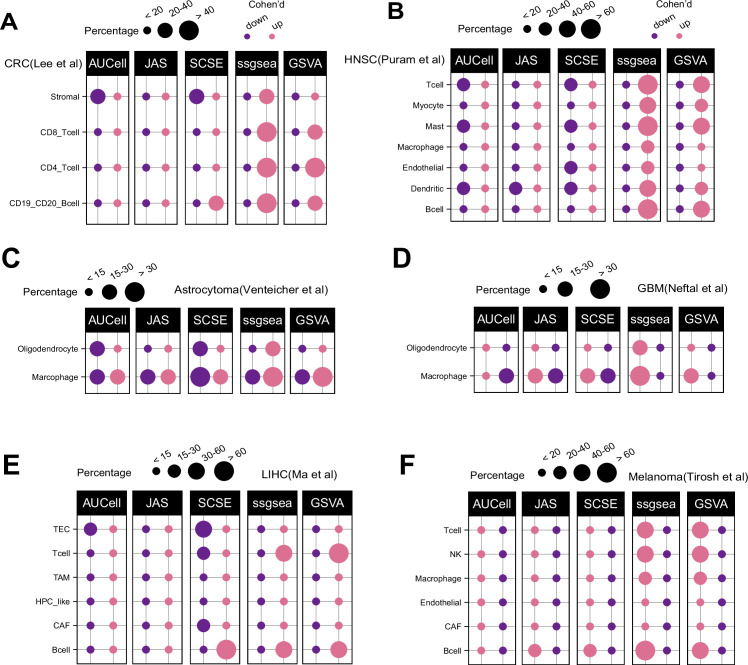
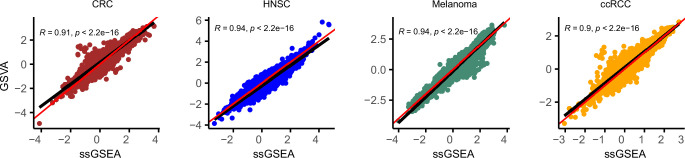
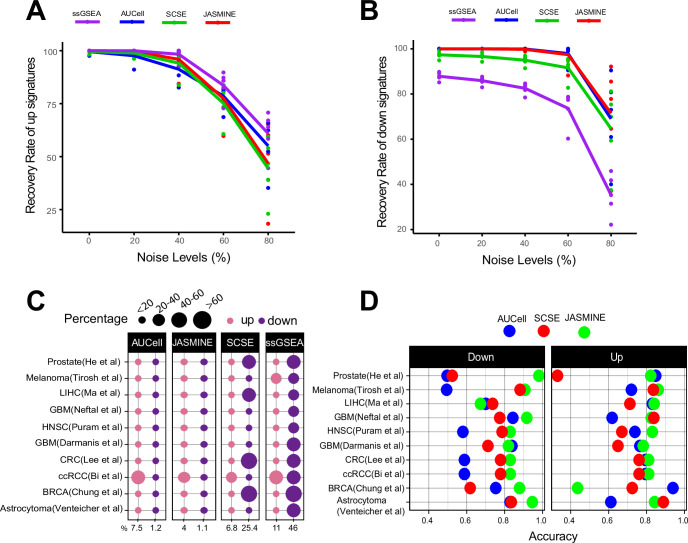
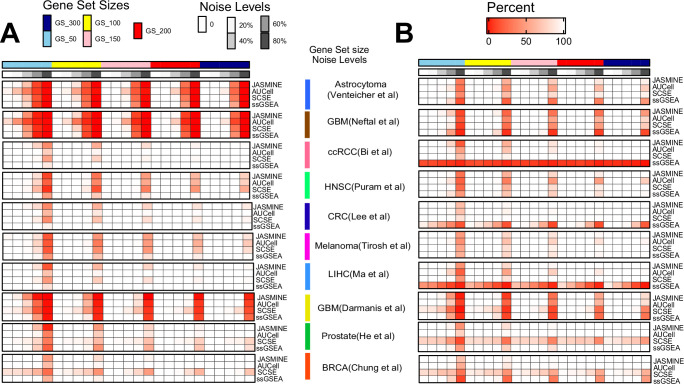
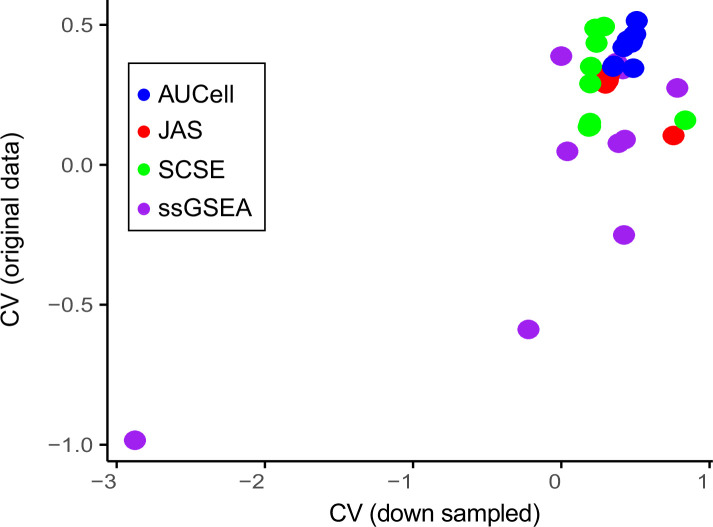
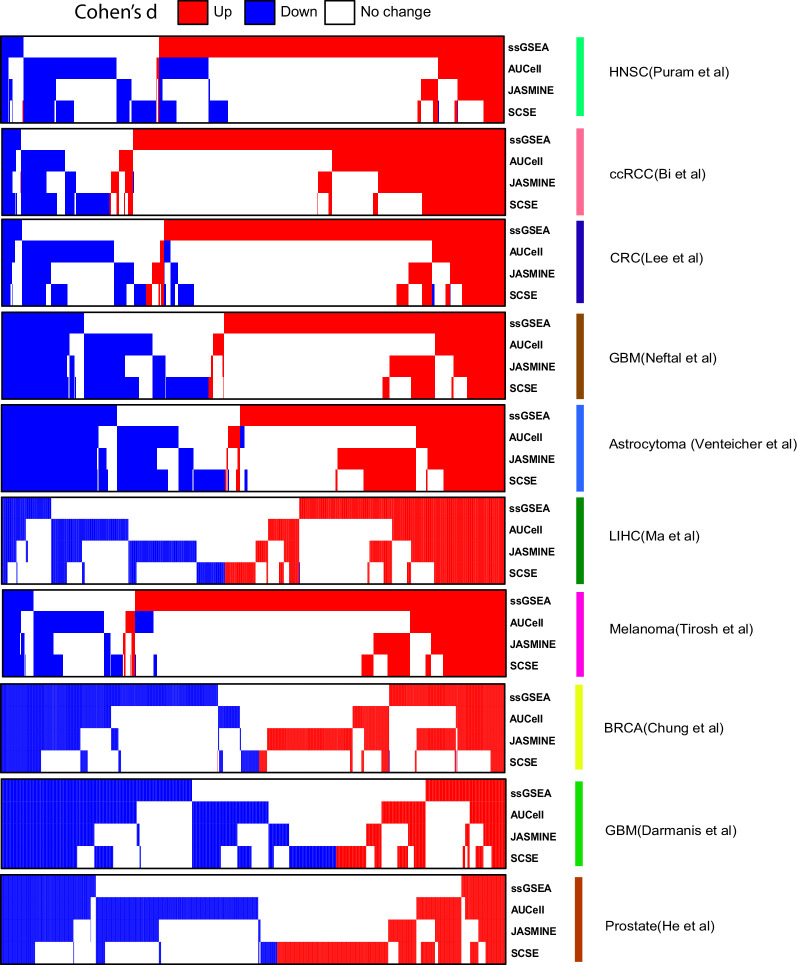
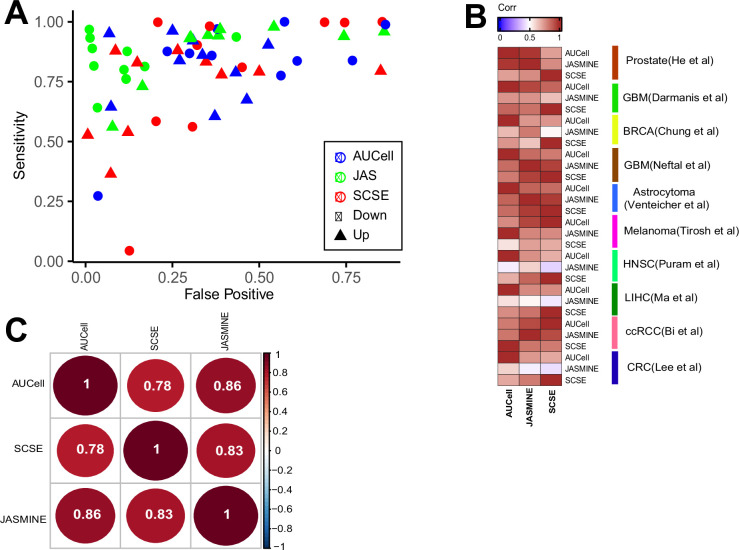
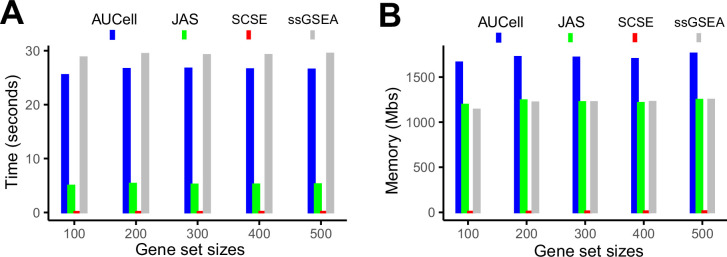
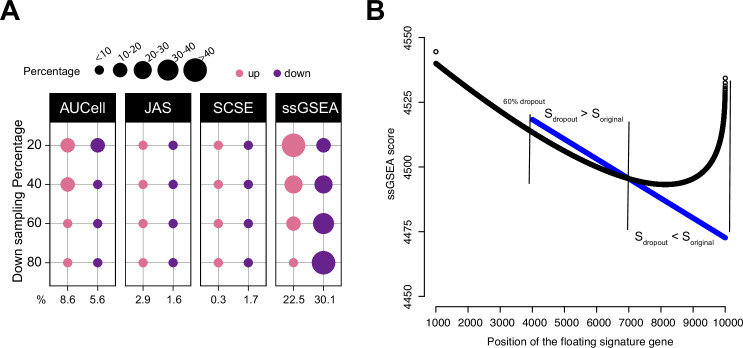
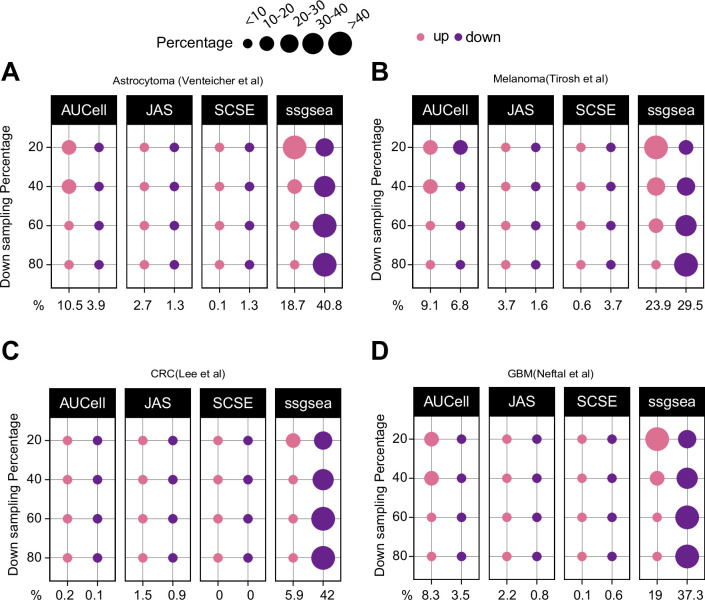
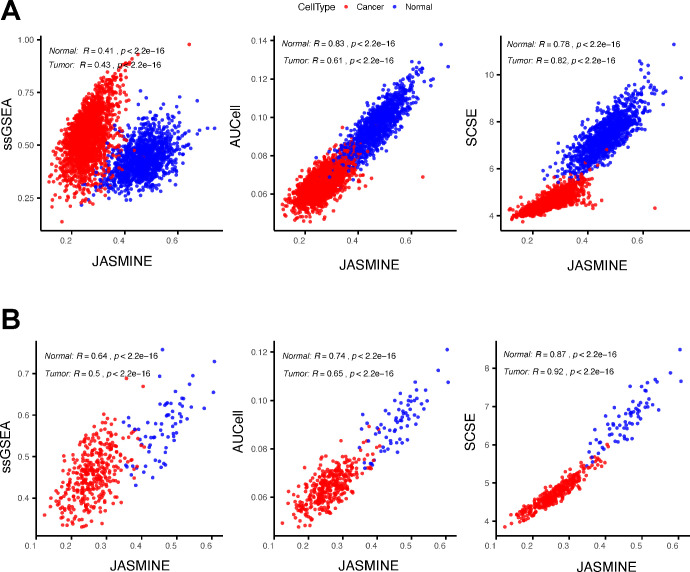
Quantifying the activity of gene expression signatures is common in analyses of single-cell RNA sequencing data. Methods originally developed for bulk samples are often used for this purpose without accounting for contextual differences between bulk and single-cell data. More broadly, few attempts have been made to benchmark these methods. Here, we benchmark five such methods, including single sample gene set enrichment analysis (ssGSEA), Gene Set Variation Analysis (GSVA), AUCell, Single Cell Signature Explorer (SCSE), and a new method we developed, Jointly Assessing Signature Mean and Inferring Enrichment (JASMINE). Using cancer as an example, we show cancer cells consistently express more genes than normal cells. This imbalance leads to bias in performance by bulk-sample-based ssGSEA in gold standard tests and down sampling experiments. In contrast, single-cell-based methods are less susceptible. Our results suggest caution should be exercised when using bulk-sample-based methods in single-cell data analyses, and cellular contexts should be taken into consideration when designing benchmarking strategies.

Keywords: benchmarking; cancer biology; cancer stemness; computational biology; gene counts; human; signature scoring; single cell RNA sequencing; systems biology.


Conflict of interest statement

NN, ZY, YC, XW, SZ No competing interests declared

Figures

Figure 1.
Figure 1.. Gene count imbalances affect signature scoring.
(A) The number of detected genes in tumor and normal cell populations in 10 single cell cancer RNAseq datasets. The height of each bar represents average, and whiskers represent standard deviation. In all cases, the difference is statistically significant (student t test, p < 2.2e-16). (B) Percentage of up and down regulated gene signatures in cancer cells relative to normal cells based on Cohen’s d. Dot size corresponds to the percentage of all signatures tested (n = 7503). (C) Spearman correlation coefficients of Cohen’s d with signature sizes across the datasets and methods. Asterisk (*) in each cell indicates p-value < 0.01. Color of the heatmap represents correlation coefficient. (D) Scores of a cell cycle gene set (GO:0007049) calculated using four methods along with MKI67 expression, gene counts, and cell cycle phases predicted by Seurat in Tumor and normal cell populations of HNSC dataset (GSE103322). The red box highlights non-cycling tumor cells that exhibit higher scores than non-cycling normal cells.
Figure 1—figure supplement 1.
Figure 1—figure supplement 1.. Bias in gene counts.
Number of genes expressed in tumor and normal cell types across five single cell data sets including colorectal cancer (CRC), liver cancer (LIHC), head and neck cancer (HNSC), melanoma, and clear cell renal carcinoma (ccRCC). Maroon colors represent tumor cell populations in each data set while blue represents normal cell populations across the datasets. Note that in the LIHC dataset, CAF, TAM, and TEC are cancer-associated fibroblasts, tumor-associated macrophages, and tumor-related endothelial cells, respectively.
Figure 1—figure supplement 2.
Figure 1—figure supplement 2.. Patterns of up and down regulated signatures.
Comparing tumor and normal cell populations across six additional datasets, including (A) colorectal, (B) head and neck cancer, (C) astrocytoma, (D) IDHwt GBM, (E) liver, and (F) melanoma. The size of each dot represents the percentage of up or down signatures over all signatures tested (n = 7503).
Figure 1—figure supplement 3.
Figure 1—figure supplement 3.. GSVA and ssGSEA comparison.
Comparison of effect size (Cohen’s d) for ssGSEA (x-axis) and GSVA (y-axis) in four datasets: colorectal cancer (CRC) , head and neck cancer, melanoma, and clear cell renal carcinoma. Red line represents X = Y and black line is the regression line. Correlation is calculated using Spearman method.
Figure 2.
Figure 2.. Sensitivity, specificity and accuracy.
(A) Recovery rate for up gene signatures across five noise levels by the four methods. Each dot represents one dataset. At each noise level, average of all datasets is used to represent the performance of each method. (B) Similarly, for down signatures. (C) Percentages of false up and down signatures. The size of the dots corresponds to the percentages of all the signatures tested. Because the contrasting groups are generated by down sampling, no signatures are expected to be identified. The numbers below the heatmap are the average percentage. (D) Accuracy of the three methods, separated into up and down signatures. Accuracy is calculated as the agreement with consensus calls by at least two methods.
Figure 2—figure supplement 1.
Figure 2—figure supplement 1.. Benchmarking sensitivity using simulated gene signatures.
We simulated four gene set sizes (50, 100, 150, 200, and 300), each with five levels of noise (0, 20, 40, 60, and 80%). For each size/noise combination, we randomly generated 1000 signatures. The results shown in this figure are percentage of the 1000 random signatures. (A) Detection sensitivity for up gene signatures. Deeper color indicates lower recovery rates (thus more misses). (B) Detection sensitivity for down signatures.
Figure 2—figure supplement 2.
Figure 2—figure supplement 2.. Coefficient of Variance.
Average coefficient of variance between the original datasets and the 50% down-sampled datasets. Each dot represents one dataset.
Figure 2—figure supplement 3.
Figure 2—figure supplement 3.. Comparison of calling results from the four methods across the seven datasets.
In heatmap, each column represents one signature. Blue, down signature; red, up signature.
Figure 2—figure supplement 4.
Figure 2—figure supplement 4.. Consistency with consensus and pairwise comparison.
(A) Sensitivity and false positive benchmarked against the consensus calls (signatures called by at least two methods). (B) Spearman correlation of Cohen’s d broken down to each dataset. (C) Consistency between three methods, numbers are Spearman correlation coefficients.
Figure 2—figure supplement 5.
Figure 2—figure supplement 5.. Evaluation of computing cost.
(A) Average time consumption for completing 50 gene signatures using a 2.2 GHz, 32 GB memory CPU. (B) Memory cost for completing 50 gene signatures using a 2.2 GHz, 32 GB memory CPU.
Figure 3.
Figure 3.. Impact of dropouts on ssGSEA signature scoring.
(A) Percentages of up and down regulated gene signatures in original cells relative to down sampled cells for four levels of down sampling (20, 40, 60, and 80%) based on Cohen’s d. Dot size corresponds to the percentage of all signatures tested (n = 7503) in Head and Neck (Puram et al., 2017). (B) Effect of dropouts on ssGSEA scoring using a dummy expression matrix. The black line denotes the cell without any dropouts, and the blue line denotes the same cell with a 60% dropout rate. Note that for the gene signature, the first 99 genes are fixed. The x axis reflects the position of the last signature gene. When the gene is at rank <4000. The two cells give identical scores. However, after entering dropout zone, the scores start to deviate.
Figure 3—figure supplement 1.
Figure 3—figure supplement 1.. Down sampling levels affect signature scoring.
Percentage of up and down regulated gene signatures in original cells relative to down sampled cells for four levels of down sampling (20, 40, 60, and 80%) based on Cohen’s d. Dot size corresponds to the percentage of all signatures tested (n = 7503) (A) in astrocytoma, (B) melanoma, (C) colorectal cancer, and (D) in glioblastoma data.
Figure 3—figure supplement 2.
Figure 3—figure supplement 2.. An example showing ssGSEA score changes.
(A) Comparing scores of a gene signature (‘ZNF597_TARGET_GENES’) between JASMINE and other tools in all tumor and normal cells using the head and neck data. (B) The same comparison but limited to cells with the number of expressed genes between 4000 and 5000.

Similar articles

Cited by

References

    1. Aibar S, González-Blas CB, Moerman T, Huynh-Thu VA, Imrichova H, Hulselmans G, Rambow F, Marine J-C, Geurts P, Aerts J, van den Oord J, Atak ZK, Wouters J, Aerts S. SCENIC: single-cell regulatory network inference and clustering. Nature Methods. 2017;14:1083–1086. doi: 10.1038/nmeth.4463. - DOI - PMC - PubMed
    1. Ben-Shachar M, Lüdecke D, Makowski D. effectsize: Estimation of Effect Size Indices and Standardized Parameters. Journal of Open Source Software. 2020;5:2815. doi: 10.21105/joss.02815. - DOI
    1. Bi K, He MX, Bakouny Z, Kanodia A, Napolitano S, Wu J, Grimaldi G, Braun DA, Cuoco MS, Mayorga A, DelloStritto L, Bouchard G, Steinharter J, Tewari AK, Vokes NI, Shannon E, Sun M, Park J, Chang SL, McGregor BA, Haq R, Denize T, Signoretti S, Guerriero JL, Vigneau S, Rozenblatt-Rosen O, Rotem A, Regev A, Choueiri TK, Van Allen EM. Tumor and immune reprogramming during immunotherapy in advanced renal cell carcinoma. Cancer Cell. 2021;39:649–661. doi: 10.1016/j.ccell.2021.02.015. - DOI - PMC - PubMed
    1. Butler A, Hoffman P, Smibert P, Papalexi E, Satija R. Integrating single-cell transcriptomic data across different conditions, technologies, and species. Nature Biotechnology. 2018;36:411–420. doi: 10.1038/nbt.4096. - DOI - PMC - PubMed
    1. Chung W, Eum HH, Lee HO, Lee KM, Lee HB, Kim KT, Ryu HS, Kim S, Lee JE, Park YH, Kan Z, Han W, Park WY. Single-cell RNA-seq enables comprehensive tumour and immune cell profiling in primary breast cancer. Nature Communications. 2017;8:15081. doi: 10.1038/ncomms15081. - DOI - PMC - PubMed

Publication types

Associated data