

Age- and Sex-Specific Differences in Multimorbidity Patterns and Temporal Trends on Assessing Hospital Discharge Records in Southwest China: Network-Based Study
- PMID: 35212632
- PMCID: PMC8917436
- DOI: 10.2196/27146
Age- and Sex-Specific Differences in Multimorbidity Patterns and Temporal Trends on Assessing Hospital Discharge Records in Southwest China: Network-Based Study
Erratum in
-
Correction: Age- and Sex-Specific Differences in Multimorbidity Patterns and Temporal Trends on Assessing Hospital Discharge Records in Southwest China: Network-Based Study.J Med Internet Res. 2022 Jun 16;24(6):e39648. doi: 10.2196/39648. J Med Internet Res. 2022. PMID: 35709490 Free PMC article.
Abstract
Background: Multimorbidity represents a global health challenge, which requires a more global understanding of multimorbidity patterns and trends. However, the majority of studies completed to date have often relied on self-reported conditions, and a simultaneous assessment of the entire spectrum of chronic disease co-occurrence, especially in developing regions, has not yet been performed.
Objective: We attempted to provide a multidimensional approach to understand the full spectrum of chronic disease co-occurrence among general inpatients in southwest China, in order to investigate multimorbidity patterns and temporal trends, and assess their age and sex differences.
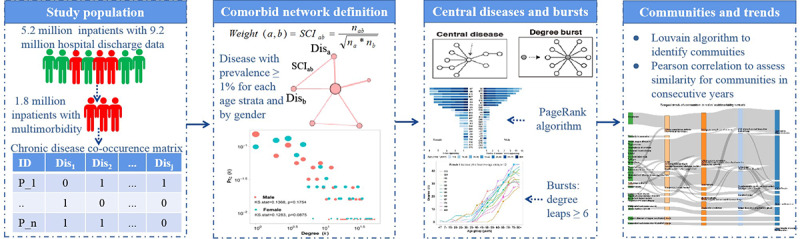
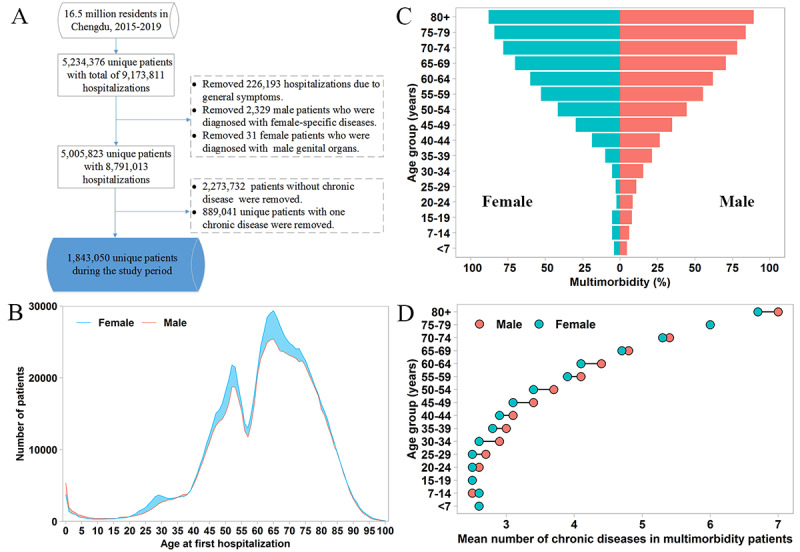
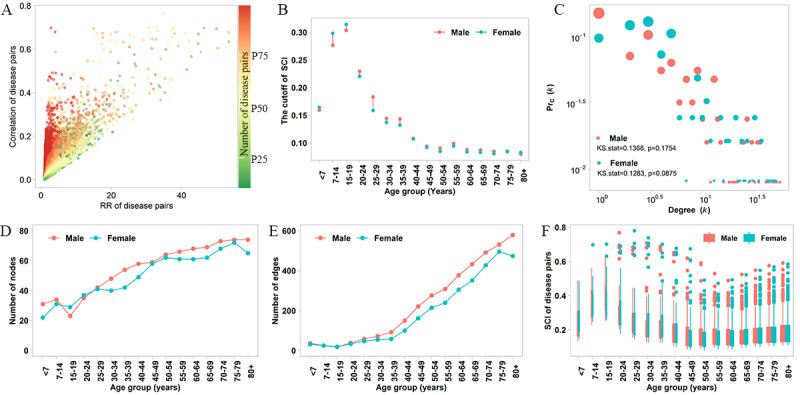
Methods: We conducted a retrospective cohort analysis based on 8.8 million hospital discharge records of about 5.0 million individuals of all ages from 2015 to 2019 in a megacity in southwest China. We examined all chronic diagnoses using the ICD-10 (International Classification of Diseases, 10th revision) codes at 3 digits and focused on chronic diseases with ≥1% prevalence for each of the age and sex strata, which resulted in a total of 149 and 145 chronic diseases in males and females, respectively. We constructed multimorbidity networks in the general population based on sex and age, and used the cosine index to measure the co-occurrence of chronic diseases. Then, we divided the networks into communities and assessed their temporal trends.
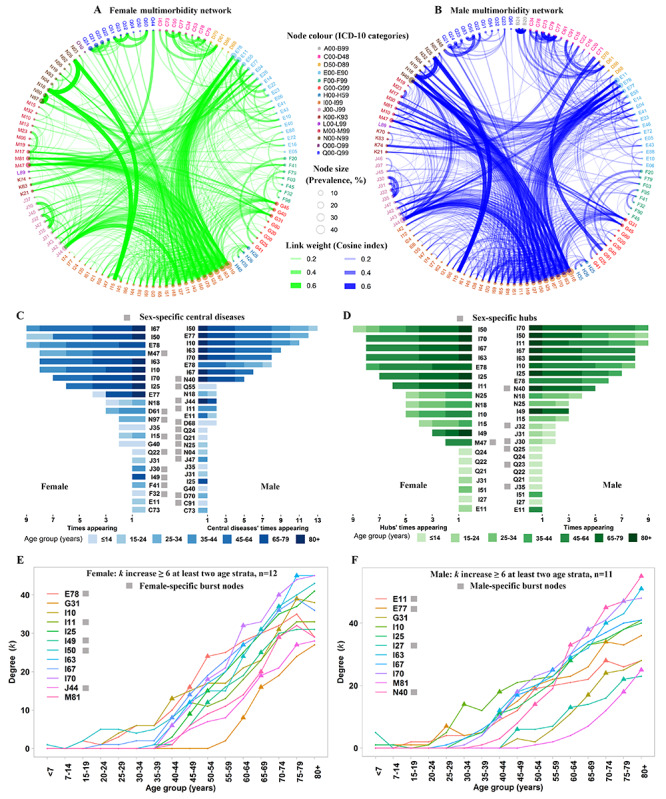
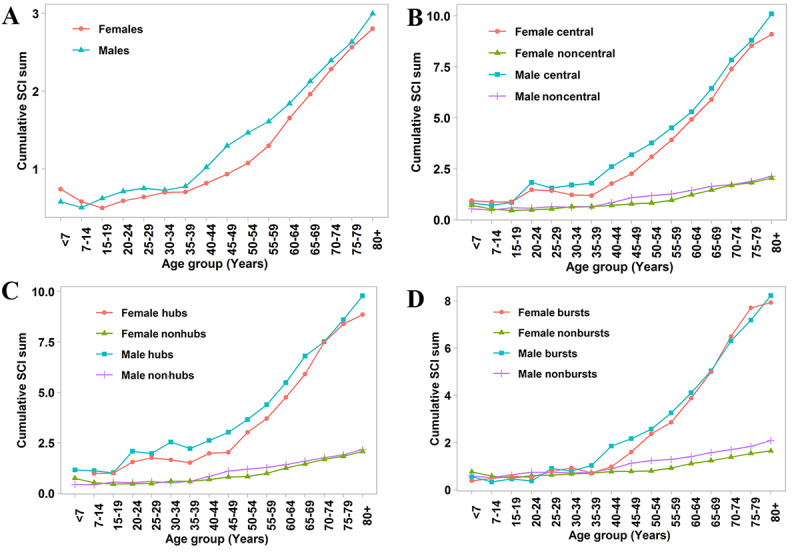
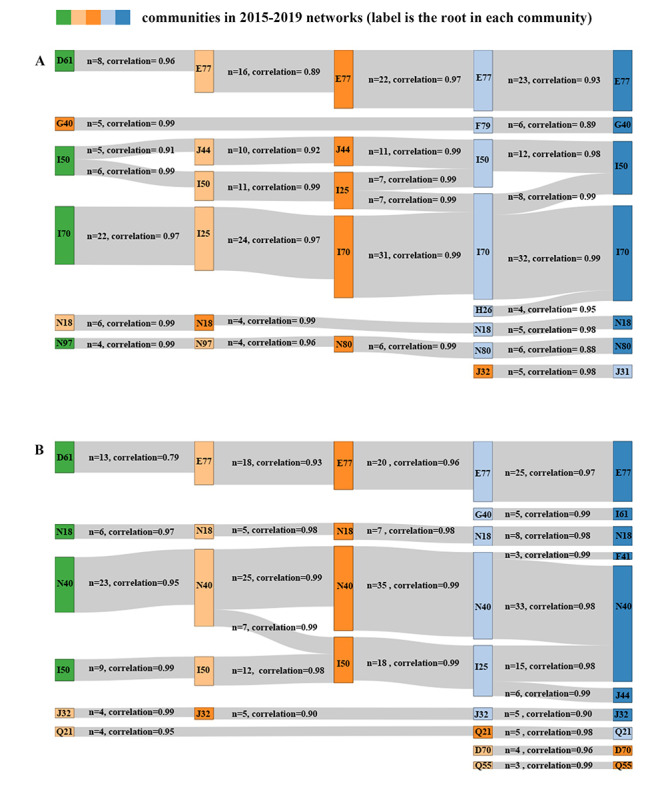
Results: The results showed complex interactions among chronic diseases, with more intensive connections among males and inpatients ≥40 years old. A total of 9 chronic diseases were simultaneously classified as central diseases, hubs, and bursts in the multimorbidity networks. Among them, 5 diseases were common to both males and females, including hypertension, chronic ischemic heart disease, cerebral infarction, other cerebrovascular diseases, and atherosclerosis. The earliest leaps (degree leaps ≥6) appeared at a disorder of glycoprotein metabolism that happened at 25-29 years in males, about 15 years earlier than in females. The number of chronic diseases in the community increased over time, but the new entrants did not replace the root of the community.
Conclusions: Our multimorbidity network analysis identified specific differences in the co-occurrence of chronic diagnoses by sex and age, which could help in the design of clinical interventions for inpatient multimorbidity.
Keywords: administrative data; longitudinal study; multimorbidity pattern; multimorbidity prevalence; network analysis; regional research; temporal trend.
©Liya Wang, Hang Qiu, Li Luo, Li Zhou. Originally published in the Journal of Medical Internet Research (https://www.jmir.org), 25.02.2022.
Conflict of interest statement
Conflicts of Interest: None declared.
Figures
References
-
- Forman DE, Maurer MS, Boyd C, Brindis R, Salive ME, Horne FM, Bell SP, Fulmer T, Reuben DB, Zieman S, Rich MW. Multimorbidity in Older Adults With Cardiovascular Disease. J Am Coll Cardiol. 2018 May 15;71(19):2149–2161. doi: 10.1016/j.jacc.2018.03.022. https://linkinghub.elsevier.com/retrieve/pii/S0735-1097(18)33626-X S0735-1097(18)33626-X - DOI - PMC - PubMed
-
- Barnett K, Mercer SW, Norbury M, Watt G, Wyke S, Guthrie B. Epidemiology of multimorbidity and implications for health care, research, and medical education: a cross-sectional study. The Lancet. 2012 Jul 7;380(9836):37–43. doi: 10.1016/S0140-6736(12)60240-2. http://linkinghub.elsevier.com/retrieve/pii/S0140-6736(12)60240-2 S0140-6736(12)60240-2 - DOI - PubMed
-
- Calderón-Larrañaga A, Vetrano DL, Ferrucci L, Mercer SW, Marengoni A, Onder G, Eriksdotter M, Fratiglioni L. Multimorbidity and functional impairment-bidirectional interplay, synergistic effects and common pathways. J Intern Med. 2019 Mar;285(3):255–271. doi: 10.1111/joim.12843. doi: 10.1111/joim.12843. - DOI - PMC - PubMed
Publication types
MeSH terms
LinkOut - more resources
Full Text Sources
