. 2022 May 1;71(5):945-960.
doi: 10.2337/db21-0382.

Gut Microbiota Regulate Pancreatic Growth, Exocrine Function, and Gut Hormones

Affiliations

Gut Microbiota Regulate Pancreatic Growth, Exocrine Function, and Gut Hormones

Khyati Girdhar et al. Diabetes. .

Abstract

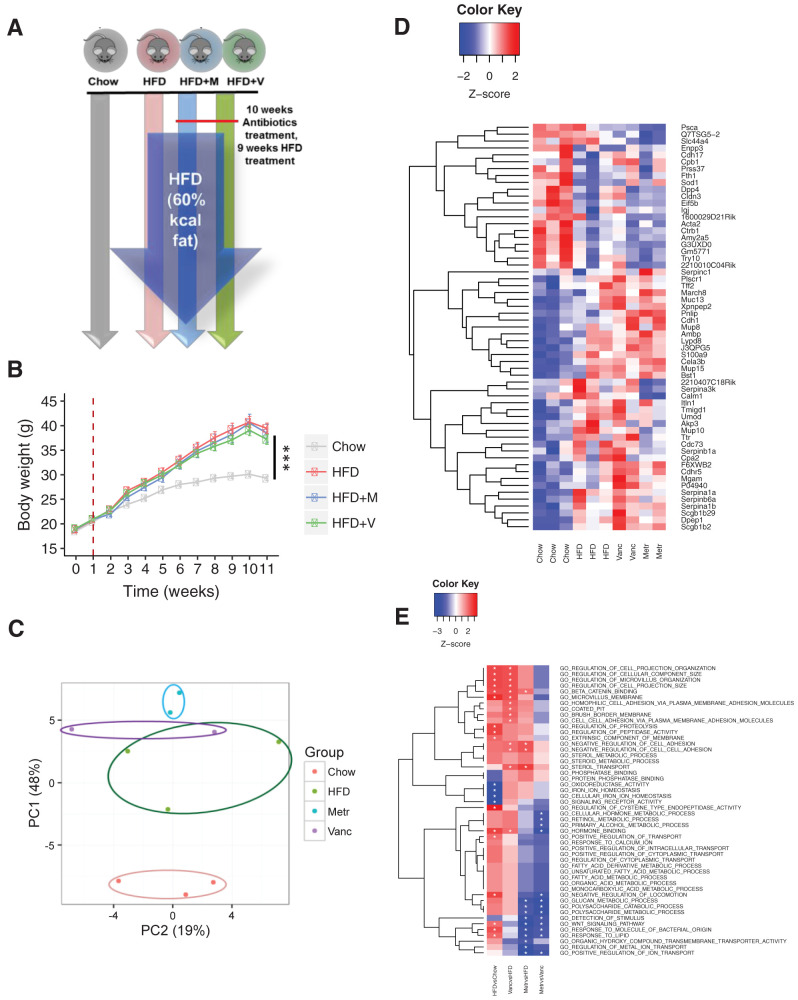
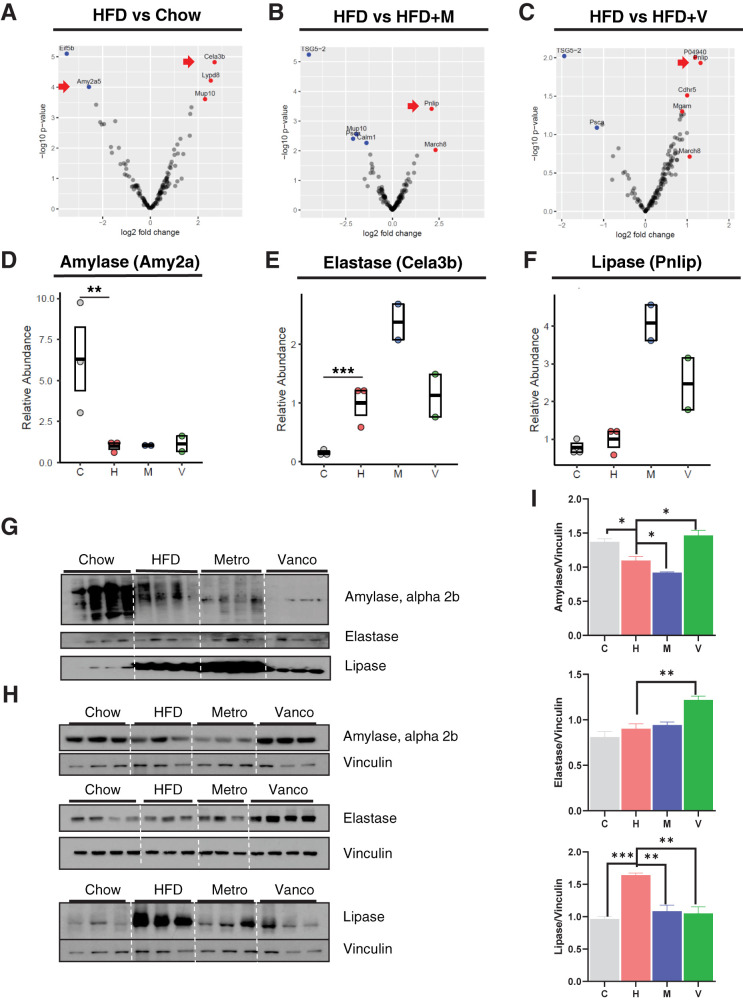
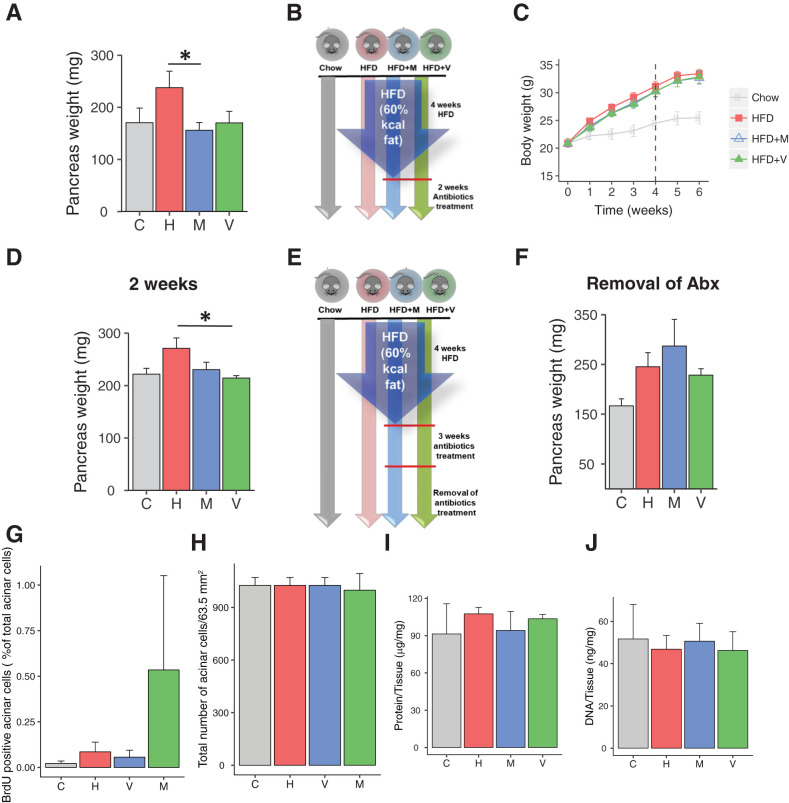
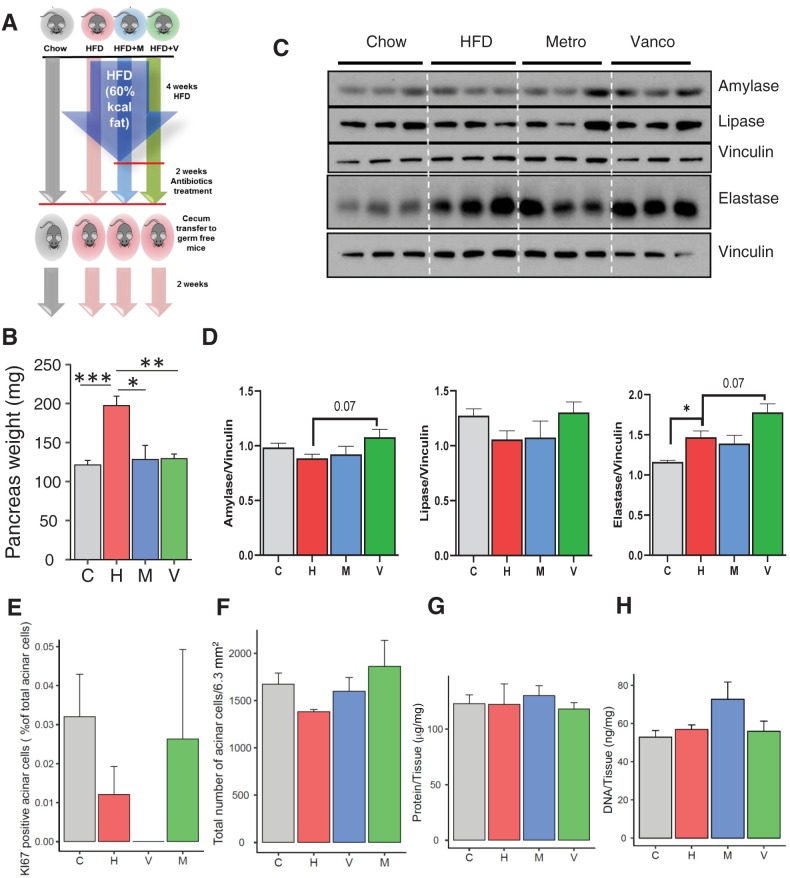
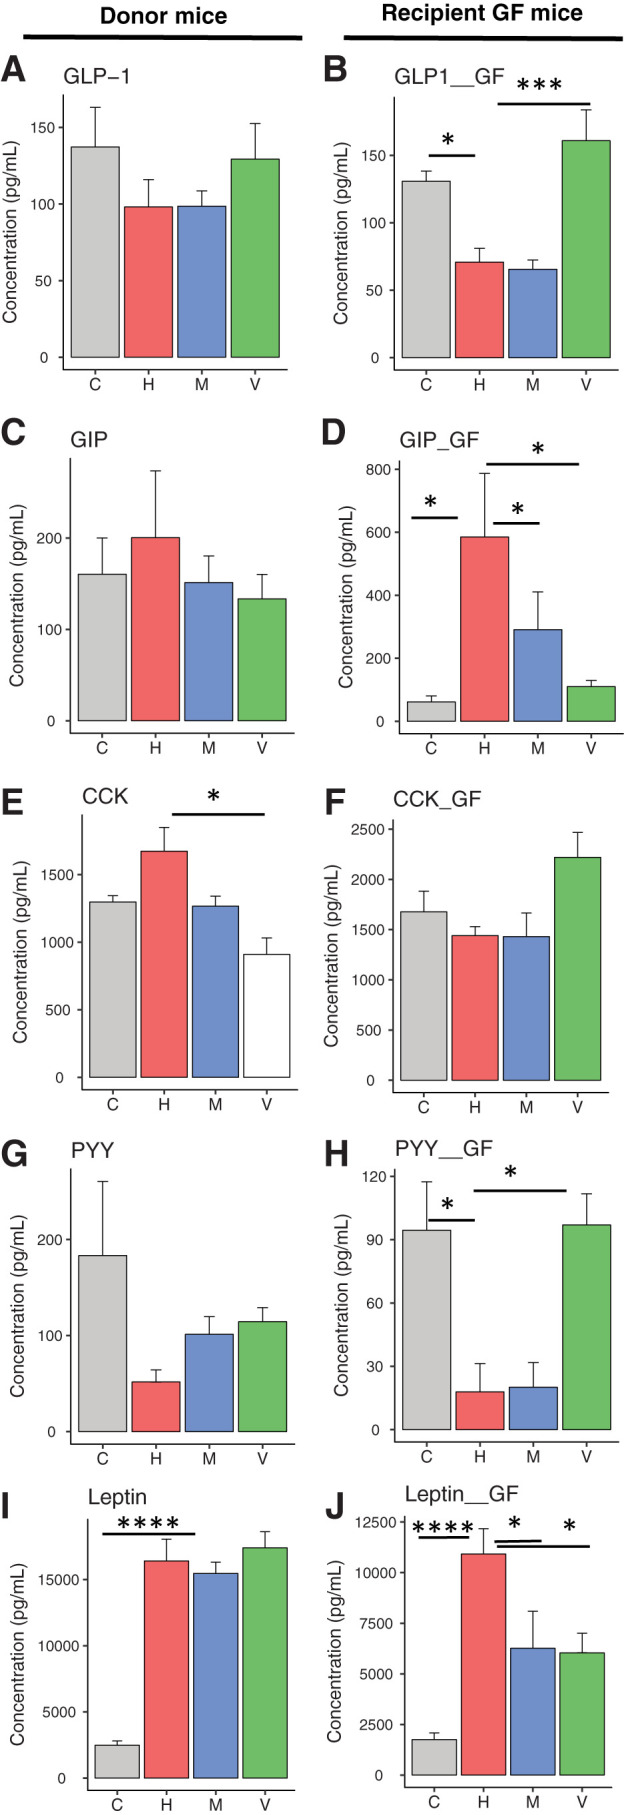
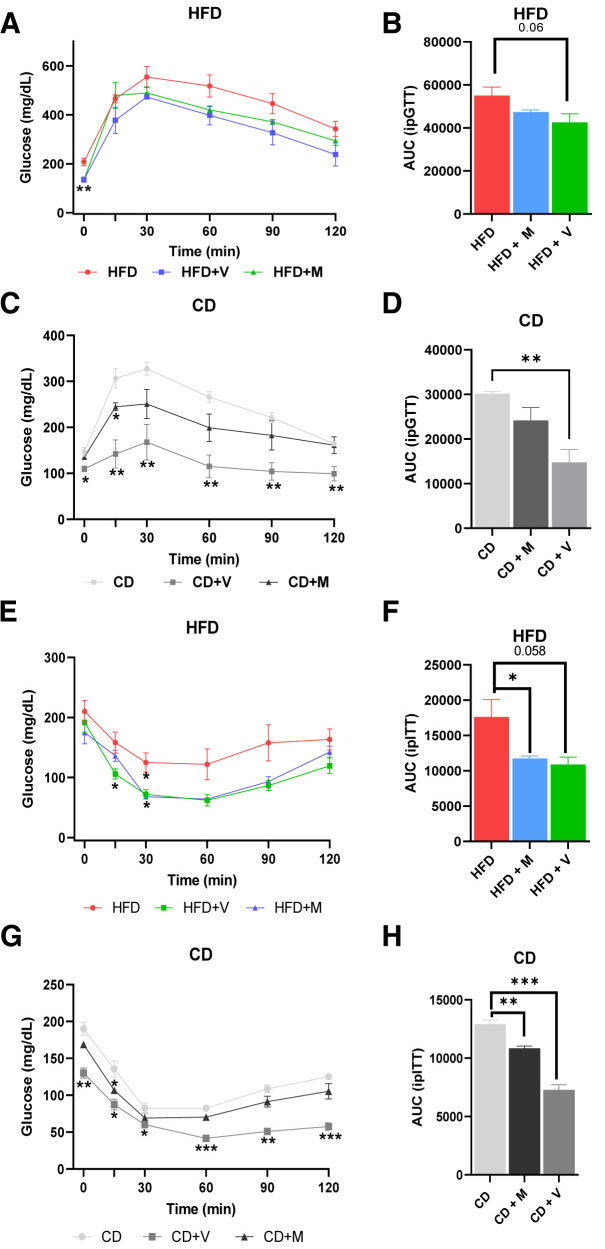
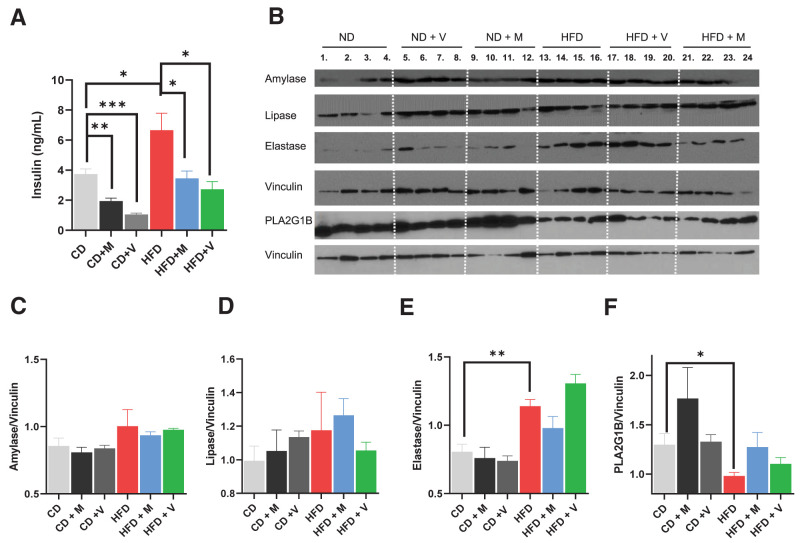
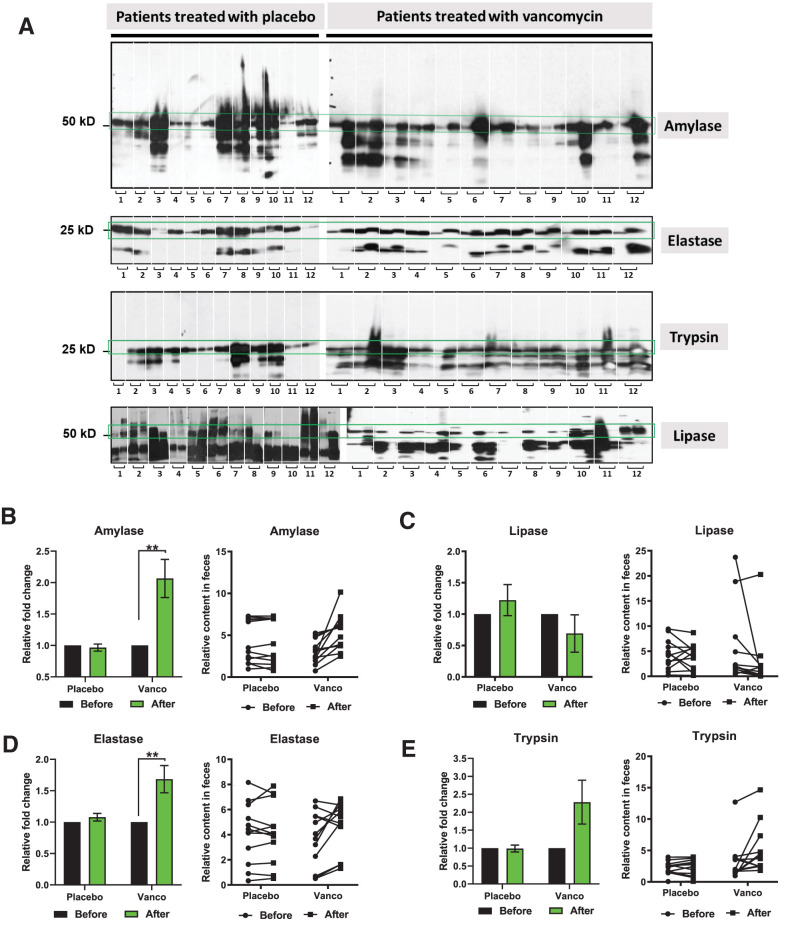
Growing evidence indicates an important link between gut microbiota, obesity, and metabolic syndrome. Alterations in exocrine pancreatic function are also widely present in patients with diabetes and obesity. To examine this interaction, C57BL/6J mice were fed a chow diet, a high-fat diet (HFD), or an HFD plus oral vancomycin or metronidazole to modify the gut microbiome. HFD alone leads to a 40% increase in pancreas weight, decreased glucagon-like peptide 1 and peptide YY levels, and increased glucose-dependent insulinotropic peptide in the plasma. Quantitative proteomics identified 138 host proteins in fecal samples of these mice, of which 32 were significantly changed by the HFD. The most significant of these were the pancreatic enzymes. These changes in amylase and elastase were reversed by antibiotic treatment. These alterations could be reproduced by transferring gut microbiota from donor C57BL/6J mice to germ-free mice. By contrast, antibiotics had no effect on pancreatic size or exocrine function in C57BL/6J mice fed the chow diet. Further, 1 week vancomycin administration significantly increased amylase and elastase levels in obese men with prediabetes. Thus, the alterations in gut microbiota in obesity can alter pancreatic growth, exocrine function, and gut endocrine function and may contribute to the alterations observed in patients with obesity and diabetes.


Figures

Figure 1
Figure 1
Gut microbiota alters host intestinal proteome. A: Schematic representation of the experimental design. B: Body weight gain of mice on chow or HFD with or without antibiotics (Abx) treatment with metronidazole (M) or vancomycin (V) (n = 8 per group). Time 0 is the beginning of the HFD, and the dashed line represents the beginning of Abx treatment. ***P < 0.001. C: Principal component (PC) analysis of intestinal proteomes of mice fed chow, HFD, HFD + vancomycin (Vanc), or HFD + metronidazole (Metr). Each dot represents one mouse sample. D: Heat map shows the top 60 proteins affected by Abx and diet. E: Heat map shows the top functional classes affected by Abx treatment.
Figure 2
Figure 2
Gut microbiota alters exocrine pancreas function. Volcano plot shows the distribution of differentially identified proteins by HFD (A), metronidazole (M) (B), and vancomycin (V) (C) in a log10 scale. C, chow; H, HFD. Dot/box plots show the relative abundance of amylase (D), elastase (E), and lipase (F). Data represent mean ± SEM (n = 2–3 per group). *P ≤ 0.05, **P ≤ 0.01. G: Western blots of fecal protein extracts (9 weeks on the HFD; 10 weeks on antibiotics). Metro, metronidazole; Vanco, vancomycin. Western blots for protein extracts of pancreas (H) and quantification of amylase, elastase, and lipase levels normalized to vinculin (I). Data represent mean ± SEM (n = 4 per group). *P ≤ 0.05, **P ≤ 0.01.
Figure 3
Figure 3
Gut microbiota alters pancreas mass. A: Pancreas weight of mice on chow, HFD, HFD + vancomycin (V), or HFD + metronidazole (M) (n = 7–8 per group) at the end of 10 weeks of antibiotics (Abx) treatment. B: Schematic representation of the modified short-term experimental design. C: Body weight gain of mice on chow or HFD with or without Abx treatment. Time 0 is the beginning of the HFD, and the dashed line represents the beginning of Abx treatment (n = 5 per group). D: Pancreas weight of mice on chow, HFD, HFD + vancomycin, or HFD + metronidazole (n = 5 per group) at the end of 2 weeks of Abx treatment. E: Experimental design in which mice were treated for 4 weeks with chow or HFD, then 3 weeks with water or Abx in addition to the diet, and then all mice on Abx were placed on normal water (Abx were removed). F: Pancreas weight of mice 3 weeks after the Abx removal (n = 4 per group). G: Quantification of amylase+ BrdU+ cells. Data represent mean ± SEM (n = 4–5 per group). **P ≤ 0.01. H: Total number of amylase+, acinar cells for a constant area (63.5 mm2). Data represent mean ± SEM. Protein content (I) and DNA content (J) of 1 mg pancreas tissue (n = 3; 6 images/pancreata). Data represent mean ± SEM.
Figure 4
Figure 4
Alteration of pancreas mass and pancreatic function can be transferred to GF mice. A: Schematic representation of the experimental design of bacterial transfer from treated donor mice to GF mice. B: Pancreas weight of GF mice colonized with bacteria from mice on chow (C), HFD (H), HFD + vancomycin (V), or HFD + metronidazole (M), weighed 2 weeks after transfer (n = 6 colonized mice). Results are shown as mean ± SEM. *P < 0.05, **P < 0.01, ***P < 0.001. C: Western blots for pancreatic enzymes in the pancreas of chow- or HFD-fed GF mice that received bacterial transfer from chow + placebo, HFD + placebo, HFD + vancomycin-, or HFD + metronidazole-treated mice and quantitation of amylase, lipase, and elastase proteins normalized to vinculin (n = 3 per group; 2 weeks after colonization). D: Quantification of Ki67+ amylase+ cells. Data represent mean ± SEM (n = 3 per group). **P ≤ 0.01. E: Total number of amylase+ acinar cells for a constant area (63.5 mm2, n = 5). Data represent mean ± SEM. Protein content (F) and DNA content (G) of 1 mg pancreas tissue (n = 5, 6 images for pancreata). Data represent mean ± SEM.
Figure 5
Figure 5
Gastrointestinal hormone secretion is altered by gut microbiota. Plasma levels of various intestinal hormones of mice fed chow (C) or HFD (H), HFD + metronidazole (M) or HFD + vancomycin (V) (left side) and of GF recipient mice, 2 weeks after the bacterial transfer (right side). Plasma levels of GLP-1 (A and B), GIP (C and D), CCK (E and F), PYY (G and H), and leptin (I and J) were measured. Data represent mean ± SEM (n = 6–8 for donor mice and n = 6 per mice colonized with cecal bacteria from antibiotic-treated mice). *P ≤ 0.05, **P ≤ 0.01, *** P ≤ 0.001.
Figure 6
Figure 6
Effects of antibiotic treatment on insulin sensitivity and glucose tolerance. A: Intraperitoneal GTTs (ipGTT) on 12-week old C57Bl/6J fed the HFD for 2 weeks (n = 4 per group). M, metronidazole; V, vancomycin. B: Area under curve (AUC) of ipGTT curve of HFD-fed mice. C: ipGTT on same age and genotype of chow diet (CD)-fed mice (n = 4 per group). D: Area under curve of ipGTT curve of CD-fed mice. E: ipITT on HFD-fed mice (n = 3–4 per group). F: Area under curve of ipITT curve of HFD-fed mice. G: ipITT on CD-fed mice (n = 3–4 per group). H: Area under curve of ipITT curve of CD-fed mice. Data are shown as mean ± SEM. Statistical analyses were performed by two-tailed, unpaired Student t test. *P ≤ 0.05, **P ≤ 0.01, *** P ≤ 0.001.
Figure 7
Figure 7
Antibiotic treatment alters fasting plasma insulin levels but not exocrine enzymes in chow-fed mice. A: Plasma insulin levels were measured on 12-week-old C57Bl/6J after mice were starved for 6 h (n = 4 per group). CD, chow diet; M, metronidazole; V, vancomycin. B: Western blot analysis of amylase, lipase, elastase, and PLA2G1B protein from pancreatic lysate (n = 4 per group). Relative intensity of amylase (C), lipase (D), elastase (E), and PLA2G1B (F). Vinculin was used as the loading control and for normalization in the quantification. Data are shown as mean ± SEM. Chow-fed and HFD-fed mice treated with antibiotics were compared with chow-fed control. HFD-fed mice treated with antibiotics were compared with HFD-fed control. Statistical analyses were performed by two-tailed, unpaired Student t test. **P < 0.01, ***P < 0.001.
Figure 8
Figure 8
Gut microbiota alters exocrine pancreas function in obese and insulin-resistant men. A: Western blots of amylase, elastase, trypsin, and lipase in the fecal samples of men who were treated with placebo (left) or vancomycin (Vanco) (right) for 1 week. The two adjacent columns correspond for each patient to before and after treatment. Individuals are separated with white dashes (n = 12). Quantification of amylase (B), lipase (C), elastase (D), and trypsin (E) levels in placebo and vancomycin groups. Molecular weight: amylase, 57 kDa; lipase, 51 kDa; elastase, 28 kDa; and trypsin, 27 kDa. Data represent mean ± SEM. * P < 0.05, ** P < 0.01 by paired t test.

Similar articles

Cited by

References

    1. Schroeder BO, Bäckhed F. Signals from the gut microbiota to distant organs in physiology and disease. Nat Med, 2016;22:1079–1089 - PubMed
    1. Roy S, Trinchieri G. Microbiota: a key orchestrator of cancer therapy. Nat Rev Cancer 2017;17:271–285 - PubMed
    1. Yurkovetskiy LA, Pickard JM, Chervonsky AV. Microbiota and autoimmunity: exploring new avenues. Cell Host Microbe 2015;17:548–552 - PMC - PubMed
    1. Dedrick S, Sundaresh B, Huang Q, et al. ., The role of gut microbiota and environmental factors in type 1 diabetes pathogenesis. Front Endocrinol (Lausanne) 2020;11:78. - PMC - PubMed
    1. Fujisaka S, Ussar S, Clish C, et al. ., Antibiotic effects on gut microbiota and metabolism are host dependent. J Clin Invest 2016;126:4430–4443 - PMC - PubMed

Publication types