. 2022 Feb 25;8(8):eabk0231.
doi: 10.1126/sciadv.abk0231. Epub 2022 Feb 25.

Distinct roles for motor cortical and thalamic inputs to striatum during motor skill learning and execution

Affiliations

Distinct roles for motor cortical and thalamic inputs to striatum during motor skill learning and execution

Steffen B E Wolff et al. Sci Adv. .

Abstract

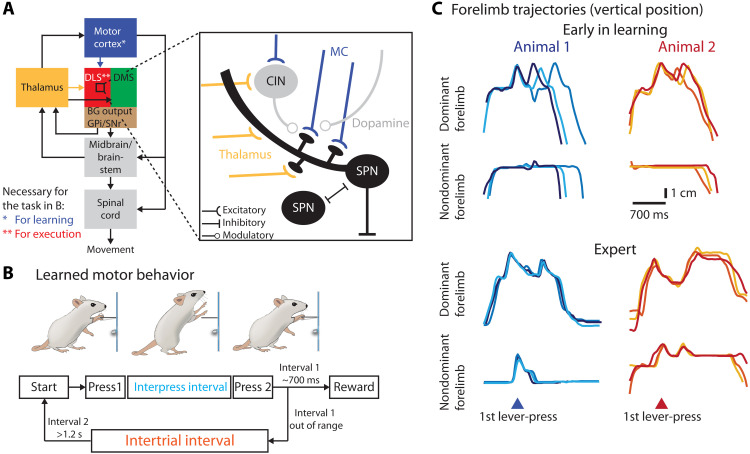
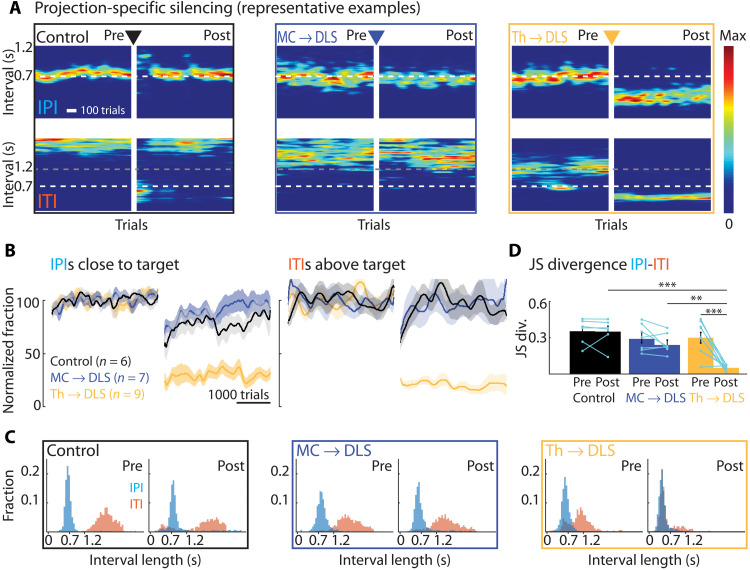
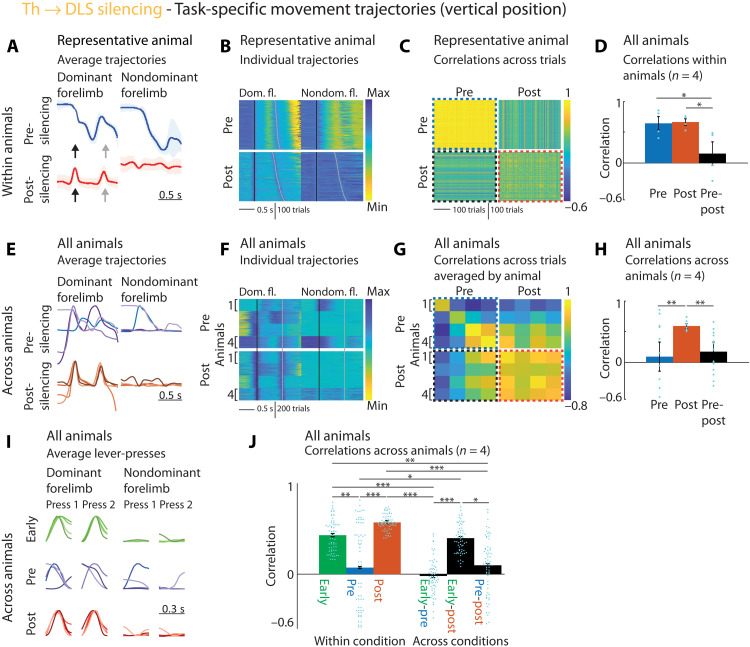
The acquisition and execution of motor skills are mediated by a distributed motor network, spanning cortical and subcortical brain areas. The sensorimotor striatum is an important cog in this network, yet the roles of its two main inputs, from motor cortex and thalamus, remain largely unknown. To address this, we silenced the inputs in rats trained on a task that results in highly stereotyped and idiosyncratic movement patterns. While striatal-projecting motor cortex neurons were critical for learning these skills, silencing this pathway after learning had no effect on performance. In contrast, silencing striatal-projecting thalamus neurons disrupted the execution of the learned skills, causing rats to revert to species-typical pressing behaviors and preventing them from relearning the task. These results show distinct roles for motor cortex and thalamus in the learning and execution of motor skills and suggest that their interaction in the striatum underlies experience-dependent changes in subcortical motor circuits.


Figures

Fig. 1.
Fig. 1.. Probing the role of excitatory inputs to striatum in motor skill learning and execution.
(A) Schematic of the probed motor network with the BG subdivided into DLS and dorsomedial (DMS) striatum and the output nuclei globus pallidus internus (GPi) and substantia nigra pars reticulata (SNr). Somatosensory cortical projections to DLS, motor cortical projections to other BG nuclei, cerebellar inputs to thalamus, and dopaminergic midbrain projections to DLS/DMS are omitted for clarity. Expanded view: The main excitatory inputs to DLS from motor cortex (MC) (blue) and thalamus (yellow) target overlapping populations of SPNs, cholinergic (CIN), and other interneurons (omitted for clarity). (B) Behavioral paradigm to test the role of the DLS and its excitatory inputs during learning and execution of complex movement patterns. Rats are rewarded for pressing a lever twice with a specific delay [interpress interval (IPI)]. After unsuccessful trials, animals must refrain from pressing the lever for 1.2 s [intertrial interval (ITI)] to initiate a new trial. (C) Forelimb trajectories of two example animals early (top) and late in training (bottom). Shown are vertical positions of dominant (executing the first lever-press) and nondominant forelimbs for three trials each (randomly selected rewarded trials after unrewarded trials).
Fig. 2.
Fig. 2.. DLS and DLS-projecting motor cortex neurons are required for motor skill learning.
(A) Effects of pre-training manipulations on task performance throughout learning for four conditions: DLS control injection, DMS excitotoxic lesions, DLS excitotoxic lesions, and silencing of DLS-projecting motor cortex neurons (MC → DLS) (see Results, Materials and Methods, and fig. S1B for details). Shown are heatmaps of IPI and ITI probability distributions for representative animals. (B) Population performance for manipulations as in (A). Controls include animals with DLS control injections and GFP expression in DLS-projecting motor cortex neurons (n = 3 each; fig. S1, F and G). Left: Fraction of trials with IPIs close to the target (700 ms ± 20%). Initially, DMS-lesioned animals have lower learning rates than controls [repeated measures analysis of variance (RM-ANOVA) on blocks of 3000 trials: blocks 3000 to 6000 (P = 0.037), 6000 to 9000 (P = 0.013)] but show no differences or higher performance late in training. For detailed statistical comparison between all groups, see table S1. Right: Fraction of trials with ITIs above threshold (1.2 s) (fig. S1C and table S1). (C) Fraction of animals reaching the learning criterion and number of trials needed (Materials and Methods) (17). Comparing control and DMS animals (DLS and MC → DLS animals did not reach criterion) shows no significant difference in number of trials (unpaired t test; P = 0.922) or the cumulative curves (KS test; P = 1). (D) Distributions of durations between lever-presses for animals shown in (A) early (first 2000 trials) and late (trials 30,000 to 32,000) in training. (E) Dissimilarity between IPI and ITI distributions early and late in training as measured by the Jensen-Shannon (JS) divergence. For statistical details, see table S2 and fig. S3A for further comparison of the manipulations. Bars show means, dots show individual animals, and error bars show SEM. *P < 0.05 and ***P < 0.001.
Fig. 3.
Fig. 3.. Pharmacological reversal of plasticity at excitatory synapses in DLS, but not DMS or motor cortex, disrupts execution of the learned skill.
(A) Representative expert animals injected with ZIP, an inhibitor of an enzyme necessary for maintaining synaptic plasticity at excitatory synapses, in either motor cortex, DMS or DLS (see Results, Materials and Methods, and fig. S5). Shown are heatmaps of probability distributions of IPIs and ITIs before and after ZIP injections (5 days post-surgery recovery between pre and post). (B) Population results for manipulations as in (A), normalized to performance before the manipulation. Control animals received injections of retrobeads in vehicle into DLS. Left: Fraction of trials with IPI close to target (700 ms ± 20%). Right: Fraction of trials with ITI above threshold (1.2 s) (see fig. S5). (C) Distributions of durations between lever-presses for animals shown in (A). Pre-ZIP, last 2000 trials before ZIP; post-ZIP, first 2000 trials after ZIP. (D) JS divergence as a measure of dissimilarity between IPI and ITI distributions in the conditions in (A). For statistical details, see table S3 and fig. S3C for further comparison of the manipulation effects. Bars show means, dots show individual animals, and error bars show SEM. **P < 0.01.
Fig. 4.
Fig. 4.. Silencing DLS-projecting thalamus but not motor cortex neurons in expert animals disrupts performance of learned motor skills.
(A) Representative expert animals with silenced DLS-projecting neurons either in motor cortex (MC → DLS) or thalamus (Th → DLS) or control virus injections (see Results, Materials and Methods, and fig. S6). Shown are heatmaps of IPI and ITI probability distributions pre- and post-silencing (5 days post-surgery recovery between pre and post). (B) Population results for manipulations as in (A), normalized to performance before manipulation. Left: Fraction of trials with IPI close to target (700 ms ± 20%). Right: Fraction of trials with ITI above the threshold (1.2 s). Controls include animals expressing GFP in neurons either in motor cortex or thalamus projecting to DLS (n = 3 each) (see also fig. S6C). (C) Distributions of durations between lever-presses for animals shown in (A). Pre, last 2000 trials before silencing; post, first 2000 trials after silencing. (D) JS divergence as a measure of dissimilarity between IPI and ITI distributions for the same conditions as in (A). For statistical details, see table S4 and fig. S3D for further comparison of the manipulation effects. Bars show means, dots show individual animals, and error bars show SEM. **P < 0.01, ***P < 0.001.
Fig. 5.
Fig. 5.. Silencing DLS-projecting thalamus neurons causes loss of idiosyncratic learned movement patterns and regression to simpler lever-pressing behaviors common across animals.
(A) Effects of Th → DLS silencing (Fig. 4 and fig. S6) on lever-press–related forelimb movements. A representative animal’s average trajectories (vertical position) for dominant (first press) and nondominant forelimbs before/after silencing (averaged trials in range: mean IPI ± 30 ms). Arrows indicate presses. (B) Vertical forelimb position (color coded) of subselected trials (mean IPI ± 200 ms) of animal in (A) before/after silencing, sorted by IPI. Lines mark presses. (C) Pairwise correlations between trajectories [linearly time-warped (Materials and Methods)] from (B), averaged across forelimbs. Dotted lines correspond to bars in (D). (D) Averages of within-animal correlations [see (C)] by condition (pre-to-pre, post-to-post, and pre-to-post). Dots, individuals; bars, average across animals. (E) As (A), for all animals before/after silencing. (F) As (B), for trials (randomly selected, 150 per animal) of all animals before/after silencing. (G) Pairwise correlations between trials from (F), averaged across forelimbs, and per animal. Dotted lines correspond to bars in (H). (H) Averages of correlations in (G) by condition (pre-to-pre, post-to-post, and pre-to-post). Bars, average across animals; dots, animal-to-animal comparisons, corresponding to squares in (G). (I) Average trajectories during presses for all animals early in training, before and after silencing. (J) Averages of correlations for all presses in all trials of all animals within and across conditions in (I). Bars, average across presses for all animals; dots, individual press-to-press comparisons (average press 1 and 2 for four animals: 64 comparisons per condition). Statistics in table S5. Bar graphs: Means ± SEM. *P < 0.05, **P < 0.01, and ***P < 0.001.

Similar articles

Cited by

References

    1. Arber S., Costa R. M., Connecting neuronal circuits for movement. Science 360, 1403–1404 (2018). - PubMed
    1. Makino H., Hwang E. J., Hedrick N. G., Komiyama T., Circuit mechanisms of sensorimotor learning. Neuron 92, 705–721 (2016). - PMC - PubMed
    1. Hunnicutt B. J., Jongbloets B. C., Birdsong W. T., Gertz K. J., Zhong H., Mao T., A comprehensive excitatory input map of the striatum reveals novel functional organization. eLife 5, e19103 (2016). - PMC - PubMed
    1. Lanciego J. L., Luquin N., Obeso J. A., Functional neuroanatomy of the basal ganglia. Cold Spring Harb. Perspect. Med. 2, a009621 (2012). - PMC - PubMed
    1. Alexander G. E., DeLong M. R., Strick P. L., Parallel organization of functionally segregated circuits linking basal ganglia and cortex. Annu. Rev. Neurosci. 9, 357–381 (1986). - PubMed