. 2022 Feb 25;8(8):eabm5900.
doi: 10.1126/sciadv.abm5900. Epub 2022 Feb 25.

Identification of kidney injury released circulating osteopontin as causal agent of respiratory failure

Affiliations

Identification of kidney injury released circulating osteopontin as causal agent of respiratory failure

Fatima Zohra Khamissi et al. Sci Adv. .

Abstract

Tissue injury can drive secondary organ injury; however, mechanisms and mediators are not well understood. To identify interorgan cross-talk mediators, we used acute kidney injury (AKI)-induced acute lung injury (ALI) as a clinically important example. Using kidney and lung single-cell RNA sequencing after AKI in mice followed by ligand-receptor pairing analysis across organs, kidney ligands to lung receptors, we identify kidney-released circulating osteopontin (OPN) as a novel AKI-ALI mediator. OPN release from kidney tubule cells triggered lung endothelial leakage, inflammation, and respiratory failure. Pharmacological or genetic OPN inhibition prevented AKI-ALI. Transplantation of ischemic wt kidneys caused AKI-ALI, but not of ischemic OPN-global knockout kidneys, identifying kidney-released OPN as necessary interorgan signal to cause AKI-ALI. We show that OPN serum levels are elevated in patients with AKI and correlate with kidney injury. Our results demonstrate feasibility of using ligand-receptor analysis across organs to identify interorgan cross-talk mediators and may have important therapeutic implications in human AKI-ALI and multiorgan failure.


Figures
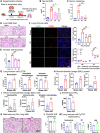
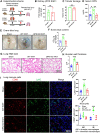
Fig. 1.
Fig. 1.. Ischemic AKI causes severe ALI.
(A) Experimental scheme: AKI ➔ AKI-ALI model sham, days 1, 3, and 5 after AKI. (B) Serum BUN values after sham or AKI, days 1 to 5. (C) Serum creatinine values after sham or AKI, days 1 to 5. (D) Hematoxylin and eosin (H&E) stain lung after sham or AKI, days 1 to 5. (E) Alveolar wall thickness measurements after sham or AKI, days 1 to 5. (F) Lung neutrophils (Ly6G+, green), alveolar macrophages (AMs) (CD68high, large, red), and IMs (CD68low, small, red) and quantification after sham or AKI, days 1 to 5. 4′,6-diamidino-2-phenylindole (DAPI) stain (blue) was used to visualize nuclei. (G) CyTOF: lung neutrophils (CD45+ and Ly6G+), alveolar macrophages (CD45+, CD68high, and Siglec-F+), and lung IMs (CD45+, CD68low, and Siglec-F), day 1. (H) BAL protein/albumin analysis: serum BUN elevations and BAL fluid protein/albumin after sham or AKI, day 1. Total protein was detected by the Pierce BCA Protein Assay. Albumin was detected by enzyme-linked immunosorbent assay (ELISA). (I) BAL immune cell analysis: Total immune cells, macrophages, and neutrophils were detected by fluorescence-activated cell sorting (FACS). (J) Arterial blood oxygen partial pressure (PO2) after sham or AKI, day 1. (K) Lung hematoxylin and eosin after sham or nephrectomy (Nx), day 1. (L) Alveolar wall thickness after sham or nephrectomy, day 1. (M) CyTOF: Lung neutrophils (CD45+ and Ly6G+), alveolar macrophages (CD45+, CD68high, and Siglec-F), and lung IMs (CD45+, CD68low, and Siglec-F) were quantified after sham or nephrectomy, day 1. n = 4 to 8 animals per measurement. *P < 0.05, **P < 0.01, ***P < 0.001, #P < 0.05, ##P < 0.01, and ###P < 0.001. NS, not significant.
Fig. 2.
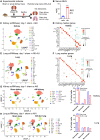
Fig. 2.. scRNAseq of kidney and lung in setting of AKI-ALI.
(A) Experimental scheme: scRNAseq 10x Genomics of kidney and lung day 1 after sham or AKI. (B) Serum BUN values after sham or AKI, day 1. (C) Seurat object: combined kidney sham and AKI, day 1. (D) Marker genes used for definition of kidney cell types. (E) Seurat object: combined lung sham and AKI-ALI lung, day 1. (F) Marker genes used for definition of lung cell types. (G) Seurat objects: sham kidney versus AKI kidney, day 1, quantification of neutrophils, monocytes, and macrophages in sham or AKI samples expressed as the percentage of total cells detected by Seurat. (H) Seurat objects: sham lung versus AKI-ALI lung, day 1, quantification of neutrophils, monocytes, and macrophages in sham or AKI samples expressed as the percentage of total cells detected by Seurat. Cell types: epithelial: AT1/2, type 1/2 lung epithelial cell; PT, proximal tubule; TAL, thick ascending limb; DTL, descending-type thin limb; ATL, ascending-type thin limb. Endothelial: EC, endothelial cell (a, arterial; v, venous; c, capillary). Stromal: FIB, fibroblast; PERI, pericyte. Immune cells: NT, neutrophil; DC, dendritic cell; MΦ, macrophage; AM; IM; Mono, monocyte; MegaK, megakaryocyte; Plasma B, plasma B cell; B cell; T cell. n = 4 animals per measurement. ***P < 0.001.
Fig. 3.
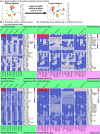
Fig. 3.. L-R pairing analysis across organs, linking ligands expressed in the kidney to receptors expressed in the lung.
(A) Experimental scheme: design of L-R pairing analysis, kidney ligands paired to lung receptors using kidney and lung scRNAseq data and CellPhoneDB analysis. (B) L-R pairing analysis kidney nonimmune cells to lung nonimmune cells for day 1 after sham (panel 1) or AKI (panel 2). P values shown are empirical P values calculated by CellPhoneDB, and higher values indicate higher L-R pairing significance.
Fig. 4.
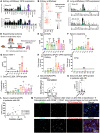
Fig. 4.. OPN is up-regulated in kidneys but not lungs during AKI-ALI.
(A) Kidney scRNAseq: OPN expression after sham (top) or AKI (bottom). (B) Kidney snRNAseq (20): OPN expression after sham or 4 hours, 12 hours, 2 days, 14 days, and 6 weeks after AKI. (C) Lung scRNAseq: OPN expression after sham (top) or AKI (bottom). (D) Experimental scheme: AKI ➔ AKI-ALI model. Sham, 1, 2, 4, and 12 hours after AKI. We integrated measurements from days 1, 3, and 5 after AKI (Fig. 1) in some panels of Fig. 4. (E) Serum BUN after sham or 1 to 12 hours and days 1, 3, and 5 after AKI. (F) Serum creatinine after sham or 1 to 12 hours and days 1, 3, and 5 after AKI. (G) Serum KIM-1 after sham or 1 to 12 hours and days 1, 3, and 5 after AKI. (H) Kidney + lung quantitative polymerase chain reaction (qPCR): OPN expression after sham or 1 to 12 hours and days 1, 3, and 5 after AKI. (I) Serum ELISA: OPN protein after sham or 1 to 12 hours and days 1, 3, and 5 after AKI. (J) Serum BUN/OPN correlation using BUN and OPN measurements across all time points. (K) Serum ELISA: human OPN protein levels in patients with AKI compared to healthy controls and patients with chronic kidney disease (CKD). (L) Correlation of OPN serum levels with serum creatinine concentration in patients with AKI. (M) Colocalization of OPN Alexa Fluor 555 (Alexa 555) with CD68+/CD44+ alveolar macrophages (fat arrows) and IMs (thin arrows) but not with Ly6G+ neutrophils. Arrows show colocalization with CD68/CD44. n = 3 to 8 animals per measurement. *P < 0.05, **P < 0.01, and ***P < 0.001. ND, not detected; i.v., intravenous.
Fig. 5.
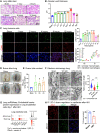
Fig. 5.. AKI triggers lung endothelial barrier dysfunction and immune cell accumulation very early after AKI.
(A) Lung hematoxylin and eosin stain after sham or 1 to 12 hours after AKI. (B) Alveolar wall thickness measurements after sham or 1 to 12 hours and days 1, 3, and 5 after AKI. (C) Lung neutrophils (Ly6G+, green), alveolar macrophages (CD68high, large, red), and IMs (CD68low, small, red) and quantification after Sham or AKI days 1, 3, and 5 after AKI. DAPI stain (blue) was used to visualize nuclei. (D) Lung Evans blue leakage after sham or 1 to 4 hours after AKI. (E) Lung Evans blue quantification [optical density at 620 nm (OD620) per gram of lung dry weight] after sham or 1 to 4 hours after AKI. (F) Lung electron microscopy and quantification of endothelial tight junction length (in nanometers) at day 1 in sham or day 1 after AKI in wt control or OPN–global KO mice. (G) Lung scRNAseq: expression of endothelial barrier proteins in lung endothelial cells day 1 after sham or AKI; Tjp1: zonula occludens-1 (ZO-1) and claudin-5 (Cdnl5). (H) Lung ZO-1 protein expression [immunofluorescence (IF)]: ZO-1 (red), CD31 (green, marking endothelial cells), DAPI (blue, marking nucleus), and quantification day 1 after sham or AKI. (I) Lung qPCR: ZO-1 expression day 1 after sham or AKI. n = 3 to 6animals per measurement. *P < 0.05, **P < 0.01, and ***P < 0.001.
Fig. 6.
Fig. 6.. Pharmacological or genetic inhibition of OPN protects from ALI after AKI.
(A) Experimental scheme: AKI ➔ AKI-ALI model day 1 after AKI. In the following, wt mice injected with control goat IgG are compared to OPN neutralizing antibody (OPN Nab) injected mice, and OPN–global KO animals (OPN KO) are compared to wt controls. i.p., intraperitoneal. (B) Serum BUN values after sham or AKI, day 1. (C) Serum KIM-1 values after sham or AKI, day 1. (D) Lung hematoxylin and eosin stain after sham or AKI, day 1. (E) Alveolar wall thickness measurements after sham or AKI, day 1. (F) Lung neutrophils (Ly6G+, green), alveolar macrophages (CD68high, large, red), and IMs (CD68low, small, red) and quantification after sham or AKI, day 1. DAPI stain (blue) was used to visualize nuclei. (G) Lung Evans blue leakage day 1 after sham or AKI. (H) Lung Evans blue quantification (OD620 per gram of lung dry weight) day 1 after sham or AKI. (I) Arterial blood oxygen partial pressure after Sham or AKI, day 1. n = 3 to 8 animals per measurement. *P < 0.05, **P < 0.01, and ***P < 0.001.
Fig. 7.
Fig. 7.. Circulating OPN is sufficient to induce ALI after AKI.
(A) Experimental scheme: AKI ➔ AKI-ALI model evaluated 6 hours after mild AKI (reduced ischemia time). Mice with mild AKI are injected with vehicle control or OPN protein, and severe AKI is used as a control. (B) Serum ELISA: OPN protein 6 hours after sham, severe AKI (positive control), or mild AKI. (C) Serum BUN 6 hours after sham, mild AKI ± OPN injection, or severe AKI (positive control). (D) Lung hematoxylin and eosin stain 6 hours after sham, mild AKI ± OPN injection, or severe AKI (positive control). (E) Alveolar wall thickness measurements 6 hours after sham, mild AKI ± OPN injection, or severe AKI (positive control). n = 3 to 4 animals per measurement. *P < 0.05, **P < 0.01, ***P < 0.001, and #P < 0.05.
Fig. 8.
Fig. 8.. Circulating OPN relevant for induction of AKI-ALI is released from the injured kidney.
(A) Experimental scheme: Ischemic kidney transplantation. C57BL/6 wt or OPN–global KO kidneys were transplanted into C57BL/6 wt mice (“WT-WT” or “OPN KO-WT”). (B) Kidney qPCR: KIM-1 expression in WT-WT and OPN KO-WT day 1 after transplant. (C) Tubular injury score WT-WT or OPN KO-WT day 1 after transplant. (D) Serum ELISA: OPN protein in WT-WT and OPN KO-WT day 1 after transplant. (E) Lung Evans blue leakage in lungs of WT-WT and OPN KO-WT day 1 after transplant. (F) Lung Evans blue quantification (OD620 per gram of lung dry weight) in WT-WT and OPN KO-WT day 1 after transplant. (G) Lung hematoxylin and eosin stain of WT-WT and OPN KO-WT day 1 after transplant. (H) Alveolar wall thickness measurements of WT-WT and OPN KO-WT day 1 after transplant. (I) Lung neutrophils (Ly6G+, green), alveolar macrophages (CD68high, large, red), and IMs (CD68low, small, red) and quantification in WT-WT and OPN KO-WT day 1 after transplant. DAPI stain (blue) was used to visualize nuclei. n = 4 to 7 animals per measurement. *P < 0.05, **P < 0.01, and ***P < 0.001.
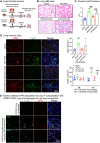
Fig. 9.
Fig. 9.. Circulating OPN released from the injured kidney reverses protection of OPN-KO mice from AKI-ALI.
(A) Experimental scheme: Ischemic kidney transplantation. wt kidneys were transplanted into wt or OPN–global KO mice (WT-WT or “WT-OPN KO”). (B) Lung hematoxylin and eosin stain at day 1 after transplant for WT-WT and WT-OPN KO. Sham lung and OPN KO-WT (see also Fig. 8A) are shown for comparison. (C) Alveolar wall thickness measurements on day 1 after transplant. (D) Lung neutrophils (Ly6G+, green), alveolar macrophages (CD68high, large, red), and IMs (CD68low, small, red) and quantification in lungs of sham-operated mice, WT-WT, OPN KO-WT, or WT-OPN KO day 1 after transplant. DAPI stain (blue) was used to visualize nuclei. (E) Colocalization of endogenous OPN released from transplant with CD68+/CD44+ alveolar macrophages (fat arrows) and IMs (thin arrows) but not with Ly6G marker (neutrophils). Arrows show colocalization with CD68/CD44. n = 4 to 7 animals per measurement. *P < 0.05, **P < 0.01, ***P < 0.001, and ###P < 0.005.

References

    1. Zhou X., Franklin R. A., Adler M., Jacox J. B., Bailis W., Shyer J. A., Flavell R. A., Mayo A., Alon U., Medzhitov R., Circuit design features of a stable two-cell system. Cell 172, 744–757.e17 (2018). - PMC - PubMed
    1. Rouault H., Hakim V., Different cell fates from cell-cell interactions: Core architectures of two-cell bistable networks. Biophys. J. 102, 417–426 (2012). - PMC - PubMed
    1. Bonnans C., Chou J., Werb Z., Remodelling the extracellular matrix in development and disease. Nat. Rev. Mol. Cell Biol. 15, 786–801 (2014). - PMC - PubMed
    1. Bich L., Pradeu T., Moreau J.-F., Understanding multicellularity: The functional organization of the intercellular space. Front. Physiol. 10, 1170 (2019). - PMC - PubMed
    1. Teixeira J. P., Ambruso S., Griffin B. R., Faubel S., Pulmonary consequences of acute kidney injury. Semin. Nephrol. 39, 3–16 (2019). - PubMed

Publication types