. 2022 Feb 25;8(8):eabf9096.
doi: 10.1126/sciadv.abf9096. Epub 2022 Feb 25.

Metabolic profiling of prostate cancer in skeletal microenvironments identifies G6PD as a key mediator of growth and survival

Affiliations

Metabolic profiling of prostate cancer in skeletal microenvironments identifies G6PD as a key mediator of growth and survival

Jessica Whitburn et al. Sci Adv. .

Abstract

The spread of cancer to bone is invariably fatal, with complex cross-talk between tumor cells and the bone microenvironment responsible for driving disease progression. By combining in silico analysis of patient datasets with metabolomic profiling of prostate cancer cells cultured with bone cells, we demonstrate the changing energy requirements of prostate cancer cells in the bone microenvironment, identifying the pentose phosphate pathway (PPP) as elevated in prostate cancer bone metastasis, with increased expression of the PPP rate-limiting enzyme glucose-6-phosphate dehydrogenase (G6PD) associated with a reduction in progression-free survival. Genetic and pharmacologic manipulation demonstrates that G6PD inhibition reduces prostate cancer growth and migration, associated with changes in cellular redox state and increased chemosensitivity. Genetic blockade of G6PD in vivo results in reduction of tumor growth within bone. In summary, we demonstrate the metabolic plasticity of prostate cancer cells in the bone microenvironment, identifying the PPP and G6PD as metabolic targets for the treatment of prostate cancer bone metastasis.


Figures
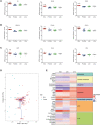
Fig. 1.
Fig. 1.. The bone microenvironment alters the metabolic profile of prostate cancer cells.
In silico analysis of primary and metastatic prostate cancer, comparing three genes from each of the TCA (A), OXPHOS (B), and PPP (C) pathways in primary prostate cancer and bone, liver, and lung metastatic sites. *P < 0.05, **P < 0.01, ***P < 0.001, ****P < 0.0001 as compared to primary prostate cancer. Statistical test used: one-way analysis of variance (ANOVA) with post hoc Tukey’s test. Error bars = SEM. (D) Principal components analysis plot of PPP genes in bone metastatic and primary prostate cancer. (E) PC3 cells were cocultured for 24 hours with HS5, ST2, or 2T3 bone stromal cells, and metabolite levels were measured with capillary electrophoresis mass spectrometry (CE-MS). Heatmap identifies metabolites with the highest fold change after coculture. FH, fumarate hydratase; SDHB, succinate dehydrogenase B; MDH2, malate dehydrogenase 2; NDUFA11, NADH:Ubiquinone Oxidoreductase subunit A11; COX4I2, cytochrome c oxidase subunit 4 isoform 2; ATP5C1, ATP synthase F1 subunit gamma; FBP1, fructose-bisphosphatase 1; PGLS, 6-phosphogluconolactonase; RPE, ribulose-5-phosphate-3-epimerase.
Fig. 2.
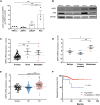
Fig. 2.. G6PD is overexpressed in bone metastatic prostate cancer.
(A) mRNA expression of G6PD in different prostate cell lines. Statistical test used: one-way ANOVA with post hoc Tukey’s test. *P < 0.05 and **P < 0.01. Error bars = SEM. (B) Protein expression of PPP enzymes from benign (PNT1a), non–bone metastatic (22RV1, LNCaP), and bone metastatic prostate cancer cells lines [PC3, MDA PCA 2a (MDA-2a)]. (C) mRNA expression z scores of G6PD in patient samples from the Taylor 2010 dataset. Statistical test used: one-way ANOVA with Tukey’s post hoc test. (D) mRNA expression z scores of G6PD in patient samples from the Varambally 2005 dataset. Statistical test used: one-way ANOVA with Tukey’s post hoc test. (E) mRNA expression z scores of G6PD in patient samples from the Grasso 2012 dataset. HD, hormone dependent; CR, castrate resistant. Statistical test used: one-way ANOVA with Tukey’s post hoc test. (F) Progression-free survival curve in patient samples from the TCGA PanCancer Atlas dataset. Expression of G6PD was stratified into high expression (>2 SD from mean) and no alteration (<2 SD from mean). Statistical test used: Log-rank (Mantel-Cox) test. *P < 0.05, **P < 0.01, and ****P < 0.0001. Error bars = SEM.
Fig. 3.
Fig. 3.. The bone microenvironment increases G6PD expression in prostate cancer cells via IL-6.
(A) G6PD protein expression in LNCaP cells after transwell coculture with HS5 bone marrow stromal cells. (B) Effect of treatment of LNCaP cells with control (RPMI), 50% LNCaP CM, 50% coculture CM, or 50% HS5 CM on G6PD protein expression after 72 hours. (C) Increasing the proportion of HS5 CM increases G6PD protein expression in C4-2B cells at 72 hours. Densitometry quantification of G6PD band normalized to β-actin. (D) LNCaP cells treated with an increasing proportion of HS5 CM for 72 hours. G6PD mRNA levels examined by quantitative polymerase chain reaction (qPCR; normalized to Polr2a and control). (E) LNCaP cells treated with fresh RPMI or 50% CM from HS5, HS27A, or MS5 bone marrow stromal cells for 72 hours. (F) mRNA expression of G6PD normalized to Polr2a after 72-hour treatment with 50% HS5 or 50% HS27A CM. (G) qPCR of human IL-6 levels in HS5 and HS27A cells normalized to glyceraldehyde-3-phosphate dehydrogenase (GAPDH). (H) IL-6 expression in CM from prostate cancer cells (PC3, LNCaP, and C4-2B) and human stromal cell lines (HS5, HS27A). (I) LNCaP cells were treated for 72 hours with complete RPMI (Control), IL-6 (250 ng/ml), IL-6 (1000 ng/ml), or 50% HS5 CM and G6PD mRNA expression analyzed by qPCR (normalized to Polr2a). (J) HS5 CM (50%) activates p-STAT3 signaling in LNCaP and C4-2B cells. (K) LNCaP cells treated with 50% HS5 CM ± immunoglobulin G (IgG; 10 μg/ml) ± IL-6 neutralizing antibody (anti–IL-6; 10 μg/ml) for 72 hours. (L) Densitometry of G6PD band of LNCaP treated with 50% HS5 CM ± IgG (10 μg/ml) ± IL-6 neutralizing antibody (anti–IL-6; 10 μg/ml) for 72 hours. (M) Densitometry of p-STAT3 band of LNCaP treated with 50% HS5 CM ± IgG (10 μg/ml) ± IL-6 neutralizing antibody (anti–IL-6; 10 μg/ml) for 72 hours. *P < 0.05, **P < 0.01, ***P < 0.001, and ****P < 0.0001 as compared to control. Data represent means ± SEM.
Fig. 4.
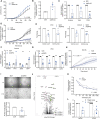
Fig. 4.. G6PD expression regulates bone metastatic prostate cancer growth and migration.
(A) LNCaP control (BFP) or G6PD overexpressing (OE) cells, proliferation measured via IncuCyte system. Statistical test used: two-way ANOVA. (B) LNCaP BFP or G6PD OE cells’ colony formation. (C) LNCaP BFP or G6PD OE cells’ mRNA expression of EMT markers normalized to Polr2a. ***P < 0.001 as compared to BFP control. (D) Cell proliferation of DU145 measured via IncuCyte system. Statistical test used: two-way ANOVA. (E) Colony formation assay of SCR and shG6PD cells. *P < 0.05, **P < 0.01, and ***P < 0.001 as compared to SCR control. (F and G) mRNA expression of mesenchymal (Vimentin, Twist, and ZEB2) and epithelial (CDH1) markers SCR and shG6PD KD cells. Expression normalized to the housekeeping gene Polr2a and SCR control. *P < 0.05, **P < 0.01, and ***P < 0.001. (H) Relative scratch wound confluency. Statistical test used: two-way ANOVA. (I) Transwell migration assay at 24 hours. Migrated cell number normalized to SCR control. **P < 0.01. (J) RNA sequencing was performed on PC3-SCR control and G6PD knockdown. Volcano plot showing most differentially expressed genes (−log10Padj > 100). (K) Cell viability after 24-hour treatment with 6-aminonicotinamide (6-AN). Statistical test used: two-way ANOVA with Sidak’s post hoc test. (L) Viability after treatment with 100 nM 6-AN for 72 hours in single culture or transwell coculture measured by Alamar Blue assay after the removal of the transwell normalized to untreated control. *P < 0.05 and **P < 0.01 as compared to single culture. Error bars = SEM.
Fig. 5.
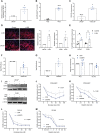
Fig. 5.. Bone marrow stromal cells and G6PD regulate the cellular redox state and chemosensitivity of bone metastatic prostate cancer cells.
(A) GSH levels in the non–bone metastatic LNCaP cell line and the bone metastatic PC3 cell line. *P = < 0.05. (B) NADPH/NADP+ ratio in PC3 cells after 24-hour coculture with HS5 cells measured by CE-MS. ****P < 0.0001. (C) GSH levels in LNCaP cells after 72-hour treatment with HS5 CM, normalized to Alamar blue fluorescence. *P = < 0.05. (D) Mitochondrial ROS after 72 hours coculture with HS5 cells. Blue = Hoechst nuclear staining. Red = MitoSox mitochondrial ROS staining. Merged images taken on a Nikon Eclipse TE300 inverted microscope at 4× magnification. Images and values representative of three biological repeats. Quantified by MitoSox fluorescence reading and normalized to Hoechst fluorescence. *P = < 0.05. (E) Total ROS after 48-hour treatment with 100 nM 6-AN normalized to untreated control. *P = < 0.05. (F) Total ROS in G6PD OE cells normalized to BFP control *P = < 0.05. (G) Total ROS levels in PC3 SCR and shG6PD KD cells. (H) GSH levels in SCR and shG6PD KD cells. *P = < 0.05. (I) G6PD protein expression after 48-hour treatment with 50% HS5 CM ± 10 mM NAC. Blots representative of three biological repeats. (J to M) Cell viability in scrambled (SCR) and shG6PD KD (shG6PD) cells treated with docetaxel or cisplatin. Statistical test used for (J) to (M): two-way ANOVA with Sidak’s multiple comparisons post hoc test. *P < 0.05, ***P < 0.001 as compared to SCR. Error bars = SEM.
Fig. 6.
Fig. 6.. G6PD knockdown inhibits prostate cancer growth in bone in vivo.
A total of 1 × 10⁵ PC3-EGFP SCR or shG6PD cells were inoculated into the tibias of 5-week-old SCID mice and tumor burden was monitored by fluorescence at the proximal tibia over time (n = 7). (A) Fluorescence values as measured in vivo by the IVIS imager at weeks 1 and 3. Statistical test used: one-way ANOVA with Tukey post hoc test. *P = < 0.05. (B) Tumor burden within bone was quantitated by immunohistochemistry and histomorphometry, with tumor cells visualized by GFP expression. Statistical test used: Mann-Whitney U test. ***P < 0.001. (C) Apoptotic tumor cells were identified by dual positivity for GFP and TUNEL. Statistical test used: Mann-Whitney U test. *P < 0.05. Error bars = SEM.

References

    1. National Cancer Institute Surveillance, Epidemiology, and End Results Program: Cancer Stat Facts: Prostate Cancer [Internet]. [cited 23 Nov 2020]; https://seer.cancer.gov/statfacts/html/prost.html.
    1. Tangen C. M., Hussain M. H. A., Higano C. S., Eisenberger M. A., Small E. J., Wilding G., Donnelly B. J., Schelhammer P. F., Crawford E. D., Vogelzang N. J., Powell I. J., Thompson I. M. Jr., Improved overall survival trends of men with newly diagnosed M1 prostate cancer: A SWOG phase III trial experience (S8494, S8894 and S9346). J. Urol. 188, 1164–1169 (2012). - PMC - PubMed
    1. Nuhn P., De Bono J. S., Fizazi K., Freedland S. J., Grilli M., Kantoff P. W., Sonpavde G., Sternberg C. N., Yegnasubramanian S., Antonarakis E. S., Update on systemic prostate cancer therapies: Management of metastatic castration-resistant prostate cancer in the era of precision oncology. Eur. Urol. 75, 88–99 (2019). - PubMed
    1. Marin-Aguilera M., Codony-Servat J., Kalko S. G., Fernandez P. L., Bermudo R., Buxo E., Ribal M. J., Gascón P., Mellado B., Identification of docetaxel resistance genes in castration-resistant prostate cancer. Mol. Cancer Ther. 11, 329–339 (2012). - PubMed
    1. Bubendorf L., Schöpfer A., Wagner U., Sauter G., Moch H., Willi N., Gasser T. C., Mihatsch M. J., Metastatic patterns of prostate cancer: An autopsy study of 1,589 patients. Hum. Pathol. 31, 578–583 (2000). - PubMed

Publication types

Substances