. 2022 Feb 25;17(2):e0264143.
doi: 10.1371/journal.pone.0264143. eCollection 2022.

Using RDNA sequences to define dinoflagellate species

Affiliations

Using RDNA sequences to define dinoflagellate species

Brittany M Ott et al. PLoS One. .

Abstract

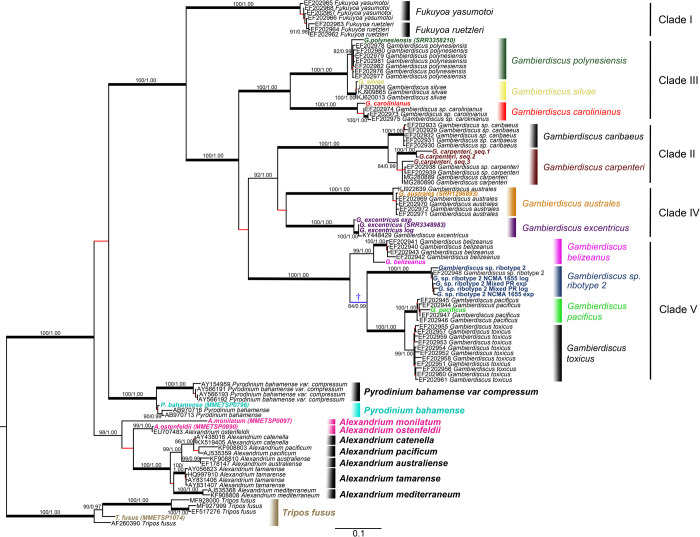
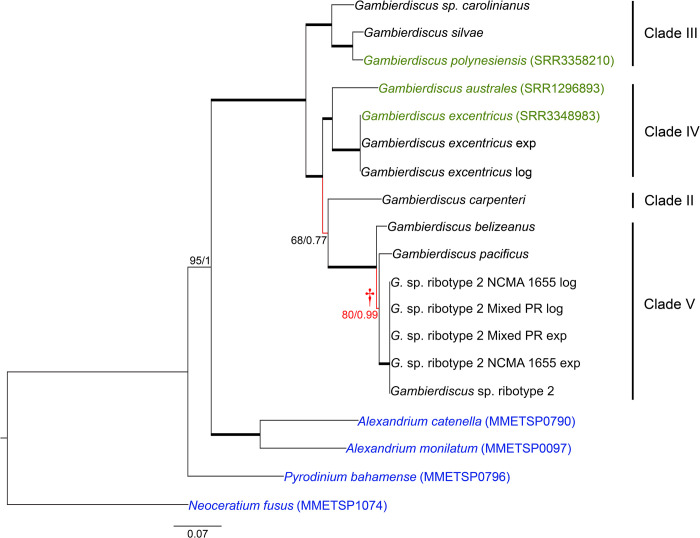
Dinoflagellate species are traditionally defined using morphological characters, but molecular evidence accumulated over the past several decades indicates many morphologically-based descriptions are inaccurate. This recognition led to an increasing reliance on DNA sequence data, particularly rDNA gene segments, in defining species. The validity of this approach assumes the divergence in rDNA or other selected genes parallels speciation events. Another concern is whether single gene rDNA phylogenies by themselves are adequate for delineating species or if multigene phylogenies are required instead. Currently, few studies have directly assessed the relative utility of multigene versus rDNA-based phylogenies for distinguishing species. To address this, the current study examined D1-D3 and ITS/5.8S rDNA gene regions, a multi-gene phylogeny, and morphological characters in Gambierdiscus and other related dinoflagellate genera to determine if they produce congruent phylogenies and identify the same species. Data for the analyses were obtained from previous sequencing efforts and publicly available dinoflagellate transcriptomic libraries as well from the additional nine well-characterized Gambierdiscus species transcriptomic libraries generated in this study. The D1-D3 and ITS/5.8S phylogenies successfully identified the described Gambierdiscus and Alexandrium species. Additionally, the data showed that the D1-D3 and multigene phylogenies were equally capable of identifying the same species. The multigene phylogenies, however, showed different relationships among species and are likely to prove more accurate at determining phylogenetic relationships above the species level. These data indicated that D1-D3 and ITS/5.8S rDNA region phylogenies are generally successful for identifying species of Gambierdiscus, and likely those of other dinoflagellates. To assess how broadly general this finding is likely to be, rDNA molecular phylogenies from over 473 manuscripts representing 232 genera and 863 described species of dinoflagellates were reviewed. Results showed the D1-D3 rDNA and ITS phylogenies in combination are capable of identifying 97% of dinoflagellate species including all the species belonging to the genera Alexandrium, Ostreopsis and Gambierdiscus, although it should be noted that multi-gene phylogenies are preferred for inferring relationships among these species. A protocol is presented for determining when D1-D3, confirmed by ITS/5.8S rDNA sequence data, would take precedence over morphological features when describing new dinoflagellate species. This protocol addresses situations such as: a) when a new species is both morphologically and molecularly distinct from other known species; b) when a new species and closely related species are morphologically indistinguishable, but genetically distinct; and c) how to handle potentially cryptic species and cases where morphotypes are clearly distinct but have the same rDNA sequence. The protocol also addresses other molecular, morphological, and genetic approaches required to resolve species boundaries in the small minority of species where the D1-D3/ITS region phylogenies fail.


Conflict of interest statement

The authors have read the journal’s policy and have the following competing interests: R. Wayne Litaker is a paid contractor for the National Oceanic and Atmospheric Administration (NOAA).

Figures

Fig 1
Fig 1. Phylogenetic tree of Gambierdiscus using the large ribosomal subunit, D1 to D3, region.
Maximum likelihood tree (generated by RAxML), supported by Bayesian analysis. Branches indicated in red are not supported (ML bootstrap ≤80%; Bayesian posterior probability < 1). Bolded taxa are sequences obtained from high-throughput transcriptomics. Those with an identifier following the name resulted from transcriptomes pulled from NCBI. Branch with lower support (†) indicates a possible single common ancestor of G. belizeanus, G. pacificus, and G. sp. Ribotype 2. Nucleotide tree with 99 taxa. There are 0.1 substitutions per site.
Fig 2
Fig 2. Gambierdiscus, Fukuyoa and Alexandrium ITS/5.8S phylogeny.
Maximum likelihood tree (generated by RAxML). Branches indicated in red are not supported (ML bootstrap ≤80%). Bolded taxa are sequences obtained from high-throughput transcriptomics. Those with an identifier following the name resulted from transcriptomes pulled from NCBI. Nucleotide tree with 81 taxa. There are 0.3 substitutions per site.
Fig 3
Fig 3. Phylogenetic tree of Gambierdiscus using transcriptomes and Core Eukaryotic reference genes.
Maximum likelihood tree (found by RAxML), supported by Bayesian analysis. Branches indicated in red are not supported (ML bootstrap ≤80%; Bayesian posterior probability < 1). Taxa in green indicate Gambierdiscus transcriptomes obtained from NCBI. Taxa in blue indicate outgroups, whose transcriptomes were also obtained from NCBI. SRA identifiers are found in parentheses next to the taxon name. Branch with low support (†) indicates a possible single common ancestor of G. belizeanus, G. pacificus, and G. sp. ribotype 2. Genes were chosen using the Core Eukaryotic Gene dataset (BUSCO and CEGMA) as reference. Nucleotide tree: 28 genes; 45,828 bp. There are 0.08 substitutions per site.
Fig 4
Fig 4. Phylogenetic tree of Gambierdiscus using transcriptomes and Janouškovec et al., 2017 reference genes.
Maximum likelihood tree (found by RAxML), supported by Bayesian analysis. Branches indicated in red are not supported (ML bootstrap ≤80%; Bayesian posterior probability < 1). Taxa in green indicate Gambierdiscus transcriptomes obtained from NCBI. Taxa in blue indicate outgroups, whose transcriptomes were also obtained from NCBI. SRA identifiers are found in parentheses next to the taxon name. Branch with low support (†) indicates a possible single common ancestor of G. belizeanus, G. pacificus, and G. sp. ribotype 2. Genes were chosen using the genes described in Janouškovec et al., 2017 as reference. Nucleotide tree: 17 genes; 22,743 bp. There are 0.07 substitutions per site.
Fig 5
Fig 5. Diagram illustrating how various morphological and molecular phylogenetic information can be used in describing dinoflagellate species.
Panel A) Example of a case where morphologically distinct isolates from the Pacific region (represented by the brown cell) compared to the morphology of a related, previously described, co-occurring species (represented by the bluish-green cell). The morphological differences were found to be distinct and non-overlapping with previously described species, supporting describing the new isolates as a separate species. Subsequent sequencing and phylogenetic analysis of the D1-D3 and ITS/5.8S regions from isolates of both species fell into distinct, non-overlapping clades. Here, description of the new species based on morphology and supported by the molecular data is warranted. Panel B) represents a situation where the isolates morphologically similar to those of newly described Pacific species (brown cell) were obtained from the Atlantic region. Morphometric analysis showed all the morphological features examined overlap to a significant degree. This state is indicated by the Atlantic isolates having the same shape cell as that shown for newly described Pacific species and a different coloration (pinkish purple). Here morphology alone does not unambiguously support the establishment of the new species. In contrast, the phylogenetic analysis of the D1-D3 and ITS/5.8S regions from the isolates consistently fall into distinct clades, clearly supporting establishment of the Atlantic isolates as a new species. Panel C) shows a situation where additional isolates from both the Atlantic and Pacific were sequenced. With our increasing capacity to carry out affordable sequencing, this will become an ever more common occurrence. In this example, subsequent phylogenetic analysis showed all three species occurred sympatrically in both regions and that in each regions the phylogenies yielded the same distinct species-specific clusters. Though not necessary for describing new species, the continued return of distinct species-specific clusters from regions where the species occur sympatrically provides additional evidence the described species are reproductively isolated.
Fig 6
Fig 6. Schematic diagram showing a decision tree outlining how to weight morphological and rDNA phylogenies when defining dinoflagellate species.
Here each distinct background color corresponds to one of five case studies illustrating the different nuisances in where and how to weight morphology versus D1-D3 and ITS/5.8S sequence information when defining dinoflagellate species. Cases 1a and b include situations where morphology differences between species are largely distinct and rDNA phylogeny supports morphologically the defined species (green background). Case 2 covers species where morphologies are distinct, but rDNA sequences are equivalent (yellow background). Case 3a encompasses species that are poorly defined morphologically, but whose rDNA phylogeny indicates presence of distinct species (salmon background). Case 3b includes those species where morphologies are indistinguishable, but the corresponding rDNA phylogenies show distinct species present (salmon background). Case 4 indicates the small number of species where the morphological and rDNA sequences provide contridictory information and can only be resolved by acquiring additional data (purple background). Case 5 (light blue background) includes those cases where neither the morphology nor rDNA sequences support establishment of a new species. This flow chart is intended for cases where there is at least some reliable data from both morphological and molecular studies; in cases where such evidence is absent or inconclusive, further study should be carried out before naming new species.

References

    1. Stoecker DK. Mixotrophy among Dinoflagellates. J Eukaryot Microbiol. 1999;46: 397–401. doi: 10.1111/j.1550-7408.1999.tb04619.x - DOI
    1. Taylor FJR, Hoppenrath M, Saldarriaga JF. Dinoflagellate diversity and distribution. Biodivers Conserv. 2008;17: 407–418. doi: 10.1007/s10531-007-9258-3 - DOI
    1. Jeong HJ, Yoo YD, Kim JS, Seong KA, Kang NS, Kim TH. Growth, feeding and ecological roles of the mixotrophic and heterotrophic dinoflagellates in marine planktonic food webs. Ocean Sci J. 2010;45: 65–91. doi: 10.1007/s12601-010-0007-2 - DOI
    1. Gómez F. A quantitative review of the lifestyle, habitat and trophic diversity of dinoflagellates (Dinoflagellata, Alveolata). Syst Biodivers. 2012;10: 267–275. doi: 10.1080/14772000.2012.721021 - DOI
    1. Litaker RW, Vandersea MW, Kibler SR, Madden VJ, Noga EJ, Tester PA. Life Cycle of the Heterotrophic Dinoflagellate Pfiesteria piscicida (Dinophyceae). J Phycol. 2002;38: 442–463. doi: 10.1046/j.1529-8817.2002.01242.x - DOI

Publication types