. 2022 Feb 25;17(2):e0264543.
doi: 10.1371/journal.pone.0264543. eCollection 2022.

Ppe.XapF: High throughput KASP assays to identify fruit response to Xanthomonas arboricola pv. pruni (Xap) in peach

Affiliations

Ppe.XapF: High throughput KASP assays to identify fruit response to Xanthomonas arboricola pv. pruni (Xap) in peach

Margaret B Fleming et al. PLoS One. .

Abstract

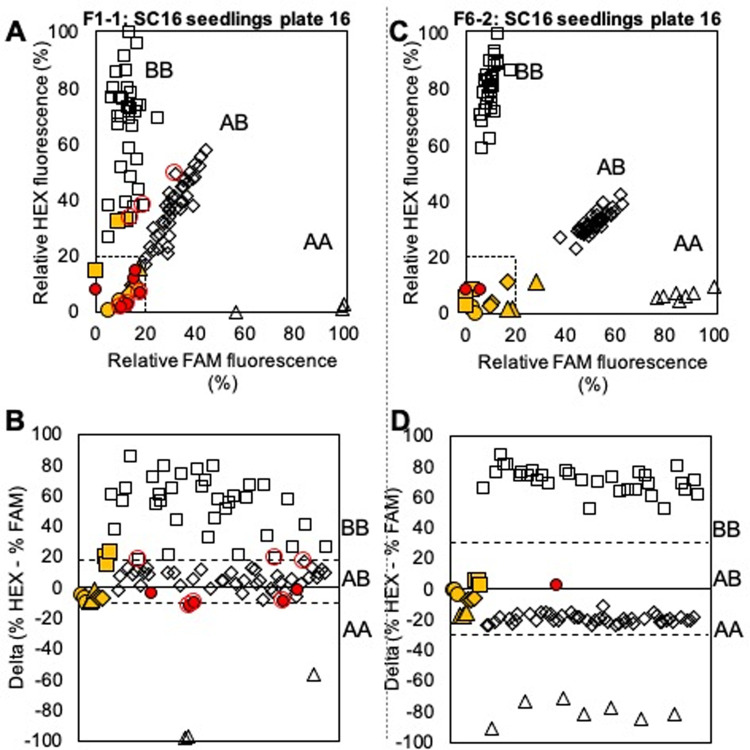
Bacterial spot, caused by Xanthomonas arboricola pv. pruni (Xap), is a serious peach disease with symptoms that traverse severe defoliation and black surface pitting, cracking or blemishes on peach fruit with global economic impacts. A management option for control and meeting consumer demand for chemical-free, environmentally friendly fruit production is the development of resistant or tolerant cultivars. We developed simple, accurate, and efficient DNA assays (Ppe.XapF) based on SNP genotyping with KASP technology to quickly test for bacterial spot resistance alleles in peach fruit that allows breeders to cull seedlings at the greenhouse stage. The objective of this research was to validate newly developed DNA tests that target the two major QTLs for fruit resistance in peach with diagnostic utility in predicting fruit response to bacterial spot infection. Our study confirms that with only two Ppe.XapF DNA tests, Ppe.XapF1-1 and Ppe.XapF6-2, individuals carrying susceptible alleles can be identified. Use of these efficient and accurate Ppe.XapF KASP tests resulted in 44% reduction in seedling planting rate in the Clemson University peach breeding program.


Conflict of interest statement

The authors have declared that no competing interests exist.

Figures

Fig 1
Fig 1. Results from KASP assay for SNPs on Ppe.XapF1 using clean DNA extraction and previously genotyped samples.
Solid yellow shapes indicate positive controls, solid red indicates an unknown that failed to amplify, and empty shapes indicate unknowns, with the shape indicating the assigned genotype as follows: circle = no template/no amplification, triangle = AA, diamond = AB, square = BB. Dashed lines in plots in the top row indicate boundaries for no amplification (% fluorescence < ~20% for both fluorophores). Dashed lines in plots in the bottom row indicate delta (% HEX—% FAM) values separating heterozygous and homozygous genotypes, adjusted to reflect assay conditions. A,B = F1-1; C,D = F1-2; E,F = F1-3; G,H = F1-4.
Fig 2
Fig 2. Results from KASP assay for SNPs on Ppe.XapF6 using clean DNA extraction and previously genotyped samples.
Solid yellow shapes indicate positive controls, and empty shapes indicate unknowns, with the shape indicating the assigned genotype as follows: circle = no template/no amplification, triangle = AA, diamond = AB, square = BB. Dashed lines in plots in the top row indicate boundaries for no amplification (% fluorescence < ~20% for both fluorophores). Dashed lines in plots in the bottom row indicate delta (% HEX—% FAM) values separating heterozygous and homozygous genotypes, adjusted to reflect assay conditions. Points are automatically encircled in red when they are close enough to the dashed lines in the bottom row that manual inspection is advised. A,B = F6-2; C,D = F6-3; E,F = F6-4.
Fig 3
Fig 3. Results from KASP assays for two SNPs, Ppe.Xap F1-1 and Ppe.Xap F6-2, using endpoint PCR with previously genotyped samples.
Solid yellow shapes indicate positive controls, solid red indicates an unknown that failed to amplify, and empty shapes indicate unknowns, with the shape indicating the assigned genotype as follows: circle = no template/no amplification, triangle = AA, diamond = AB, square = BB. Dashed lines in plots in the top row indicate boundaries for no amplification (% fluorescence < ~20% for both fluorophores). Dashed lines in plots in the bottom row indicate delta (% HEX—% FAM) values separating heterozygous and homozygous genotypes, adjusted to reflect assay conditions.
Fig 4
Fig 4. Results from KASP assay for two SNPs, Ppe.Xap F1-1 and Ppe.Xap F6-2, using endpoint PCR with crude DNA extracts from greenhouse-grown seedling samples.
Solid yellow shapes indicate positive controls, solid red indicates an unknown that failed to amplify, and empty shapes indicate unknowns, with the shape indicating the assigned genotype as follows: circle = no template/no amplification, triangle = AA, diamond = AB, square = BB. Dashed lines in plots in the top row indicate boundaries for no amplification (% fluorescence < ~20% for both fluorophores). Dashed lines in plots in the bottom row indicate delta (% HEX—% FAM) values separating heterozygous and homozygous genotypes, adjusted to reflect assay conditions.

Similar articles

Cited by

References

    1. Bassi D, Monet Rene. Botany and Taxonomy. In: Layne DR, Bassi D, editors. The Peach: Botany, Production and Use. London, UK.: CABI; 2008. pp. 1–36.
    1. Abdelghafar A, Burrell R, Reighard G, Gasic K. Antioxidant capacity and bioactive compounds accumulation in peach breeding germplasm. J Am Pom Soc. 2018;72: 40–69.
    1. Cantin CM, Moreno MA, Gogorcena Y. Evaluation of the antioxidant capacity, phenolic compounds, and vitamin C content of different peach and nectarine [Prunus persica (L.) Batsch] breeding progenies. J Agric Food Chem. 2009;57: 4586–4592. doi: 10.1021/jf900385a - DOI - PubMed
    1. FAOSTAT. Crops Data. 2019. Available: http://www.fao.org/faostat/en/#data/QC.
    1. Byrne DH. Trends in stone fruit cultivar development. HortTech. 2005;15: 494–500.

Publication types

MeSH terms

Supplementary concepts