

Trends in Severe Acute Respiratory Syndrome Coronavirus 2 (SARS-CoV-2) Seroprevalence in Massachusetts Estimated from Newborn Screening Specimens
- PMID: 35213690
- PMCID: PMC8903451
- DOI: 10.1093/cid/ciac158
Trends in Severe Acute Respiratory Syndrome Coronavirus 2 (SARS-CoV-2) Seroprevalence in Massachusetts Estimated from Newborn Screening Specimens
Abstract
Background: Estimating the cumulative incidence of severe acute respiratory syndrome coronavirus 2 (SARS-CoV-2) is essential for setting public health policies. We leveraged deidentified Massachusetts newborn screening specimens as an accessible, retrospective source of maternal antibodies for estimating statewide seroprevalence in a nontest-seeking population.
Methods: We analyzed 72 117 newborn specimens collected from November 2019 through December 2020, representing 337 towns and cities across Massachusetts. Seroprevalence was estimated for the Massachusetts population after correcting for imperfect test specificity and nonrepresentative sampling using Bayesian multilevel regression and poststratification.
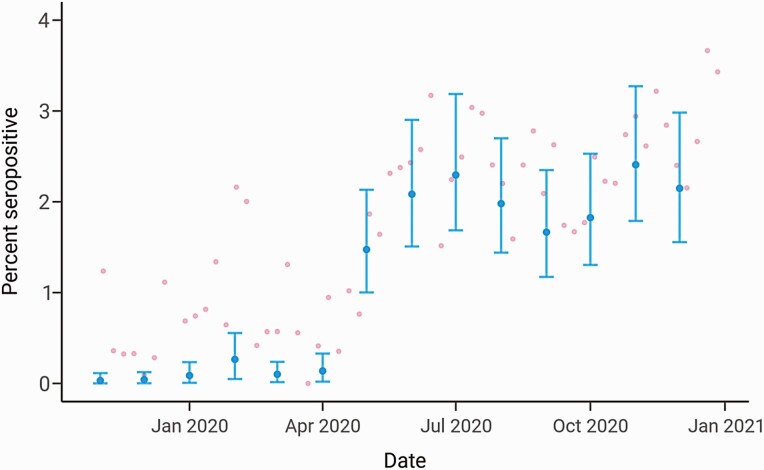
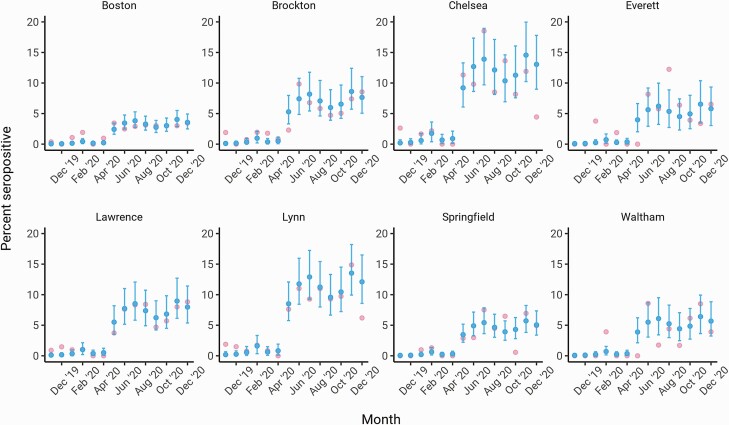
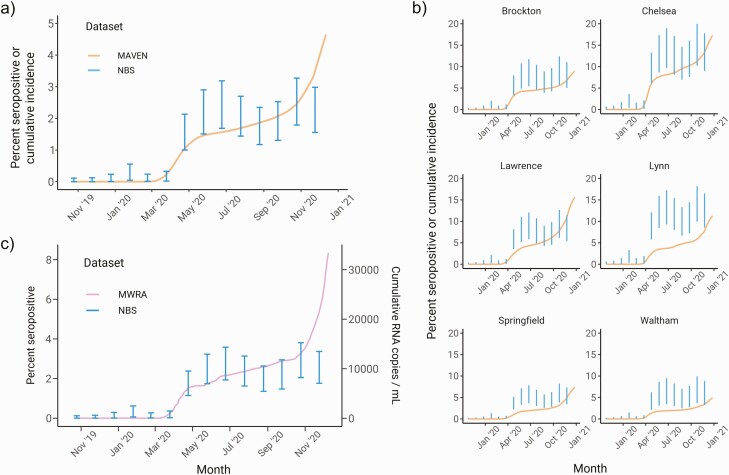
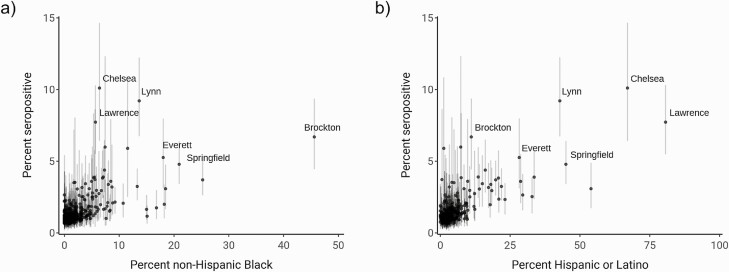
Results: Statewide seroprevalence was estimated to be 0.03% (90% credible interval [CI], 0.00-0.11) in November 2019 and rose to 1.47% (90% CI: 1.00-2.13) by May 2020, following sustained SARS-CoV-2 transmission in the spring. Seroprevalence plateaued from May onward, reaching 2.15% (90% CI: 1.56-2.98) in December 2020. Seroprevalence varied substantially by community and was particularly associated with community percent non-Hispanic Black (β = .024; 90% CI: 0.004-0.044); i.e., a 10% increase in community percent non-Hispanic Black was associated with 27% higher odds of seropositivity. Seroprevalence estimates had good concordance with reported case counts and wastewater surveillance for most of 2020, prior to the resurgence of transmission in winter.
Conclusions: Cumulative incidence of SARS-CoV-2 protective antibody in Massachusetts was low as of December 2020, indicating that a substantial fraction of the population was still susceptible. Maternal seroprevalence data from newborn screening can inform longitudinal trends and identify cities and towns at highest risk, particularly in settings where widespread diagnostic testing is unavailable.
Keywords: SARS-CoV-2; newborn screening; seroprevalence.
© The Author(s) 2022. Published by Oxford University Press for the Infectious Diseases Society of America. All rights reserved. For permissions, e-mail: journals.permissions@oup.com.
Figures
References
-
- Hoff R, Berardi VP, Weiblen BJ, Mahoney-Trout L, Mitchell ML, Grady GF.. Seroprevalence of human immunodeficiency virus among childbearing women. Estimation by testing samples of blood from newborns. N Engl J Med 1988; 318:525–30. - PubMed
-
- Gwinn M, Pappaioanou M, George JR, et al. Prevalence of HIV infection in childbearing women in the United States. Surveillance using newborn blood samples. JAMA 1991; 265:1704–8. - PubMed
-
- Park DK, Gelman A, Bafumi J.. Bayesian multilevel estimation with poststratification: state-level estimates from national polls. Polit Anal 2004; 12:375–85.
Publication types
MeSH terms
Substances
Grants and funding
LinkOut - more resources
Full Text Sources
Other Literature Sources
Medical
Miscellaneous
