

Adaptation of the Kirkstall QV600 LLI Microfluidics System for the Study of Gastrointestinal Absorption by Mass Spectrometry Imaging and LC-MS/MS
- PMID: 35214096
- PMCID: PMC8878338
- DOI: 10.3390/pharmaceutics14020364
Adaptation of the Kirkstall QV600 LLI Microfluidics System for the Study of Gastrointestinal Absorption by Mass Spectrometry Imaging and LC-MS/MS
Abstract
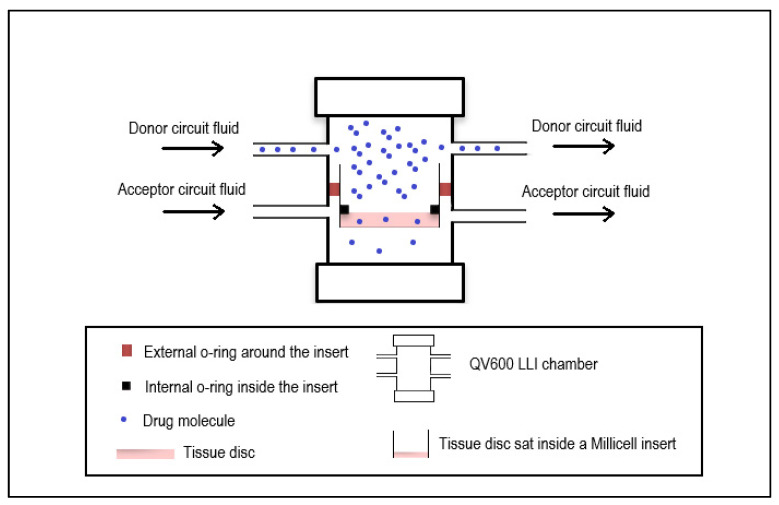
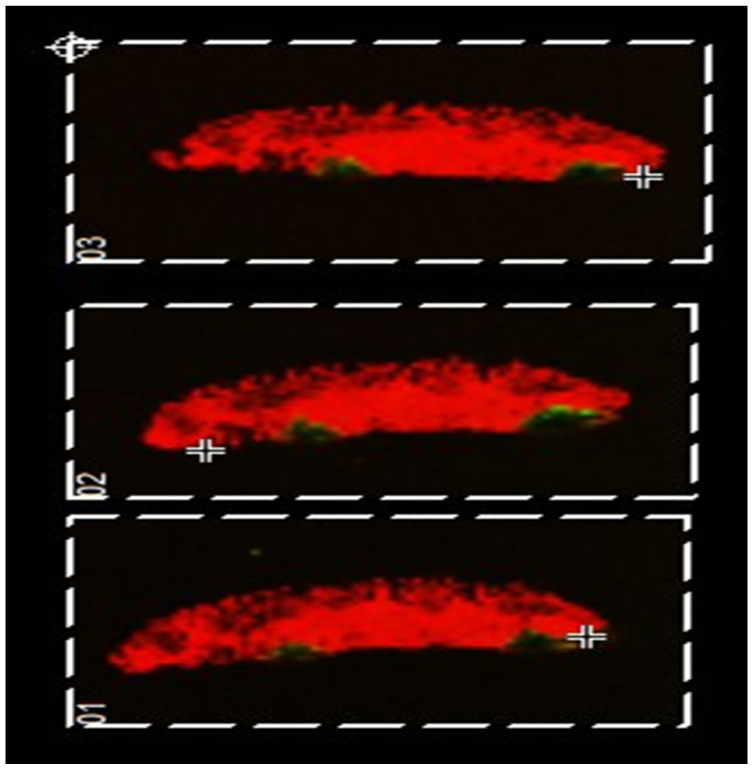
Absorption studies on oral drugs can be difficult due to the challenge of replicating the complex structure and environment of the GI tract. Drug absorption studies can be conducted using in vivo and ex vivo animal tissue or animal-free techniques. These studies typically involve the use of Caco-2 cells. However, Caco-2 cells do not incorporate all the cell types found in intestinal tissue and lack P450 metabolizing enzymes. The QV600 LLI system is a microfluidics system designed for use with cell culture. Here, it has been adapted to house appropriate sections of ex vivo porcine tissue to act as a system that models the duodenum section of the small intestine. A pH regulated solution of Atorvastatin was flowed over the apical layer of the GI tissue and a nutrient solution flowed over the basal layer of the tissue to maintain tissue viability. The tissue samples were snap-frozen, cryosectioned, and imaged using MALDI Mass Spectrometry Imaging (MSI). A proof-of-concept study on the effect of excipients on absorption was conducted. Different concentrations of the solubilizing agent were added to the donor circuit of the QV600 LLI. The amount of Atorvastatin in the acceptor circuit was determined to study the effect of the excipient on the amount of drug that had permeated through the tissue. Using these data, Papp, pig values were calculated and compared with the literature.
Keywords: Atorvastatin; mass spectrometry imaging; microfluidics; polysorbate 80.
Conflict of interest statement
Employees Stephen Rumbelow and Steve Mellor are employed at CRODA. The company CRODA are the industrial collaborators in the BBSRC iCASE PhD studentship detailed above. The other authors declare no conflict of interest.
Figures


Similar articles
-
The Adaptation of the QV600 LLI Milli-Fluidics System to House Ex Vivo Gastrointestinal Tissue Suitable for Drug Absorption and Permeation Studies, Utilizing MALDI MSI and LC-MS/MS.Methods Mol Biol. 2023;2688:71-82. doi: 10.1007/978-1-0716-3319-9_7. Methods Mol Biol. 2023. PMID: 37410285
-
A new approach to predict human intestinal absorption using porcine intestinal tissue and biorelevant matrices.Eur J Pharm Sci. 2014 Oct 15;63:167-77. doi: 10.1016/j.ejps.2014.07.003. Epub 2014 Jul 18. Eur J Pharm Sci. 2014. PMID: 25046168
-
Advantage of the Dissolution/Permeation System for Estimating Oral Absorption of Drug Candidates in the Drug Discovery Stage.Mol Pharm. 2016 May 2;13(5):1564-74. doi: 10.1021/acs.molpharmaceut.6b00044. Epub 2016 Apr 13. Mol Pharm. 2016. PMID: 27031624
-
Caco-2 cell permeability assays to measure drug absorption.Expert Opin Drug Metab Toxicol. 2005 Aug;1(2):175-85. doi: 10.1517/17425255.1.2.175. Expert Opin Drug Metab Toxicol. 2005. PMID: 16922635 Review.
-
Increasing the throughput and productivity of Caco-2 cell permeability assays using liquid chromatography-mass spectrometry: application to resveratrol absorption and metabolism.Comb Chem High Throughput Screen. 2003 Dec;6(8):757-67. doi: 10.2174/138620703771826865. Comb Chem High Throughput Screen. 2003. PMID: 14683481 Review.
Cited by
-
Microfluidic nanodevices for drug sensing and screening applications.Biosens Bioelectron. 2023 Jan 1;219:114783. doi: 10.1016/j.bios.2022.114783. Epub 2022 Oct 5. Biosens Bioelectron. 2023. PMID: 36257116 Free PMC article.
References
Grants and funding
LinkOut - more resources
Full Text Sources
