

A Unique Core-Shell Structured, Glycol Chitosan-Based Nanoparticle Achieves Cancer-Selective Gene Delivery with Reduced Off-Target Effects
- PMID: 35214105
- PMCID: PMC8878887
- DOI: 10.3390/pharmaceutics14020373
A Unique Core-Shell Structured, Glycol Chitosan-Based Nanoparticle Achieves Cancer-Selective Gene Delivery with Reduced Off-Target Effects
Abstract
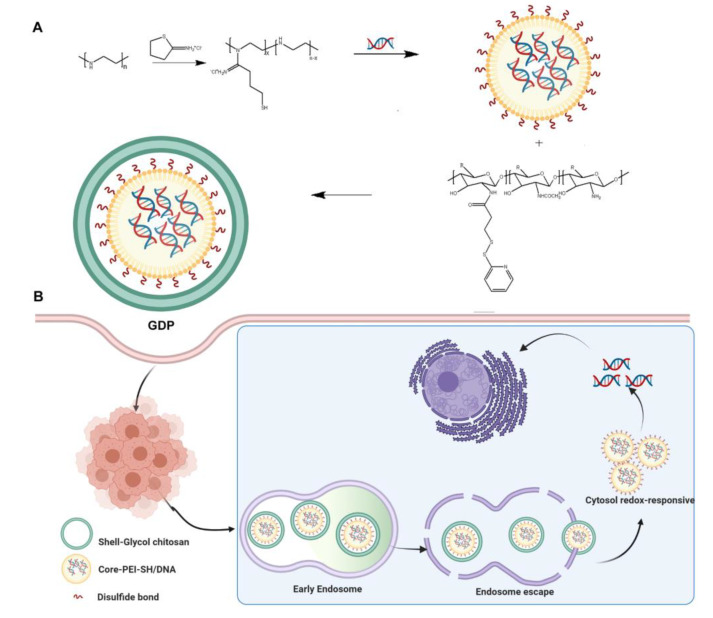
The inherent instability of nucleic acids within serum and the tumor microenvironment necessitates a suitable vehicle for non-viral gene delivery to malignant lesions. A specificity-conferring mechanism is also often needed to mitigate off-target toxicity. In the present study, we report a stable and efficient redox-sensitive nanoparticle system with a unique core-shell structure as a DNA carrier for cancer theranostics. Thiolated polyethylenimine (PEI-SH) is complexed with DNA through electrostatic interactions to form the core, and glycol chitosan-modified with succinimidyl 3-(2-pyridyldithio)propionate (GCS-PDP) is grafted on the surface through a thiolate-disulfide interchange reaction to form the shell. The resulting nanoparticles, GCS-PDP/PEI-SH/DNA nanoparticles (GNPs), exhibit high colloid stability in a simulated physiological environment and redox-responsive DNA release. GNPs not only show a high and redox-responsive cellular uptake, high transfection efficiency, and low cytotoxicity in vitro, but also exhibit selective tumor targeting, with minimal toxicity, in vivo, upon systemic administration. Such a performance positions GNPs as viable candidates for molecular-genetic imaging and theranostic applications.
Keywords: gene delivery; molecular-genetic imaging; reporter–probe pair; systemic delivery; toxicity.
Conflict of interest statement
The authors declare no conflict of interest.
Figures


Similar articles
-
Bioreducible PEI-functionalized glycol chitosan: A novel gene vector with reduced cytotoxicity and improved transfection efficiency.Carbohydr Polym. 2016 Nov 20;153:160-168. doi: 10.1016/j.carbpol.2016.07.080. Epub 2016 Jul 21. Carbohydr Polym. 2016. PMID: 27561483
-
Bioreducible polyethylenimine core-shell nanostructures as efficient and non-toxic gene and drug delivery vectors.Bioorg Med Chem. 2022 Sep 1;69:116886. doi: 10.1016/j.bmc.2022.116886. Epub 2022 Jun 17. Bioorg Med Chem. 2022. PMID: 35749840
-
PEI-PEG-Chitosan Copolymer Coated Iron Oxide Nanoparticles for Safe Gene Delivery: synthesis, complexation, and transfection.Adv Funct Mater. 2009 Jul 24;19(14):2244-2251. doi: 10.1002/adfm.200801844. Adv Funct Mater. 2009. PMID: 20160995 Free PMC article.
-
Polyethylenimine-based Formulations for Delivery of Oligonucleotides.Curr Med Chem. 2019;26(13):2264-2284. doi: 10.2174/0929867325666181031094759. Curr Med Chem. 2019. PMID: 30378483 Review.
-
Lipid-polymer hybrid nanoparticles as a new generation therapeutic delivery platform: a review.Eur J Pharm Biopharm. 2013 Nov;85(3 Pt A):427-43. doi: 10.1016/j.ejpb.2013.07.002. Epub 2013 Jul 17. Eur J Pharm Biopharm. 2013. PMID: 23872180 Review.
Cited by
-
Nanoscale Contrast Agents for Ultrasound Imaging of Musculoskeletal System.Diagnostics (Basel). 2022 Oct 25;12(11):2582. doi: 10.3390/diagnostics12112582. Diagnostics (Basel). 2022. PMID: 36359426 Free PMC article. Review.
-
State-of-the-art photodynamic therapy for malignant gliomas: innovations in photosensitizers and combined therapeutic approaches.Explor Target Antitumor Ther. 2025 Mar 28;6:1002303. doi: 10.37349/etat.2025.1002303. eCollection 2025. Explor Target Antitumor Ther. 2025. PMID: 40177536 Free PMC article. Review.
-
Revisiting of Properties and Modified Polyethylenimine-Based Cancer Gene Delivery Systems.Biochem Genet. 2024 Feb;62(1):18-39. doi: 10.1007/s10528-023-10416-7. Epub 2023 Jul 2. Biochem Genet. 2024. PMID: 37394575 Review.
-
Berberine's Impact on Apoptosis, Proliferation, Uptake Efficiency, and Nanoparticle-Based Therapy in DBTRG Cells.ACS Nanosci Au. 2025 Apr 18;5(3):165-183. doi: 10.1021/acsnanoscienceau.5c00004. eCollection 2025 Jun 18. ACS Nanosci Au. 2025. PMID: 40556818 Free PMC article.
References
Grants and funding
LinkOut - more resources
Full Text Sources
