

A Novel Approach to Dining Bowl Reconstruction for Image-Based Food Volume Estimation
- PMID: 35214399
- PMCID: PMC8877095
- DOI: 10.3390/s22041493
A Novel Approach to Dining Bowl Reconstruction for Image-Based Food Volume Estimation
Abstract
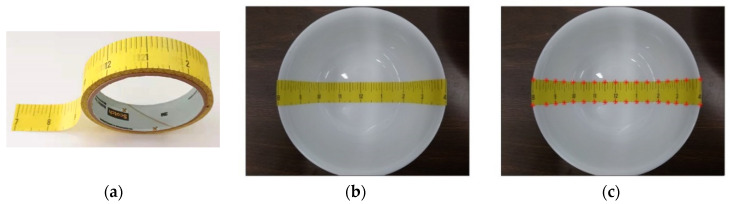
Knowing the amounts of energy and nutrients in an individual's diet is important for maintaining health and preventing chronic diseases. As electronic and AI technologies advance rapidly, dietary assessment can now be performed using food images obtained from a smartphone or a wearable device. One of the challenges in this approach is to computationally measure the volume of food in a bowl from an image. This problem has not been studied systematically despite the bowl being the most utilized food container in many parts of the world, especially in Asia and Africa. In this paper, we present a new method to measure the size and shape of a bowl by adhering a paper ruler centrally across the bottom and sides of the bowl and then taking an image. When observed from the image, the distortions in the width of the paper ruler and the spacings between ruler markers completely encode the size and shape of the bowl. A computational algorithm is developed to reconstruct the three-dimensional bowl interior using the observed distortions. Our experiments using nine bowls, colored liquids, and amorphous foods demonstrate high accuracy of our method for food volume estimation involving round bowls as containers. A total of 228 images of amorphous foods were also used in a comparative experiment between our algorithm and an independent human estimator. The results showed that our algorithm overperformed the human estimator who utilized different types of reference information and two estimation methods, including direct volume estimation and indirect estimation through the fullness of the bowl.
Keywords: 3D reconstruction; food volume estimation; image-based dietary assessment; round bowl.
Conflict of interest statement
The authors declare no conflict of interest.
Figures


Similar articles
-
Dining Bowl Modeling and Optimization for Single-Image-Based Dietary Assessment.Sensors (Basel). 2024 Sep 19;24(18):6058. doi: 10.3390/s24186058. Sensors (Basel). 2024. PMID: 39338803 Free PMC article.
-
Estimating Amount of Food in a Circular Dining Bowl from a Single Image.Madima 23 (2023). 2023 Oct;2023:1-9. doi: 10.1145/3607828.3617789. Epub 2023 Oct 29. Madima 23 (2023). 2023. PMID: 38288389 Free PMC article.
-
Counting Bites With Bits: Expert Workshop Addressing Calorie and Macronutrient Intake Monitoring.J Med Internet Res. 2019 Dec 4;21(12):e14904. doi: 10.2196/14904. J Med Internet Res. 2019. PMID: 31799938 Free PMC article.
-
Image-based food portion size estimation using a smartphone without a fiducial marker.Public Health Nutr. 2019 May;22(7):1180-1192. doi: 10.1017/S136898001800054X. Epub 2018 Apr 6. Public Health Nutr. 2019. PMID: 29623867 Free PMC article.
-
Estimating Dining Plate Size From an Egocentric Image Sequence Without a Fiducial Marker.Front Nutr. 2021 Jan 14;7:519444. doi: 10.3389/fnut.2020.519444. eCollection 2020. Front Nutr. 2021. PMID: 33521029 Free PMC article. Review.
Cited by
-
Innovative food supply chain through spatial computing technologies: A review.Compr Rev Food Sci Food Saf. 2024 Nov;23(6):e70055. doi: 10.1111/1541-4337.70055. Compr Rev Food Sci Food Saf. 2024. PMID: 39610261 Free PMC article. Review.
-
Amount Estimation Method for Food Intake Based on Color and Depth Images through Deep Learning.Sensors (Basel). 2024 Mar 22;24(7):2044. doi: 10.3390/s24072044. Sensors (Basel). 2024. PMID: 38610258 Free PMC article.
-
Dining Bowl Modeling and Optimization for Single-Image-Based Dietary Assessment.Sensors (Basel). 2024 Sep 19;24(18):6058. doi: 10.3390/s24186058. Sensors (Basel). 2024. PMID: 39338803 Free PMC article.
-
Estimating Amount of Food in a Circular Dining Bowl from a Single Image.Madima 23 (2023). 2023 Oct;2023:1-9. doi: 10.1145/3607828.3617789. Epub 2023 Oct 29. Madima 23 (2023). 2023. PMID: 38288389 Free PMC article.
References
-
- Madival S.A., Jawaligi S.S. A comprehensive review and open issues on food image analysis and dietary assessment; Proceedings of the 2020 3rd International Conference on Intelligent Sustainable Systems (ICISS); Thoothukudi, India. 3–5 December 2020; pp. 414–420.
-
- Bell B.M., Alam R., Alshurafa N., Thomaz E., Mondol A.S., de la Haye K., Stankovic J.A., Lach J., Spruijt-Metz D. Automatic, wearable-based, in-field eating detection approaches for public health research: A scoping review. NPJ Digit. Med. 2020;3:38. doi: 10.1038/s41746-020-0246-2. - DOI - PMC - PubMed
-
- Jobarteh M.L., McCrory M.A., Lo B., Sun M., Sazonov E., Anderson A.K., Jia W., Maitland K., Qiu J., Steiner-Asiedu M., et al. Development and validation of an objective, passive dietary assessment method for estimating food and nutrient intake in households in low- and middle-income countries: A study protocol. Curr. Dev. Nutr. 2020;4:nzaa020. doi: 10.1093/cdn/nzaa020. - DOI - PMC - PubMed
-
- Vu T., Lin F., Alshurafa N., Xu W. Wearable food intake monitoring technologies: A comprehensive review. Computers. 2017;6:4. doi: 10.3390/computers6010004. - DOI
MeSH terms
Grants and funding
- Grant No: R56 DK113819 and R01 DK127310/National Institute of Health
- R56 DK113819/DK/NIDDK NIH HHS/United States
- Cooperative Agreement 58-3092-5-001/US Department of Agriculture, Agricultural Research Service
- R01 DK127310/DK/NIDDK NIH HHS/United States
- Contract ID: OPP1171395)/GATES/Bill & Melinda Gates Foundation/United States
LinkOut - more resources
Full Text Sources
Research Materials
