

Impact of Single and Combined Salinity and High-Temperature Stresses on Agro-Physiological, Biochemical, and Transcriptional Responses in Rice and Stress-Release
- PMID: 35214835
- PMCID: PMC8876766
- DOI: 10.3390/plants11040501
Impact of Single and Combined Salinity and High-Temperature Stresses on Agro-Physiological, Biochemical, and Transcriptional Responses in Rice and Stress-Release
Abstract
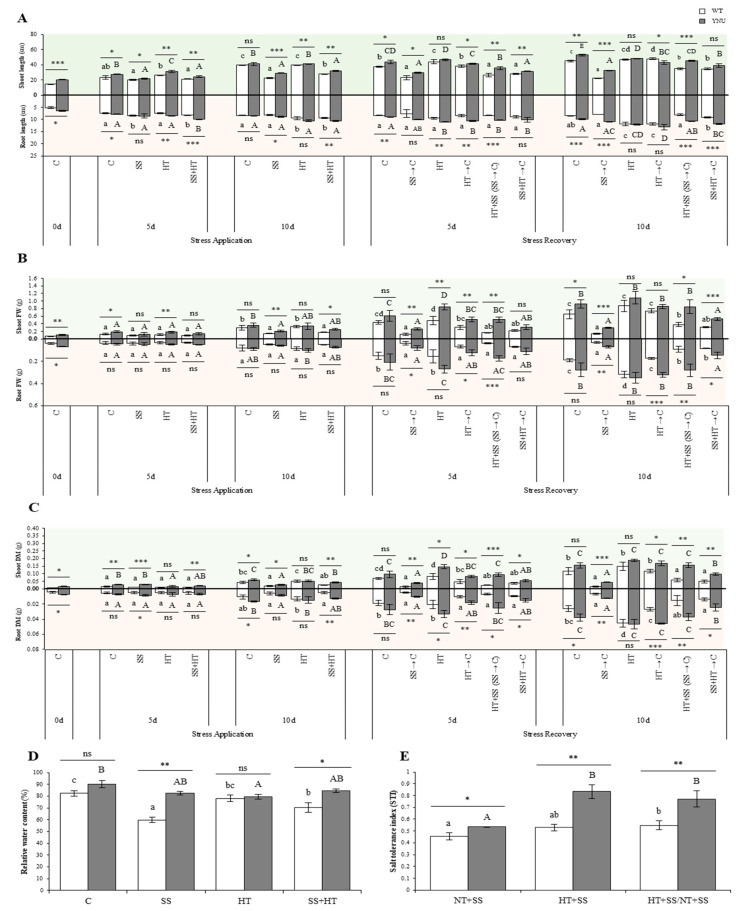
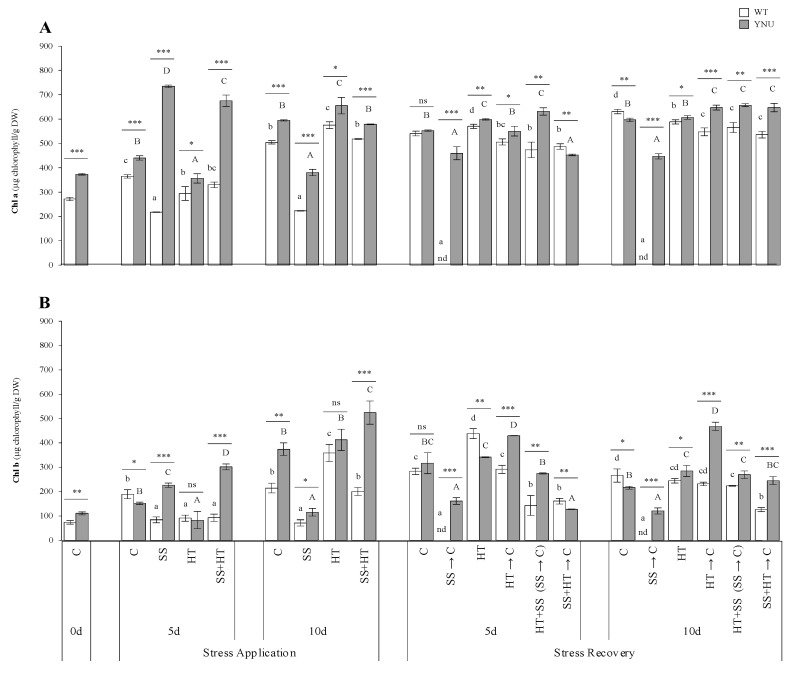
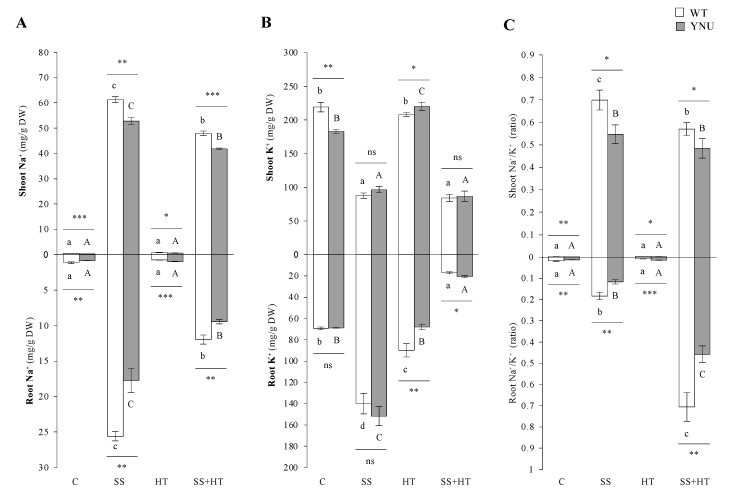
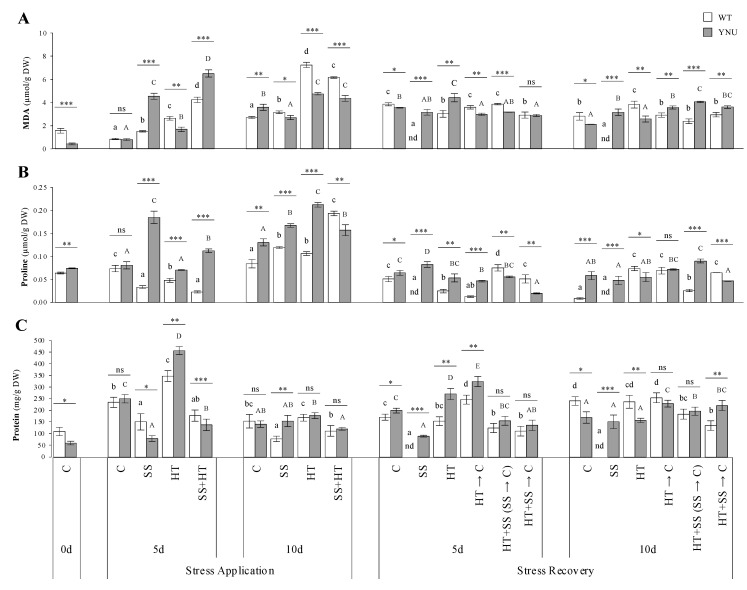
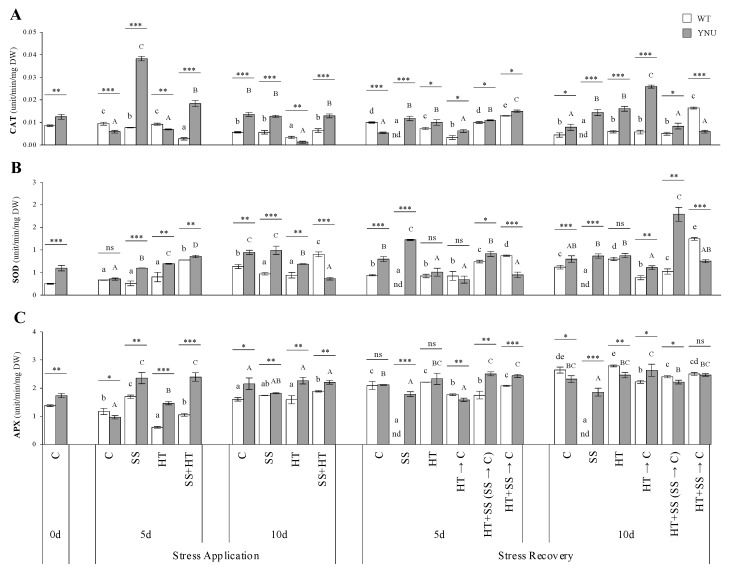
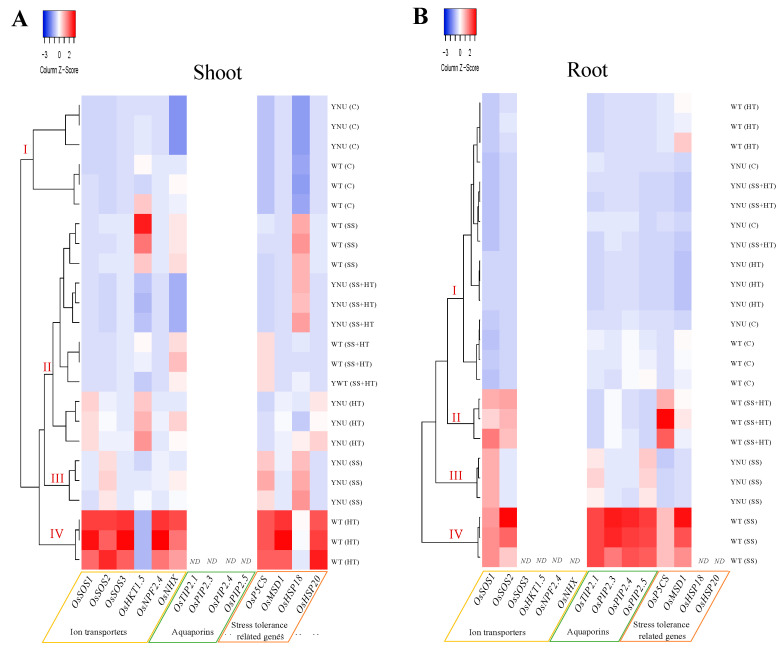
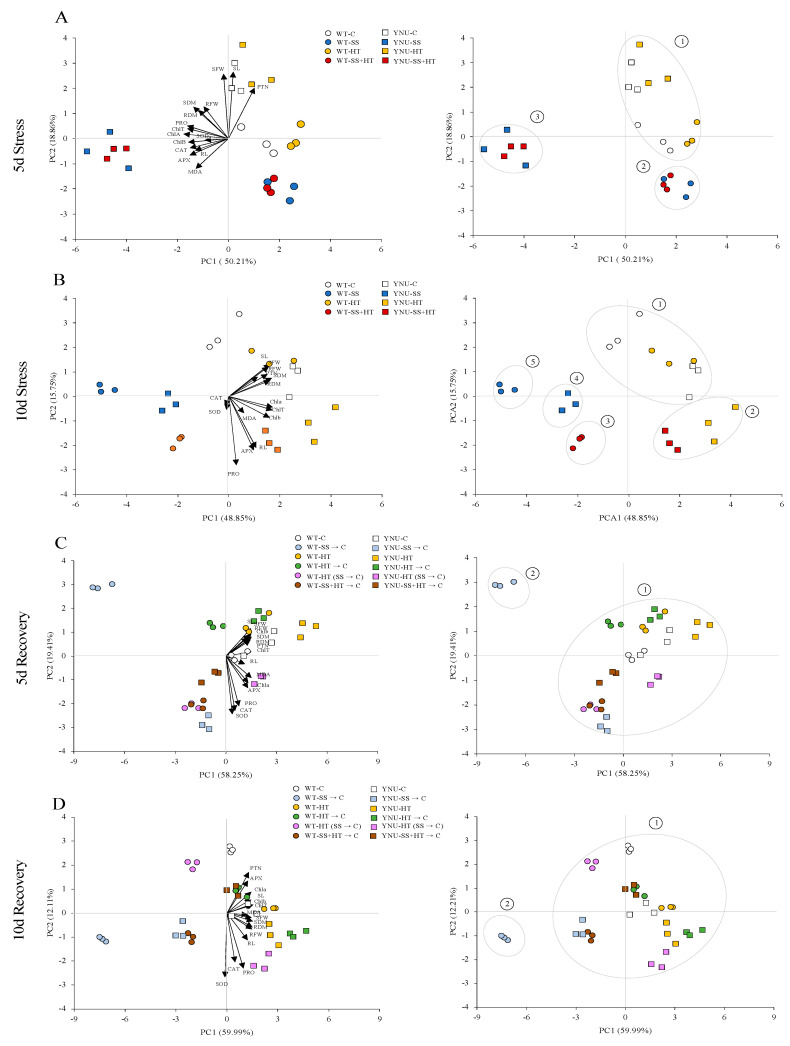
Here, for the first time, we aimed to identify in rice the key mechanisms and processes underlying tolerance to high-temperature (HT) or salt stress (SS) alone, the co-occurrence of both stresses, and recovery using physiological and biochemical measurements and gene expression analysis. We also investigated whether recovery from the two stressors depended on the relative intensities/relief of each stressor. Wild type ('Yukinkomai') rice plants were found to be more susceptible to salinity or heat applied individually. SS leads to a depletion of cellular water content, higher accumulation of Na+, and alterations in photosynthetic pigments. The stress-tolerant cultivar 'YNU31-2-4' (YNU) displayed a lower Na+/K+ ratio, higher water content in cells and improved photosynthetic traits, antioxidant system, and expression of defence genes. Strikingly, the SS + HT combination provided a significant level of protection to rice plants from the effects of SS alone. The expression pattern of a selected set of genes showed a specific response and dedicated pathways in plants subjected to each of the different stresses, while other genes were explicitly activated when the stresses were combined. Aquaporin genes were activated by SS, while stress-related (P5CS, MSD1, HSPs, and ions transporters) genes were shaped by HT. Hierarchical clustering and principal component analyses showed that several traits exhibited a gradually aggravating effect as plants were exposed to the combined stresses and identified heat as a mitigating factor, clearly separating heat + salt-stressed from salt-non-heat-stressed plants. Furthermore, seedling recovery was far more dependent on the relative intensities of stressors and cultivars, demonstrating the influence of one stressor over another upon stress-release. Taken together, our data show the uniqueness and complexity of the physiological and molecular network modules used by rice plants to respond to single and combined stresses and recovery.
Keywords: coupled stress; heat; independent/interactive effects; individual stress; recovery; salt stress.
Conflict of interest statement
The authors declare that they have no known competing financial interests or personal relationships that could have appeared to influence the work reported in this paper.
Figures
Similar articles
-
Tolerance with High Yield Potential Is Provided by Lower Na+ Ion Accumulation and Higher Photosynthetic Activity in Tolerant YNU31-2-4 Rice Genotype under Salinity and Multiple Heat and Salinity Stress.Plants (Basel). 2023 May 8;12(9):1910. doi: 10.3390/plants12091910. Plants (Basel). 2023. PMID: 37176968 Free PMC article.
-
Differential modulation of photosynthesis, ROS and antioxidant enzyme activities in stress-sensitive and -tolerant rice cultivars during salinity and drought upon restriction of COX and AOX pathways of mitochondrial oxidative electron transport.J Plant Physiol. 2022 Jan;268:153583. doi: 10.1016/j.jplph.2021.153583. Epub 2021 Nov 29. J Plant Physiol. 2022. PMID: 34871988
-
Unique Physiological and Transcriptional Shifts under Combinations of Salinity, Drought, and Heat.Plant Physiol. 2017 May;174(1):421-434. doi: 10.1104/pp.17.00030. Epub 2017 Mar 17. Plant Physiol. 2017. PMID: 28314795 Free PMC article.
-
Physiological and biochemical parameters for evaluation and clustering of rice cultivars differing in salt tolerance at seedling stage.Saudi J Biol Sci. 2016 Jul;23(4):467-77. doi: 10.1016/j.sjbs.2015.05.013. Epub 2015 May 23. Saudi J Biol Sci. 2016. PMID: 27298579 Free PMC article.
-
Biologia futura: combinatorial stress responses in fungi.Biol Futur. 2022 Jun;73(2):207-217. doi: 10.1007/s42977-022-00121-8. Epub 2022 Jun 15. Biol Futur. 2022. PMID: 35704178 Review.
Cited by
-
Algal Bio-Stimulants Enhance Salt Tolerance in Common Bean: Dissecting Morphological, Physiological, and Genetic Mechanisms for Stress Adaptation.Plants (Basel). 2023 Oct 29;12(21):3714. doi: 10.3390/plants12213714. Plants (Basel). 2023. PMID: 37960071 Free PMC article.
-
Intriguing Role of Proline in Redox Potential Conferring High Temperature Stress Tolerance.Front Plant Sci. 2022 Jun 10;13:867531. doi: 10.3389/fpls.2022.867531. eCollection 2022. Front Plant Sci. 2022. PMID: 35795343 Free PMC article. Review.
-
Microbial community changes correlate with impaired host fitness of Aurelia aurita after environmental challenge.Anim Microbiome. 2023 Sep 21;5(1):45. doi: 10.1186/s42523-023-00266-4. Anim Microbiome. 2023. PMID: 37735458 Free PMC article.
-
Bacillus velezensis Y6, a Potential and Efficient Biocontrol Agent in Control of Rice Sheath Blight Caused by Rhizoctonia solani.Microorganisms. 2024 Aug 16;12(8):1694. doi: 10.3390/microorganisms12081694. Microorganisms. 2024. PMID: 39203537 Free PMC article.
-
Exploring the Genotoxic Stress Response in Primed Orphan Legume Seeds Challenged with Heat Stress.Genes (Basel). 2025 Feb 19;16(2):235. doi: 10.3390/genes16020235. Genes (Basel). 2025. PMID: 40004564 Free PMC article.
References
-
- FAO AQUASTAT Main Database. Aquastat Database. 2016. [(accessed on 20 December 2021)]. Available online: https://www.fao.org/aquastat/statistics/query/index.html.
-
- Prasch C.M., Sonnewald U. Signaling Events in Plants: Stress Factors in Combination Change the Picture. Environ. Exp. Bot. 2015;114:4–14. doi: 10.1016/j.envexpbot.2014.06.020. - DOI
Grants and funding
LinkOut - more resources
Full Text Sources
Miscellaneous
