. 2022 Feb 12;14(4):774.
doi: 10.3390/nu14040774.

Time-of-Day Circadian Modulation of Grape-Seed Procyanidin Extract (GSPE) in Hepatic Mitochondrial Dynamics in Cafeteria-Diet-Induced Obese Rats

Affiliations

Time-of-Day Circadian Modulation of Grape-Seed Procyanidin Extract (GSPE) in Hepatic Mitochondrial Dynamics in Cafeteria-Diet-Induced Obese Rats

Romina M Rodríguez et al. Nutrients. .

Abstract

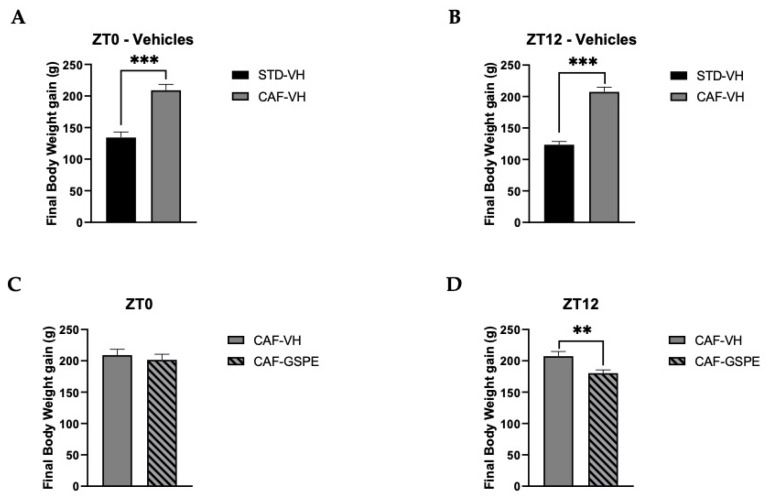
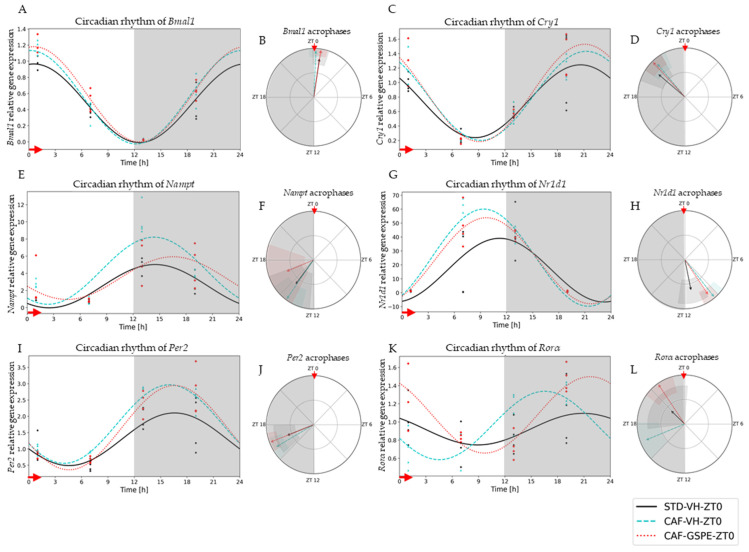
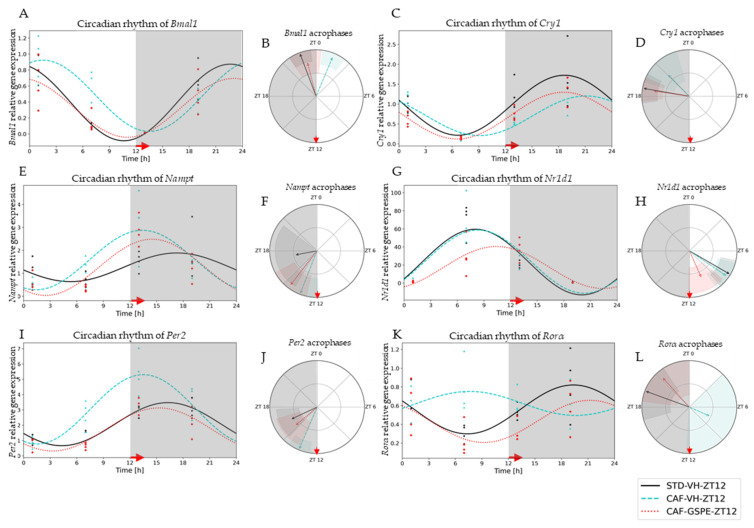
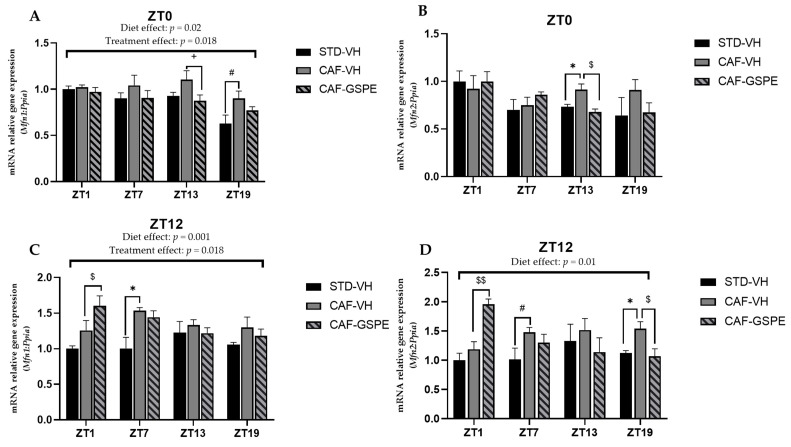
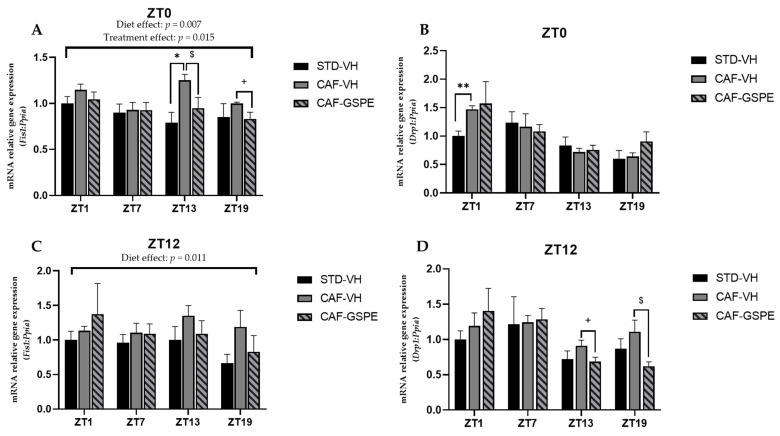
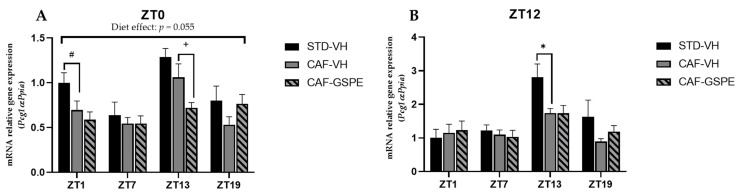
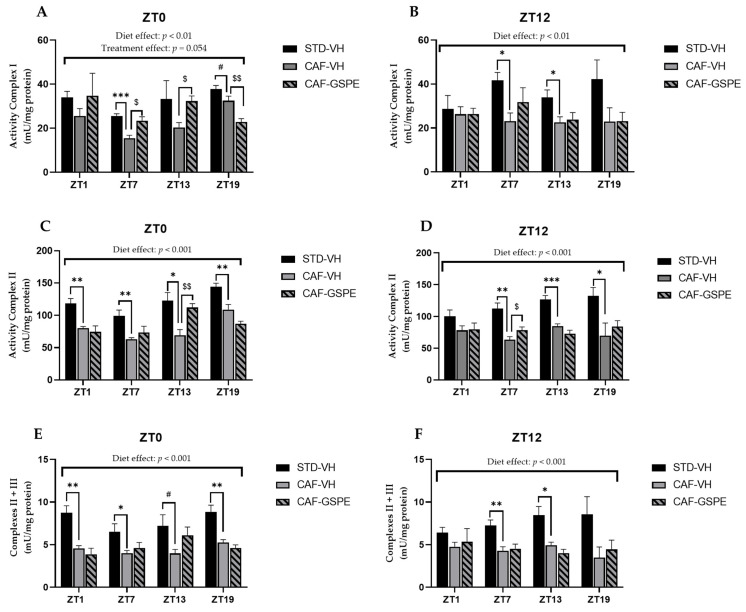
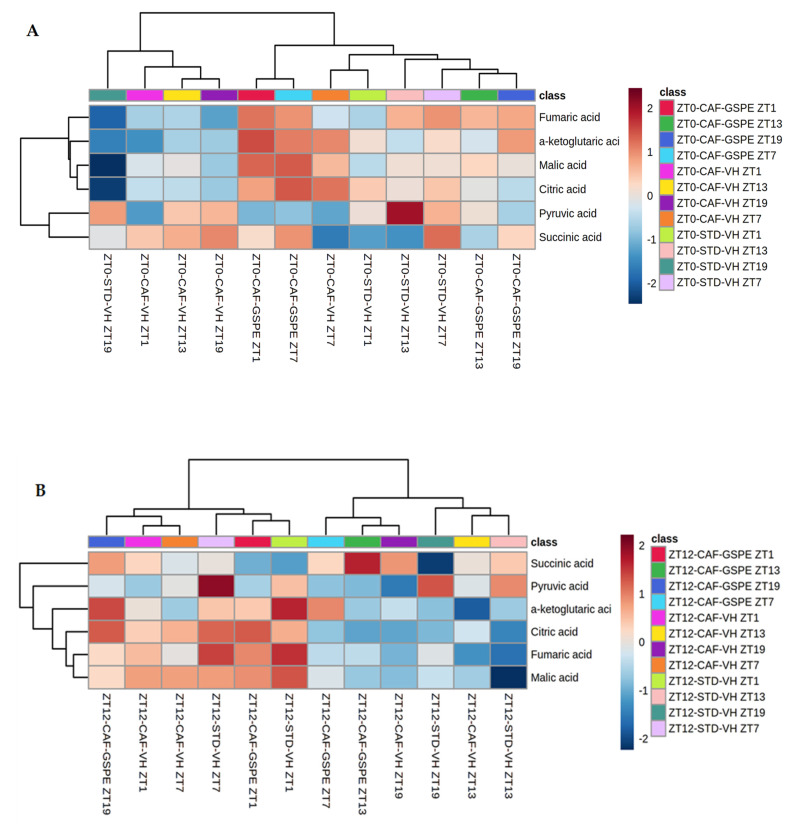
Major susceptibility to alterations in liver function (e.g., hepatic steatosis) in a prone environment due to circadian misalignments represents a common consequence of recent sociobiological behavior (i.e., food excess and sleep deprivation). Natural compounds and, more concisely, polyphenols have been shown as an interesting tool for fighting against metabolic syndrome and related consequences. Furthermore, mitochondria have been identified as an important target for mediation of the health effects of these compounds. Additionally, mitochondrial function and dynamics are strongly regulated in a circadian way. Thus, we wondered whether some of the beneficial effects of grape-seed procyanidin extract (GSPE) on metabolic syndrome could be mediated by a circadian modulation of mitochondrial homeostasis. For this purpose, rats were subjected to "standard", "cafeteria" and "cafeteria diet + GSPE" treatments (n = 4/group) for 9 weeks (the last 4 weeks, GSPE/vehicle) of treatment, administering the extract/vehicle at diurnal or nocturnal times (ZT0 or ZT12). For circadian assessment, one hour after turning the light on (ZT1), animals were sacrificed every 6 h (ZT1, ZT7, ZT13 and ZT19). Interestingly, GSPE was able to restore the rhythm on clock hepatic genes (Bmal1, Per2, Cry1, Rorα), as this correction was more evident in nocturnal treatment. Additionally, during nocturnal treatment, an increase in hepatic fusion genes and a decrease in fission genes were observed. Regarding mitochondrial complex activity, there was a strong effect of cafeteria diet at nearly all ZTs, and GSPE was able to restore activity at discrete ZTs, mainly in the diurnal treatment (ZT0). Furthermore, a differential behavior was observed in tricarboxylic acid (TCA) metabolites between GSPE diurnal and nocturnal administration times. Therefore, GSPE may serve as a nutritional preventive strategy in the recovery of hepatic-related metabolic disease by modulating mitochondrial dynamics, which is concomitant to the restoration of the hepatic circadian machinery.

Keywords: Zeitgebers; circadian rhythms; clock genes; grape-seed procyanidin extract; hepatic metabolism; mitochondrial dynamics; nutrition; obesity.


Conflict of interest statement

The authors declare no conflict of interest. The funders had no role in the design of the study; in the collection, analyses, or interpretation of data; in the writing of the manuscript, or in the decision to publish the results.

Figures

Figure 1
Figure 1
Body-weight gain (g). (A) Body-weight gain in grams of ZT0-vehicle rats (standard diet-vehicle (STD-VH) and cafeteria-diet-vehicle rats (CAF-VH) in the nine weeks of the experiment. (B) Body-weight gain in grams of ZT12-vehicle rats (STD-VH and CAF-VH) in the nine weeks of the experiment. (C) Body-weight gain in grams of ZT0-CAF-VH and cafeteria diet–grape-seed proanthocyanidin extract (CAF-GSPE) groups in the nine weeks of the experiment. (D) Body-weight gain in grams of ZT12 CAF-VH and CAF-GSPE groups in the nine weeks of the experiment. *** Indicates significant differences using repeatedly measured ANOVA followed by Student’s t test between VH groups (STD-VH vs. CAF-VH) (p ≤ 0.001); ** indicates significant differences within CAF groups (CAF-VH vs. CAF-GSPE) (p ≤ 0.01).
Figure 2
Figure 2
Estimated circadian rhythms (relative gene expression) of groups treated in the morning (ZT0). (A) Estimated circadian rhythms and (B) acrophases with their amplitudes represented of Bmal1 for ZT0-vehicle and treatments groups (STD-VH, CAF-VH and CAF-GSPE). (C) Estimated circadian rhythms and (D) acrophases with their amplitudes represented of Cry1 for ZT0-vehicles and treatments groups (STD-VH, CAF-VH and CAF-GSPE). (E) Estimated circadian rhythms and (F) acrophases with their amplitudes represented of Nampt for ZT0-vehicle and treatments groups (STD-VH, CAF-VH and CAF-GSPE). (G) Estimated circadian rhythms and (H) acrophases with their amplitudes represented of Nr1d1 for ZT0-vehicle and treatments groups (STD-VH, CAF-VH and CAF-GSPE). (I) Estimated circadian rhythms and (J) acrophases with their amplitudes represented of Per2 for ZT0-vehicle and treatments groups (STD-VH, CAF-VH and CAF-GSPE). (K) Estimated circadian rhythms and (L) acrophases with their amplitudes represented of Rorα for ZT0-vehicles and treatments groups (STD-VH, CAF-VH and CAF-GSPE).
Figure 3
Figure 3
Estimated circadian rhythms (relative gene expression) of groups treated at night (ZT12). (A) Estimated circadian rhythms and (B) acrophases with their amplitudes represented of Bmal1 for ZT12-Vehicles and Treatments Groups (STD-VH, CAF-VH and CAF-GSPE). (C) Estimated circadian rhythms and (D) acrophases with their amplitudes represented of Cry1 for ZT12-Vehicles and Treatments Groups (STD-VH, CAF-VH and CAF-GSPE). (E) Estimated circadian rhythms and (F) acrophases with their amplitudes represented of Nampt for ZT12-Vehicles and Treatments Groups (STD-VH, CAF-VH and CAF-GSPE). (G) Estimated circadian rhythms and (H) acrophases with their amplitudes represented of Nr1d1 for ZT12-Vehicles and Treatments Groups (STD-VH, CAF-VH and CAF-GSPE). (I) Estimated circadian rhythms and (J) acrophases with their amplitudes represented of Per2 for ZT12-Vehicles and Treatments Groups (STD-VH, CAF-VH and CAF-GSPE). (K) Estimated circadian rhythms and (L) acrophases with their amplitudes represented of Rorα for ZT12-Vehicles and Treatments Groups (STD-VH, CAF-VH and CAF-GSPE).
Figure 4
Figure 4
Relative gene expression of mitochondrial fusion genes in the liver. Rats were fed an STD or CAF diet and received a daily dosage of vehicle or GSPE in the morning (ZT0) (A,B) or at night (ZT12) (C,D). After 9 weeks, the rats were sacrificed at 9 a.m. (ZT1), 3 p.m. (ZT7), 9 p.m. (ZT13) or 3 a.m. (ZT19), and mRNA levels of Mfn1 and Mfn2 were determined. The values are the mean ± SEM (n = 4). * The effect of diet within vehicle groups (Student’s t test or DMS post hoc test, p < 0.05); $ the effect of GSPE consumption within CAF groups (Student’s t test or DMS post hoc test, $ p ≤ 0.05, $$ p ≤ 0.01); # indicates tendency between STD-VH and CAF-VH using Student’s t test (p = 0.1–0.051); + indicates tendency between CAF-VH and CAF-GSPE using Student’s t test (p = 0.1–0.051).
Figure 5
Figure 5
Relative gene expression of mitochondrial fission genes in the liver. Rats were fed an STD or CAF diet and received a daily dosage of vehicle or GSPE in the morning (ZT0) (A,B) or at night (ZT12) (C,D). After 9, weeks the rats were sacrificed at 9 a.m. (ZT1), 3 p.m. (ZT7), 9 p.m. (ZT13) or 3 a.m. (ZT19), and mRNA levels of Fis1 and Drp1 were determined. The values are the mean ± SEM (n = 4). * The effect of diet within vehicle groups (Student’s t test or DMS post hoc test, * p ≤ 0.05, ** p ≤ 0.01); $ the effect of GSPE consumption within CAF groups (Student’s t test or DMS post hoc test, p < 0.05; + indicates tendency between CAF-VH and CAF-GSPE using Student’s t test (p = 0.1–0.051).
Figure 6
Figure 6
Relative gene expression of mitochondrial biogenesis gen in the liver. Rats were fed an STD or CAF diet and received a daily dosage of vehicle or GSPE in the morning (ZT0) (A) or at night (ZT12) (B). After 9 weeks, the rats were sacrificed at 9 a.m. (ZT1), 3 p.m. (ZT7), 9 p.m. (ZT13) or 3 a.m. (ZT19), and mRNA levels of Pgc1α were determined. The values are the mean ± SEM (n = 4). * The effect of diet within vehicle groups (Student’s t test or DMS post-hoc test, p < 0.05); # indicates tendency between STD-VH and CAF-VH using Student’s t test (p = 0.1–0.051); + indicates tendency between CAF-VH and CAF-GSPE using Student’s t test (p = 0.1–0.051).
Figure 7
Figure 7
Mitochondrial respiratory activity in the liver. Rats were fed an STD or CAF diet and received a daily dosage of vehicle or GSPE in the morning (ZT0) (A,C,E) or at night (ZT12) (B,D,F). After 9 weeks, the rats were sacrificed at 9 a.m. (ZT1), 3 p.m. (ZT7), 9 p.m. (ZT13) or 3 a.m. (ZT19), and the activity of mitochondrial complexes I, II and III was determined. The values are the mean ± SEM (n = 4). * The effect of diet within vehicle groups (Student’s t test or DMS post hoc test, * p ≤ 0.05, ** p ≤ 0.01, *** p ≤ 0.001); $ the effect of GSPE consumption within CAF groups (Student’s t test or DMS post hoc test, $ p ≤ 0.05, $$ p ≤ 0.01); # indicates tendency between STD-VH and CAF-VH using Student’s t test (p = 0.1–0.051).
Figure 8
Figure 8
Heatmaps of TCA cycle metabolites in the liver. Rats were fed an STD or CAF diet and received a daily dosage of vehicle or GSPE in the morning (ZT0) (A) or at night (ZT12) (B). After 9 weeks, the rats were sacrificed at 9 a.m. (ZT1), 3 p.m. (ZT7), 9 p.m. (ZT13) or 3 a.m. (ZT19).

Similar articles

Cited by

References

    1. Hüttemann M., Helling S., Sanderson T.H., Sinkler C., Samavati L., Mahapatra G., Varughese A., Lu G., Liu J., Ramzan R., et al. Regulation of Mitochondrial Respiration and Apoptosis through Cell Signaling: Cytochrome c Oxidase and Cytochrome c in Ischemia/Reperfusion Injury and Inflammation. Biochim. Biophys. Acta Bioenerg. 2012;1817:598–609. doi: 10.1016/j.bbabio.2011.07.001. - DOI - PMC - PubMed
    1. Brand M.D., Orr A.L., Perevoshchikova I.V., Quinlan C.L. The Role of Mitochondrial Function and Cellular Bioenergetics in Ageing and Disease. Br. J. Dermatol. 2013;169:1–8. doi: 10.1111/bjd.12208. - DOI - PMC - PubMed
    1. Schrepfer E., Scorrano L. Mitofusins, from Mitochondria to Metabolism. Mol. Cell. 2016;61:683–694. doi: 10.1016/j.molcel.2016.02.022. - DOI - PubMed
    1. Kohsaka A., Das P., Hashimoto I., Nakao T., Deguchi Y., Gouraud S.S., Waki H., Muragaki Y., Maeda M. The Circadian Clock Maintains Cardiac Function by Regulating Mitochondrial Metabolism in Mice. PLoS ONE. 2014;9:e112811. doi: 10.1371/journal.pone.0112811. - DOI - PMC - PubMed
    1. Molina A.J.A., Wikstrom J.D., Stiles L., Las G., Mohamed H., Elorza A., Walzer G., Twig G., Katz S., Corkey B.E., et al. Mitochondrial Networking Protects β-Cells from Nutrient-Induced Apoptosis. Diabetes. 2009;58:2303–2315. doi: 10.2337/db07-1781. - DOI - PMC - PubMed

LinkOut - more resources